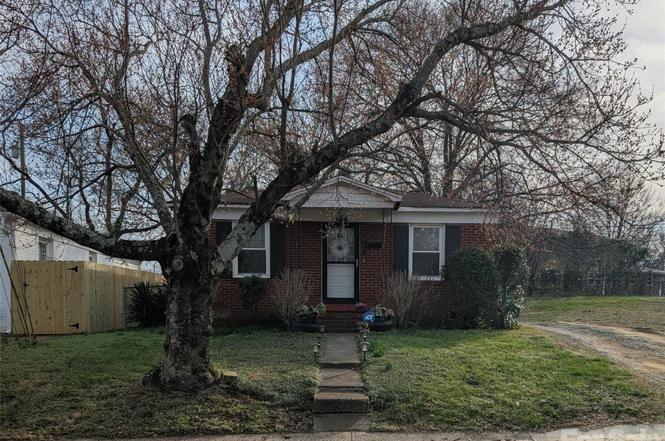
635 Chicago Ave · Charlotte, NC
Flood risk 1/10 · Minimal
- FEMA flood zone
- X (unshaded)
- Chance of flooding over 30 yrs
- 0.0%
- Est. flood insurance / yr
- $507 – $1,088
Fire risk 1/10 · Minimal
- Est. fire insurance / yr
- $906 – $1,684
Heat risk 6/10 · Moderate
- Hot days now (above 104°F)
- 7 days/yr
- Hot days in 30 yrs
- 17 days/yr
Wind risk 6/10 · Moderate
- Chance of severe wind over 30 yrs
- 27.0%
Air-quality risk 3/10 · Minor
- Unhealthy air days now
- 3 days/yr
- Unhealthy air days in 30 yrs
- 4 days/yr
Risk factors via First Street. Map © Google.
Why this score? — see what drove the C+ grade
The composite is a weighted blend of 9 inputs, each scored 0–100. Each bar is that input's sub-score; the figure is the points it added to the 100-point composite (weight × sub-score).
- Cash flow +26.9/30.0
- DSCR +9.3/10.0
- ARV discount +7.7/15.0
- 1% rule +6.4/10.0
- Livability +3.9/5.0
- Schools +3.8/10.0
- Rent growth +3.0/5.0
- Condition / age +2.5/5.0
- Appreciation +0.0/10.0
$230,000
🖨 Deal sheet 📄 Offer letter ✓ Due diligence
Key facts
- 3,920 sq ft lot
- Built 1962
- Listed 102 days
Property features AI
Finance
- HOA & community: No HOA
Exterior
- Parking: Driveway parking
- Utilities: City water; Public sewer
- Home design: Single-family residence; Site-built construction; One story; Residential zoning (N1-D)
- Construction: Brick exterior; Roof: Other (see remarks); Built on crawl space
- Exterior features: Asphalt/paved public road access; Lot approximately 0.09 acres
Interior
- Kitchen: No kitchen appliances specified
- Bedrooms: 2 bedrooms on the main level
- Bathrooms: 1 full bathroom on the main level
- Heating & cooling: Natural gas heating; No central cooling listed
- Interior features: One-level layout; Crawl space foundation; No built-in appliances listed
- Laundry & utility: No laundry facilities listed
Neighborhood map
What this means for you Summary
Snapshot
- This is a 2-bed/1.0-bath single-family listed at $230k.
Deal economics
- At list price, monthly cash flow is $638 ($8k/yr) — positive.
- The deal already cash-flows at list — no discount required.
- Meets the 1% rule at list price ($3k rent vs $230k).
- Recommended offer: $209k (9.0% below list) — sets the bar for market timing.
- Cap rate 9.6% vs local median 3.1% in Charlotte — top-decile yield for the area; either an underpriced asset or a hidden risk that comps aren't pricing in. Stress-test before assuming the spread holds.
Location & tenants
- Location reads 78/100 on livability (#26 in NC, #2,502 nationally) — a middle-class / working-renter tenant base. Strengths: amenities A+, commute A+, housing A+; Watch: schools D+, crime F.
- Charlotte-Mecklenburg Schools (urban): math 42% / reading 46% proficiency, ranked #85 of 178 in NC (top 48%) — families likely to look elsewhere, expect single-tenant / working-renter base with shorter leases.
- Market conditions: Rents rising (+1.8%/yr); 132 active listings in the ZIP; 40 comparable units currently listed for rent nearby; rentals leasing fast (median 2d on market — plan ~1-2 weeks tenant-placement turnaround); solid renter incomes; 11,969 units permitted in Mecklenburg County in 2024 (5,377 in 5+ unit buildings).
Forward outlook
- Local home prices are declining (-3.0%/yr); year-one equity from $2k of loan paydown is wiped out by about $7k of value loss. Plan a longer hold.
- Mecklenburg County population projected at +53% by 2050 — long-run rental-demand tailwind backs the buy-and-hold thesis.
Negotiation context
- It's been on market 102 days — a 9% lower offer ($209k) is reasonable based on typical stale-listing flexibility.
- Current owner paid $16k; list at $230k implies a 1338% gain — meaningful room to come down on a strong offer.
Risks & watch-outs
- Climate carrying-cost: major wind risk, 27% chance of damaging wind over 30y; extreme-heat days projected 7→17/yr by 2055 (HVAC capex compounding) — expect insurance premiums to compound above CPI over the hold.
Questions for the listing agent
- It's been on market 102 days. Have you received any prior offers? Is the seller open to a 9% concession, seller financing, or rate buy-down credit?
- Built in 1962 — when were the roof, HVAC, electrical panel, plumbing, and water heater last replaced?
- Why hasn't it sold? Are there any deal-killer items the seller is aware of (foundation, flood, title, zoning, code violations)?
- Is there a deadline driving the sale (1031 exchange, divorce, estate, relocation)? That informs how much negotiation room exists.
- Schools are D-rated, which usually means shorter tenancies and higher turnover. Who's the typical renter profile here, and what's been the actual vacancy rate?
- Crime grade is F in this area — have there been break-ins, vandalism, or insurance claims at this property in the last 3 years? What carrier currently insures it and at what premium?
- What's the average days-on-market for RENTAL listings here right now (not sales)? A rising rental-DOM trend means longer vacancies and softer asking-rent achievability than the comps imply.
- What's the recent tenant-quality profile in this submarket — average credit score on applications, eviction rate, late-payment / NSF rate, and stable-employment percentage? A property-management company in the area should have these aggregated.
- How much new for-sale + rental construction is in the pipeline within 1–3 miles? Heavy new supply typically softens prices + rents 12–24 months out; constrained supply supports both.
Investment metrics
- 1% rule
- 1.14% ✓
- Cap rate
- 9.62%
- Cash-on-cash
- 11.89%
- DSCR
- 1.53
- GRM
- 7.3
CMA / ARV
- ARV (on-the-fly)
- $230,958
- Comps found
- 1
Show comp detail 1 sale within ~0.75 mi
| Address | Dist | Beds/Ba | Sqft | Sold | Price | $/sf | Match |
|---|---|---|---|---|---|---|---|
| 616 Chicago Ave | 0.04mi | 2/1.0 | 705 (+0%) | 21mo | $231,600 | $329 | 80 |
Match score weights: distance 35% · size 25% · config 20% · recency 20%. Top-matched comps best support the ARV.
Projected returns pro-forma
-3.0% appreciation · 1.8% rent growth · sell at horizon
- IRR
- 0.1%
- Equity multiple
- 1.00×
- Total profit
- $205
- Equity at exit
- $34,294
- IRR
- 8.5%
- Equity multiple
- 1.62×
- Total profit
- $39,794
- Equity at exit
- $19,886
Cash invested: $64,400 (down + closing). Projections, not guarantees.
Landlord ↔ Tenant lean methodology
- Overall (STATE)
- 85 Strongly Landlord-Friendly
- State North Carolina
- 85 Strongly Landlord-Friendly · R+3
- County
- — inherits STATE
- City
- — inherits STATE
ZIP-level market 28203
- Rents YoY
- 1.8%
- Active inventory
- 132
- Price-to-rent
- 7.3×
Monthly cashflow live
- Estimated rent
- $2,611 high interval (Pro) →
- Mortgage (P&I)
- −$1,206
- Tax from tax record
- −$122 /mo · $1,465/yr
- Insurance
- −$96
- HOA
- −$0
- Vacancy / Maint / Mgmt
- −$548
- Net cashflow
- $638
Break-even live
UW: 25.0% down · 7.5% · 30yr · 1.5% tax · 5.0% vac · 8.0% maint · 8.0% mgmt
Financing live
Cash to close
- Down payment
- $57,500
- Closing costs
- $6,900
- Reserves months
- —
- Total cash needed
- —
Loan-product check · same deal, 3 products live
Conventional
25% down · 7.5% · 30yr
- Down + closing
- —
- Monthly P&I
- —
- Monthly cashflow
- —
- DSCR
- —
- Eligible?
- —
Personal DTI + credit; lowest rate.
DSCR
20% down · 8.5% · 30yr
- Down + closing
- —
- Monthly P&I
- —
- Monthly cashflow
- —
- DSCR
- —
- Eligible?
- —
No personal income docs; deal must DSCR.
Hard money
10% down · 12.0% · 12mo
- Down + closing
- —
- Monthly P&I
- —
- Monthly cashflow
- —
- DSCR
- —
- Eligible?
- —
Short-term bridge; refi at stabilization.
Rent comps 40 comps
| Address | Beds | Baths | Sqft | Rent | $/sqft | DOM | Units | Dist |
|---|---|---|---|---|---|---|---|---|
| 704 W Tremont Ave Charlotte, NC | 3.0 | 1.0–2.0 | 936 | $2,679 | $2.86 | 1d | 9 | 0.44mi |
| 2120 Dunavant St Charlotte, NC | 3.0 | 1.0–2.0 | 1044 | $3,553 | $3.40 | 2d | 33 | 0.47mi |
| 536 W Tremont Ave Charlotte, NC | 2.0 | 1.0–2.0 | 953 | $3,196 | $3.35 | 2d | 18 | 0.50mi |
| 205 Foster Ave Charlotte, NC | 4.0 | 1.0–2.0 | 641 | $2,982 | $4.65 | 2d | 36 | 0.50mi |
| 2200 Dunavant St Charlotte, NC | 1.0–2.0 | 1.0–2.0 | 894 | $3,403 | $3.80 | 1d | 27 | 0.52mi |
| 421 W Tremont Ave Charlotte, NC | 3.0 | 1.0–2.0 | 893 | $3,173 | $3.55 | 1d | 29 | 0.53mi |
| 2250 Hawkins St Charlotte, NC | 3.0 | 1.0–3.0 | 1480 | $3,048 | $2.06 | 2d | 1 | 0.54mi |
| 2630 South Blvd Charlotte, NC | 3.0 | 1.0–2.0 | 1072 | $3,117 | $2.91 | 1d | 25 | 0.56mi |
| 2720 South Blvd Charlotte, NC | 2.0 | 1.0–2.0 | 827 | $2,628 | $3.18 | 1d | 38 | 0.56mi |
| 3310 S Tryon St Charlotte, NC | 1.0–3.0 | 1.0–2.0 | 1045 | $2,170 | $2.08 | 1d | 16 | 0.57mi |
| 2520 South Blvd Charlotte, NC | 2.0 | 1.0–2.0 | 822 | $2,757 | $3.35 | 3d | 24 | 0.57mi |
| 1504 Mainline Blvd Charlotte, NC | 1.0 | 1.0–2.0 | 862 | $2,120 | $2.46 | 2d | 16 | 0.58mi |
| 2408 South Blvd Charlotte, NC | 2.0 | 1.0–2.0 | 836 | $3,265 | $3.90 | 1d | 14 | 0.59mi |
| 452 New Bern Station Ct #452 Charlotte, NC | 1.0 | 1.0 | 693 | $1,550 | $2.24 | 23d | 1 | 0.62mi |
| 2225 Hawkins St Charlotte, NC | 2.0 | 1.0–2.0 | 988 | $2,883 | $2.92 | 1d | 14 | 0.64mi |
| 3405 S Tryon St Charlotte, NC | 1.0–3.0 | 1.0–2.0 | 1056 | $2,208 | $2.09 | 2d | 66 | 0.66mi |
| 2300 South Blvd Charlotte, NC | 2.0 | 1.0–2.0 | 943 | $2,969 | $3.15 | 1d | 15 | 0.68mi |
| 2705 Haverford Pl Charlotte, NC | 2.0 | 1.0–2.0 | 967 | $3,134 | $3.24 | 1d | 14 | 0.70mi |
| 335 Doggett St Charlotte, NC | 3.0 | 1.0–2.0 | 864 | $2,208 | $2.56 | 2d | 1 | 0.70mi |
| 2161 Hawkins St Charlotte, NC | 3.0 | 1.0–3.0 | 1284 | $6,751 | $5.26 | 1d | 21 | 0.72mi |
| 3305 South Blvd Charlotte, NC | 2.0 | 1.0–2.5 | 945 | $3,665 | $3.88 | 3d | 19 | 0.78mi |
| 2100 South Blvd Charlotte, NC | 2.0 | 1.0–2.0 | 876 | $3,583 | $4.09 | 2d | 24 | 0.82mi |
| 3615 Tryclan Dr Charlotte, NC | 2.0 | 1.0–2.0 | 993 | $3,528 | $3.55 | 1d | 31 | 0.85mi |
| 2125 Southend Dr Charlotte, NC | 1.0 | 1.0 | 672 | $1,762 | $2.62 | 14d | 5 | 0.86mi |
| 1701 West Blvd Unit E7 Charlotte, NC | 1.0 | 1.0 | 584 | $1,010 | $1.73 | 23d | 1 | 0.87mi |
| 3441 South Blvd Charlotte, NC | 2.0 | 1.0–2.0 | 868 | $2,470 | $2.84 | 1d | 9 | 0.88mi |
| 1822 Merriman Ave Unit C Charlotte, NC | 2.0 | 1.0 | 700 | $1,350 | $1.93 | 23d | 1 | 0.89mi |
| 2005 Empire St Charlotte, NC | 2.0 | 1.0–2.0 | 875 | $2,439 | $2.79 | 4d | 104 | 0.89mi |
| 2025 Cleveland Ave Charlotte, NC | 1.0–3.0 | 1.0–3.0 | 1242 | $4,922 | $3.96 | 1d | 27 | 0.90mi |
| 2210 Sumner Green Ave Unit H Charlotte, NC | 1.0 | 1.0 | 557 | $1,650 | $2.96 | 16d | 1 | 0.93mi |
| 1701 Remount Rd Charlotte, NC | 1.0 | 1.0 | 525 | $950 | $1.81 | 23d | 1 | 0.95mi |
| 222 West Blvd Charlotte, NC | 2.0 | 1.0–2.0 | 628 | $2,515 | $4.00 | 1d | 11 | 0.95mi |
| 120 Hollis Rd Charlotte, NC | 3.0 | 1.0–3.0 | 1155 | $2,946 | $2.55 | 2d | 28 | 0.98mi |
| 4015 Craft St Charlotte, NC | 1.0 | 1.0 | 662 | $2,128 | $3.21 | 20d | 1 | 1.00mi |
| 1613 S Mint St Unit C Charlotte, NC | 1.0 | 1.0 | 550 | $2,750 | $5.00 | 23d | 1 | 1.00mi |
| 1750 Camden Rd Charlotte, NC | 2.0 | 1.0–2.0 | 782 | $2,629 | $3.36 | 1d | 20 | 1.04mi |
| 124 E Kingston Ave Charlotte, NC | 2.0 | 1.0–2.0 | 931 | $5,136 | $5.51 | 2d | 25 | 1.10mi |
| 125 W Park Ave Charlotte, NC | 1.0 | 1.0–1.5 | 817 | $2,480 | $3.03 | 3d | 4 | 1.11mi |
| 3235 Ross Ave Charlotte, NC | 2.0 | 1.0 | 675 | $1,050 | $1.56 | 23d | 1 | 1.22mi |
| 2314 Berryhill Rd Charlotte, NC | 2.0 | 1.0–2.5 | 989 | $2,474 | $2.50 | 1d | 20 | 1.23mi |
Listing history 16 events
-
2026-06-18days on market $230,000 Active 102 DOM
-
2026-06-17days on market $230,000 Active 101 DOM
-
2026-06-16days on market $230,000 Active 100 DOM
-
2026-06-15days on market $230,000 Active 99 DOM
-
2026-06-13days on market $230,000 Active 97 DOM
-
2026-06-10days on market $230,000 Active 93 DOM
-
2026-06-08days on market $230,000 Active 92 DOM
-
2026-06-07days on market $230,000 Active 91 DOM
-
2026-06-04days on market $230,000 Active 88 DOM
-
2026-06-03days on market $230,000 Active 87 DOM
-
2026-06-02days on market $230,000 Active 86 DOM
-
2026-06-02days on market $230,000 Active 85 DOM
-
2026-05-31days on market $230,000 Active 84 DOM
-
2026-05-08price $230,000
-
2026-03-08$260,000 Active
-
1979-02-01soldstatus $16,000
ⓘ Source: listings_history table (triggers on properties + properties_extension) + one-shot
backfill from property_details.listing_events for pre-trigger history.
Tax reassessment forecast NC · Resets to sale price
- Current annual tax
- $1,465 · $122/mo
- Projected year-2 tax
- $1,886 · $157/mo
- Expected delta
- +$421/yr (+$35/mo · 28.7%)
ⓘ Screening estimate from a state-policy table — verify with the county assessor before closing.
Climate risk First Street
- Flood 1/10 Low FEMA zone X (unshaded) · 0% chance over 30 yrs
- Wildfire 1/10 Low
- Heat 6/10 Major 7 d/yr ≥104°F today · 17 d/yr by 30 yrs out
- Wind 6/10 Major 27% chance of damaging wind over 30 yrs
- Air quality 3/10 Moderate 3 unhealthy d/yr today · 4 by 30 yrs out
Nearby sold comps map
Loading sold comps map…
Walkable amenities ~0.75 mi
Loading nearby amenities…
Taxation est. · year 1
- Rental income
- $31,327
- − Mortgage interest
- −$12,884
- − Property taxes
- −$1,465
- − Insurance
- −$1,150
- − Repairs & maintenance
- −$2,506
- − Management
- −$2,506
- − Depreciation
- −$6,691
- Taxable income
- $4,125
- Est. tax owed @ 24.0%
- −$990
- After-tax cash flow
- $6,669/yr
For passive investors: Depreciation is non-cash, so a rental often shows a tax loss while cash-flowing — sheltering income. Rental losses are passive: they offset passive income freely, and up to $25,000/yr can offset ordinary (W-2) income if you actively participate and your MAGI is under $100k (phasing out to $0 by $150k); unused losses carry forward. On sale, claimed depreciation is recaptured at up to 25%, and gains may owe capital-gains tax (a 1031 exchange can defer both). Figures are a year-1 estimate at your 24.0% rate — not tax advice; consult a CPA.
Schools (NCES district)
- District
- Charlotte-Mecklenburg Schools
- NCES district ID
- 3702970
- Math proficiency
- 42% ▼ -6.00%
- Reading proficiency
- 46% ▲ 1.00%
- Median HH income
- $57,175
- Composite
- 38.49/100
- National rank
- #4183
- State rank
- #85 of 178 in NC
Livability — Charlotte
- Score
- 78/100
- State rank
- #26
- US rank
- #2502
Category grades
Schools grade is shown separately in the Schools card above.
Census & demographics
- Census place
- Charlotte, NC
- County
- Mecklenburg County · 1,167,319 people
- City population
- 920,422
- Metro
- Charlotte-Concord-Gastonia, NC-SC
- Population (ZIP)
- 18,823
- Household income
- $104,696
- Rent vs Own
- Severe rent burden
- 1101.0
Population outlook (Mecklenburg County) Hauer SSP2
- Today (2025)
- 1,305,740 people
- By 2030
- 1,442,752 · +10.5%
- By 2040
- 1,722,441 · +31.9%
- By 2050
- 1,999,450 · +53.1%
- By 2075
- 2,642,495 · +102.4%
- By 2100
- 3,106,755 · +137.9%
Race, ethnicity, and origin ACS 2023
- Neighborhood character
- Predominantly White (78%)
- Race & ethnicity
- White 78% Black 10% Two or more races 5% Hispanic / Latino 5% Asian 4%
- Common ancestry
- Romanian 3% Slovak 3% Serbian 2%
- Foreign-born
- 7% · Canada, Vietnam, China
- Languages at home
- 93% English-only · Spanish 3% Other Indo-European 1% German/W. Germanic 1%
Political lean MEDSL · Mecklenburg
- 2024 margin
- Solid D (+32.9) · D 65.6% · R 32.7% · Other 1.6%
- 2008→2024 swing
- +8.5pp toward D · 2008: 24.4pp · 2024: 32.9pp
- All cycles
- 2024: D+32.9 2020: D+35.1 2016: D+29.9 2012: D+22.5 2008: D+24.4
Not yet ingested
- Civics
- —
Market trends
- HPI YoY
- ▼ -1410.28%
- Current HPI
- 327.5818
- Rent YoY
- ▲ 1.80%
- Metro
- Charlotte-Concord-Gastonia, NC-SC
- State GDP YoY
- ▲ 3.28%
- F500 in state
- 26
Industry mix (Fortune 500 HQ in NC)
| Industry | F500 HQs | Revenue |
|---|---|---|
| Financial Services | 2 | $213B |
|
||
| Retail | 2 | $95B |
|
||
| Industrial Conglomerate | 1 | $38B |
|
||
| Metals / Steel | 1 | $35B |
|
||
| Utilities | 1 | $30B |
|
||
| Industrial Machinery | 1 | $19B |
|
||
Price history
+1337.5% since first listed3 events — show timeline
- 2026-05-08 Price Changed $230,000 CANOPYMLS as Distributed by MLS Grid
- 2026-03-08 Listed $260,000 CANOPYMLS as Distributed by MLS Grid
- 1979-02-01 Sold (Public Records) $16,000 Public Records
Property tax history
+6.2%/yrLatest (2025): $1,465 · +2.6% YoY. Source: county tax records.
Cash-flow waterfall
monthlySold comps — $/sqft
last 12 mo · ≤1 miLoading sold comps…