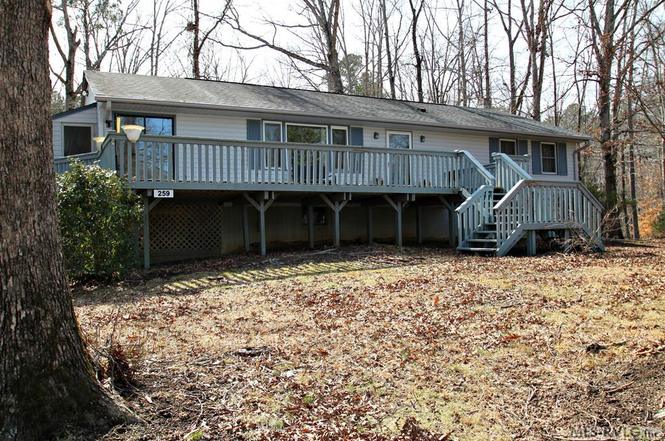
259 Tuscarora Trl · Gasburg, VA
Flood risk 1/10 · Minimal
- FEMA flood zone
- X (unshaded)
- Chance of flooding over 30 yrs
- 0.0%
- Est. flood insurance / yr
- $473 – $860
Fire risk 3/10 · Minor
- Est. fire insurance / yr
- $906 – $1,684
Heat risk 6/10 · Moderate
- Hot days now (above 107°F)
- 7 days/yr
- Hot days in 30 yrs
- 16 days/yr
Wind risk 6/10 · Moderate
- Chance of severe wind over 30 yrs
- 48.0%
Air-quality risk 1/10 · Minimal
- Unhealthy air days now
- 0 days/yr
- Unhealthy air days in 30 yrs
- 0 days/yr
Risk factors via First Street. Map © Google.
Why this score? — see what drove the C- grade
The composite is a weighted blend of 9 inputs, each scored 0–100. Each bar is that input's sub-score; the figure is the points it added to the 100-point composite (weight × sub-score).
- Cash flow +18.6/30.0
- ARV discount +7.5/15.0
- Appreciation +6.3/10.0
- DSCR +5.8/10.0
- 1% rule +4.2/10.0
- Livability +3.2/5.0
- Rent growth +2.5/5.0
- Condition / age +2.5/5.0
- Schools +1.3/10.0
$249,000
🖨 Deal sheet 📄 Offer letter ✓ Due diligence
Listing remarks
Affordable off-shore home in the desirable NE Quad of Lake Gaston within minutes to the FoodLion Shopping Center, Ace Hardware, Family Dollar, local restaurants, etc. The main level has beautiful hardwood floors. The basement is unfinished and has heating/cooling along with a small woodstove which will convey. The property consists of two lots. This home is being offered at this low price in as-is condition, was inherited, never lived in by the seller. The furnishings in the home at time of offer will convey at no cost.
Key facts
- Three lots
- Unfinished basement
- Hardwood floors
Tags
Property features AI
Finance
- Other: Property in Indian Rock subdivision; Zoned residential; Lot roughly 0.95 acre
- HOA & community: Approx. $25 monthly association fee
Exterior
- Parking: Attached carport; Gravel parking; Has carport
- Utilities: Private well water; Septic tank
- Home design: Manufactured (modular/off-frame) residential home; One level
- Construction: Vinyl siding; Composition roof; Slab foundation; Built as a manufactured/modular home
- Exterior features: Front porch; Rear porch; Deck; Paved road access; Lake Gaston nearby view
Interior
- Kitchen: Electric oven; Electric range; Refrigerator
- Flooring: Carpet; Wood; Vinyl
- Bathrooms: 3 full bathrooms
- Heating & cooling: Oil heating; Central air conditioning
- Interior features: Storm windows; Full unfinished basement; Storage outbuilding
Neighborhood map
What this means for you Summary
Snapshot
- This is a 3-bed/3.0-bath single-family listed at $249k.
Deal economics
- At list price, monthly cash flow is $241 ($3k/yr) — positive.
- The deal already cash-flows at list — no discount required.
- To meet the 1% rule (rent ≥ 1% of price), the offer needs to be $228k (8.5% below list).
- Recommended offer: $228k (8.5% below list) — sets the bar for 1% rule.
- Cap rate 7.5% vs local median 1.1% in Gasburg — top-decile yield for the area; either an underpriced asset or a hidden risk that comps aren't pricing in. Stress-test before assuming the spread holds.
Location & tenants
- Location reads 64/100 on livability (#345 in VA) — a middle-class / working-renter tenant base. Strengths: cost of living A+, health & safety A, crime A-; Watch: housing C-, amenities F, commute F.
- Northampton County Schools (rural): math 15% / reading 18% proficiency, ranked #176 of 178 in NC (top 99%) — low school quality limits family demand, transient renter base, plan for 1-2y turnover; 78% free/reduced lunch — lower-income household profile, screen leases tightly.
- Zoned schools: Northampton County High School (math 2% / reading 17%, grade F, #530 of 535 statewide, top 99%, 240 students, 99% FRL) — zoned schools average 99% FRL vs 78% district-wide (21 pts higher); higher-poverty schools than district average — tighter screening recommended.
- Market conditions: 17 units permitted in Northampton County in 2024 (0 in 5+ unit buildings).
Forward outlook
- In year one you build about $8k of equity ($2k loan paydown + $6k appreciation (2.5% local appreciation)).
- Northampton County population projected at -40% by 2050 — secular population decline; favor cash flow + early exit over multi-decade hold.
- At projected returns (2.5% appreciation + 3.0% rent growth), your $70k cash investment doubles in ~6 years — after that, you're playing with house money.
- By year 5, paydown + projected appreciation supports a ~$35k cash-out refi (75% LTV) — recoverable capital for the next deal without selling this one.
Negotiation context
- It's been on market 75 days — a 6% lower offer ($234k) is reasonable based on typical stale-listing flexibility.
- 4 sale attempts; this cycle's ask is 4% above the opening price — seller raised mid-cycle; expect resistance to lowballs.
Risks & watch-outs
- Climate carrying-cost: major wind risk, 48% chance of damaging wind over 30y; extreme-heat days projected 7→16/yr by 2055 (HVAC capex compounding) — expect insurance premiums to compound above CPI over the hold.
Questions for the listing agent
- It's been on market 75 days. Have you received any prior offers? Is the seller open to a 8% concession, seller financing, or rate buy-down credit?
- Built in 1972 — when were the roof, HVAC, electrical panel, plumbing, and water heater last replaced?
- What does the HOA fee cover, when was the last increase, and are there any pending special assessments or reserve-fund shortfalls?
- Why hasn't it sold? Are there any deal-killer items the seller is aware of (foundation, flood, title, zoning, code violations)?
- Is there a deadline driving the sale (1031 exchange, divorce, estate, relocation)? That informs how much negotiation room exists.
- Schools are F-rated, which usually means shorter tenancies and higher turnover. Who's the typical renter profile here, and what's been the actual vacancy rate?
- What's the average days-on-market for RENTAL listings here right now (not sales)? A rising rental-DOM trend means longer vacancies and softer asking-rent achievability than the comps imply.
- What's the recent tenant-quality profile in this submarket — average credit score on applications, eviction rate, late-payment / NSF rate, and stable-employment percentage? A property-management company in the area should have these aggregated.
- How much new for-sale + rental construction is in the pipeline within 1–3 miles? Heavy new supply typically softens prices + rents 12–24 months out; constrained supply supports both.
Investment metrics
- 1% rule
- 0.92% ✗
- Cap rate
- 7.45%
- Cash-on-cash
- 4.15%
- DSCR
- 1.18
- GRM
- 9.1
CMA / ARV
- ARV (on-the-fly)
- $708,400
- Comps found
- 2
Show comp detail 2 sales within ~0.75 mi
| Address | Dist | Beds/Ba | Sqft | Sold | Price | $/sf | Match |
|---|---|---|---|---|---|---|---|
| 188 Cherokee Trl | 0.11mi | 3/3.0 | 1,275 (-1%) | 7mo | $360,000 | $282 | 88 |
| 142 Lakeview Rd | 0.61mi | 3/2.0 | 1,408 (+9%) | 9mo | $775,000 | $550 | 45 |
Match score weights: distance 35% · size 25% · config 20% · recency 20%. Top-matched comps best support the ARV.
Projected returns pro-forma
2.55% appreciation · 3.0% rent growth · sell at horizon
- IRR
- 10.1%
- Equity multiple
- 1.57×
- Total profit
- $39,399
- Equity at exit
- $105,710
- IRR
- 12.7%
- Equity multiple
- 2.81×
- Total profit
- $126,144
- Equity at exit
- $158,210
Cash invested: $69,720 (down + closing). Projections, not guarantees.
Landlord ↔ Tenant lean methodology
- Overall (STATE)
- 55 Moderately Landlord-Leaning
- State Virginia
- 55 Moderately Landlord-Leaning · D+2
- County
- — inherits STATE
- City
- — inherits STATE
ZIP-level market 27842
- Home prices YoY
- 1.3%
- Price-to-rent
- 9.1×
Monthly cashflow live
- Estimated rent
- $2,278 medium interval (Pro) →
- Mortgage (P&I)
- −$1,306
- Tax from tax record
- −$125 /mo · $1,495/yr
- Insurance
- −$104
- HOA
- −$25
- Vacancy / Maint / Mgmt
- −$478
- Net cashflow
- $241
Break-even live
UW: 25.0% down · 7.5% · 30yr · 1.5% tax · 5.0% vac · 8.0% maint · 8.0% mgmt
Financing live
Cash to close
- Down payment
- $62,250
- Closing costs
- $7,470
- Reserves months
- —
- Total cash needed
- —
Loan-product check · same deal, 3 products live
Conventional
25% down · 7.5% · 30yr
- Down + closing
- —
- Monthly P&I
- —
- Monthly cashflow
- —
- DSCR
- —
- Eligible?
- —
Personal DTI + credit; lowest rate.
DSCR
20% down · 8.5% · 30yr
- Down + closing
- —
- Monthly P&I
- —
- Monthly cashflow
- —
- DSCR
- —
- Eligible?
- —
No personal income docs; deal must DSCR.
Hard money
10% down · 12.0% · 12mo
- Down + closing
- —
- Monthly P&I
- —
- Monthly cashflow
- —
- DSCR
- —
- Eligible?
- —
Short-term bridge; refi at stabilization.
HOA detail
- Monthly dues
- $25 · $300/yr
- Likely covers
- gas
Listing history 26 events
-
2026-06-19days on market $249,000 Active 75 DOM
-
2026-06-18days on market $249,000 Active 74 DOM
-
2026-06-17days on market $249,000 Active 73 DOM
-
2026-06-16days on market $249,000 Active 72 DOM
-
2026-06-15days on market $249,000 Active 71 DOM
-
2026-06-14days on market $249,000 Active 69 DOM
-
2026-06-12days on market $249,000 Active 68 DOM
-
2026-06-09remarks 525-char remark
-
2026-06-09days on market $249,000 Active 65 DOM
-
2026-06-08days on market $249,000 Active 64 DOM
-
2026-06-07days on market $249,000 Active 63 DOM
-
2026-06-07days on market $249,000 Active 62 DOM
-
2026-06-03days on market $249,000 Active 59 DOM
-
2026-06-02days on market $249,000 Active 58 DOM
-
2026-06-01days on market $249,000 Active 57 DOM
-
2026-05-31days on market $249,000 Active 56 DOM
-
2026-05-30days on market $249,000 Active 55 DOM
-
2026-05-03price $249,000
-
2026-05-03status Active
-
2026-04-29status Active
-
2026-03-25status Pending
-
2026-02-25$239,900 Active
-
2026-01-23price $335,000
-
2026-01-08price $359,000
-
2025-11-22price $363,000
-
2025-10-12$368,000 Active
ⓘ Source: listings_history table (triggers on properties + properties_extension) + one-shot
backfill from property_details.listing_events for pre-trigger history.
Tax reassessment forecast VA · Resets to sale price
- Current annual tax
- $1,495 · $125/mo
- Projected year-2 tax
- $2,042 · $170/mo
- Expected delta
- +$547/yr (+$46/mo · 36.6%)
ⓘ Screening estimate from a state-policy table — verify with the county assessor before closing.
Climate risk First Street
- Flood 1/10 Low FEMA zone X (unshaded) · 0% chance over 30 yrs
- Wildfire 3/10 Moderate
- Heat 6/10 Major 7 d/yr ≥107°F today · 16 d/yr by 30 yrs out
- Wind 6/10 Major 48% chance of damaging wind over 30 yrs
- Air quality 1/10 Low 0 unhealthy d/yr today · 0 by 30 yrs out
Nearby sold comps map
Loading sold comps map…
Walkable amenities ~0.75 mi
Loading nearby amenities…
Taxation est. · year 1
- Rental income
- $27,342
- − Mortgage interest
- −$13,948
- − Property taxes
- −$1,495
- − Insurance
- −$1,245
- − Repairs & maintenance
- −$2,187
- − Management
- −$2,187
- − HOA
- −$300
- − Depreciation
- −$7,244
- Taxable loss
- −$1,264
- Est. tax savings @ 24.0%
- +$303
- After-tax cash flow
- $3,194/yr
For passive investors: Depreciation is non-cash, so a rental often shows a tax loss while cash-flowing — sheltering income. Rental losses are passive: they offset passive income freely, and up to $25,000/yr can offset ordinary (W-2) income if you actively participate and your MAGI is under $100k (phasing out to $0 by $150k); unused losses carry forward. On sale, claimed depreciation is recaptured at up to 25%, and gains may owe capital-gains tax (a 1031 exchange can defer both). Figures are a year-1 estimate at your 24.0% rate — not tax advice; consult a CPA.
Schools (NCES district)
- District
- Northampton County Schools
- NCES district ID
- 3703420
- Math proficiency
- 15% ▬ 0.00%
- Reading proficiency
- 18% ▼ -2.00%
- Median HH income
- $31,548
- Composite
- 13.24/100
- National rank
- #9551
- State rank
- #176 of 178 in NC
Livability — Gasburg
- Score
- 64/100
- State rank
- #345
- US rank
- #13729
Category grades
Schools grade is shown separately in the Schools card above.
Census & demographics
- Population (ZIP)
- 1,439
Population outlook (Northampton County) Hauer SSP2
- Today (2025)
- 17,395 people
- By 2030
- 15,794 · -9.2%
- By 2040
- 12,810 · -26.4%
- By 2050
- 10,488 · -39.7%
- By 2075
- 7,778 · -55.3%
- By 2100
- 7,019 · -59.6%
Race, ethnicity, and origin ACS 2023
- Neighborhood character
- Predominantly White (74%)
- Race & ethnicity
- White 74% Black 24% Two or more races 3%
- Common ancestry
- Lithuanian 3% Serbian 3% Romanian 3%
- Foreign-born
- 0%
Political lean MEDSL · Northampton
- 2024 margin
- D (+14.5) · D 57.0% · R 42.5%
- 2008→2024 swing
- -15.9pp toward R · 2008: 30.4pp · 2024: 14.5pp
- All cycles
- 2024: D+14.5 2020: D+20.6 2016: D+26.2 2012: D+34.9 2008: D+30.4
Not yet ingested
- Civics
- —
Market trends
- HPI YoY
- ▲ 2.55%
- Current HPI
- 192.5299
- Rent YoY
- —
- Metro
- —
- State GDP YoY
- ▲ 2.40%
- F500 in state
- 50
Industry mix (Fortune 500 HQ in VA)
| Industry | F500 HQs | Revenue |
|---|---|---|
| Aerospace / Defense | 4 | $236B |
|
||
| Technology / Defense | 3 | $32B |
|
||
| Financial Services | 2 | $176B |
|
||
| Utilities | 2 | $27B |
|
||
| Insurance | 2 | $25B |
|
||
| Technology | 2 | $15B |
|
||
Price history
-32.3% since first listed9 events — show timeline
- 2026-05-03 Price Changed $249,000 RVLG
- 2026-05-03 Relisted — RVLG
- 2026-04-29 Relisted — RVLG
- 2026-03-25 Pending — RVLG
- 2026-02-25 Listed $239,900 RVLG
- 2026-01-23 Price Changed $335,000 RVLG
- 2026-01-08 Price Changed $359,000 RVLG
- 2025-11-22 Price Changed $363,000 RVLG
- 2025-10-12 Listed $368,000 RVLG
Property tax history
+5.6%/yrLatest (2025): $1,495 · +71.6% YoY. Source: county tax records.
Cash-flow waterfall
monthlySold comps — $/sqft
last 12 mo · ≤1 miLoading sold comps…