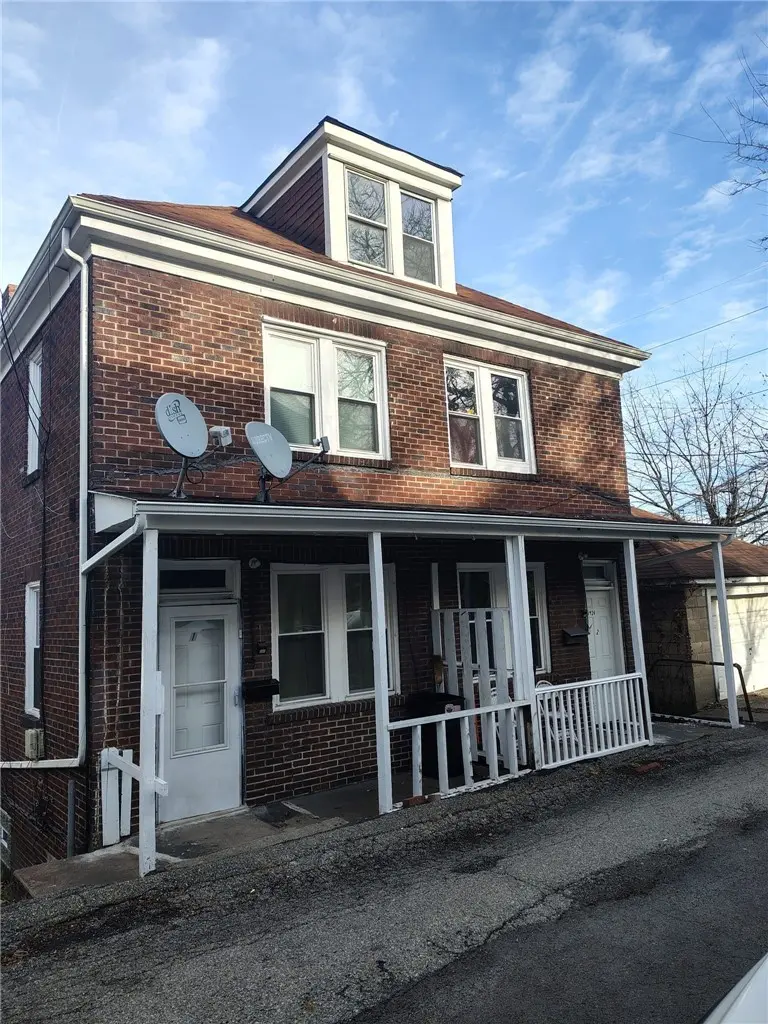
4424 Kennywood · West Mifflin, PA
Flood risk 1/10 · Minimal
- FEMA flood zone
- X (unshaded)
- Chance of flooding over 30 yrs
- 0.0%
- Est. flood insurance / yr
- $473 – $860
Fire risk 1/10 · Minimal
- Est. fire insurance / yr
- $511 – $949
Heat risk 4/10 · Minor
- Hot days now (above 97°F)
- 7 days/yr
- Hot days in 30 yrs
- 18 days/yr
Wind risk 2/10 · Minimal
- Chance of severe wind over 30 yrs
- —
Air-quality risk 4/10 · Minor
- Unhealthy air days now
- 4 days/yr
- Unhealthy air days in 30 yrs
- 5 days/yr
Risk factors via First Street. Map © Google.
Why this score? — see what drove the D+ grade
The composite is a weighted blend of 9 inputs, each scored 0–100. Each bar is that input's sub-score; the figure is the points it added to the 100-point composite (weight × sub-score).
- Cash flow +17.4/30.0
- ARV discount +7.5/15.0
- DSCR +5.4/10.0
- 1% rule +4.3/10.0
- Livability +3.7/5.0
- Schools +2.6/10.0
- Rent growth +2.5/5.0
- Condition / age +2.5/5.0
- Appreciation +0.0/10.0
$245,700
🖨 Deal sheet (PDF) 📄 Offer letter ✓ Due diligence
Listing remarks MLS
Beautifully updated duplex in West Mifflin near the iconic Kennywood Amusement Park! Both units offer separate utilities, modern kitchens with brand-new appliances, and updated baths. Separate utilities. Enjoy peace of mind with new flooring, mostly new windows, a new water heater, and a new gutter system. Fully leased—perfect turnkey investment!
Key facts
- Mostly new windows
- Brand new appliances
- Updated baths
Tags
Neighborhood map
What this means for you Summary
Snapshot
- This is a 5-bed/2.0-bath other listed at $246k.
Deal economics
- At list price, monthly cash flow is $186 ($2k/yr) — positive.
- The deal already cash-flows at list — no discount required.
- To meet the 1% rule (rent ≥ 1% of price), the offer needs to be $227k (7.4% below list).
- Recommended offer: $224k (9.0% below list) — sets the bar for market timing.
- Cap rate 7.2% vs local median 5.2% in West Mifflin — top-decile yield for the area; either an underpriced asset or a hidden risk that comps aren't pricing in. Stress-test before assuming the spread holds.
Location & tenants
- Location reads 73/100 on livability (#539 in PA) — a middle-class / working-renter tenant base. Strengths: cost of living A+, housing A+, commute B; Watch: health & safety D, crime D-, amenities F.
- West Mifflin Area SD (suburban): math 19% / reading 41% proficiency, ranked #443 of 539 in PA (top 82%) — families likely to look elsewhere, expect single-tenant / working-renter base with shorter leases.
- Zoned schools: West Mifflin Area Ms (math 11% / reading 42%, grade F, #410 of 512 statewide, top 80%, 803 students, 100% FRL); West Mifflin Area Hs (math 52% / reading 24%, grade F, #281 of 437 statewide, top 65%, 936 students, 87% FRL) — zoned schools average 94% FRL vs 44% district-wide (50 pts higher); higher-poverty schools than district average — tighter screening recommended.
- Market conditions: 60 active listings in the ZIP; 1 comparable units currently listed for rent nearby; 2,996 units permitted in Allegheny County in 2024 (1,588 in 5+ unit buildings).
- This rent runs 38% of the median local income ($72k/yr) — at the standard rent-burdened threshold; future hikes will face affordability resistance.
Forward outlook
- Local home prices are declining (-3.0%/yr); year-one equity from $2k of loan paydown is wiped out by about $7k of value loss. Plan a longer hold.
Negotiation context
- It's been on market 117 days — a 9% lower offer ($224k) is reasonable based on typical stale-listing flexibility.
- 4 sale attempts since 9y ago; this cycle's ask has dropped $20k (8%) from the opening price — seller is motivated, your offer sets the floor, not the list.
- Current owner paid $45k; list at $246k implies a 446% gain — meaningful room to come down on a strong offer.
Risks & watch-outs
- Watch-outs: built in 1920 — expect roof / HVAC / electrical / plumbing capex.
Questions for the listing agent
- It's been on market 117 days. Have you received any prior offers? Is the seller open to a 9% concession, seller financing, or rate buy-down credit?
- Built in 1920 — when were the roof, HVAC, electrical panel, plumbing, and water heater last replaced?
- Why hasn't it sold? Are there any deal-killer items the seller is aware of (foundation, flood, title, zoning, code violations)?
- Is there a deadline driving the sale (1031 exchange, divorce, estate, relocation)? That informs how much negotiation room exists.
- Schools are B-rated — typically a magnet for longer-tenancy family renters. What's the average tenant stay here, and is there a school-zone premium baked into asking?
- Crime grade is D in this area — have there been break-ins, vandalism, or insurance claims at this property in the last 3 years? What carrier currently insures it and at what premium?
- The area grade is low — what's the realistic commute time and amenity access for the typical tenant pool here? Any planned neighborhood developments (good or bad) we should know about?
- What's the average days-on-market for RENTAL listings here right now (not sales)? A rising rental-DOM trend means longer vacancies and softer asking-rent achievability than the comps imply.
- What's the recent tenant-quality profile in this submarket — average credit score on applications, eviction rate, late-payment / NSF rate, and stable-employment percentage? A property-management company in the area should have these aggregated.
- How much new for-sale + rental construction is in the pipeline within 1–3 miles? Heavy new supply typically softens prices + rents 12–24 months out; constrained supply supports both.
Investment metrics
- 1% rule
- 0.93% ✗
- Cap rate
- 7.20%
- Cash-on-cash
- 3.24%
- DSCR
- 1.14
- GRM
- 9.0
CMA / ARV
- ARV (median comp)
- $535,299
- List price
- $245,700
- Delta
- -52.23%
- Verdict
- UNDERPRICED
- Comps
- 1 within 2.0 mi
Projected returns pro-forma
-3.0% appreciation · 3.0% rent growth · sell at horizon
- IRR
- -11.2%
- Equity multiple
- 0.59×
- Total profit
- $-28,012
- Equity at exit
- $36,635
- IRR
- -2.0%
- Equity multiple
- 0.87×
- Total profit
- $-9,247
- Equity at exit
- $21,244
Cash invested: $68,796 (down + closing). Projections, not guarantees.
Landlord ↔ Tenant lean methodology
- Overall (STATE)
- 62 Landlord-Friendly
- State Pennsylvania
- 62 Landlord-Friendly · EVEN
- County
- — inherits STATE
- City
- — inherits STATE
ZIP-level market 15122
- Home prices YoY
- -30.4%
- Active inventory
- 60
- Price-to-rent
- 9.0×
Monthly cashflow live
- Estimated rent
- $2,275 medium interval (Pro) →
- Mortgage (P&I)
- −$1,288
- Tax from tax record
- −$221 /mo · $2,646/yr
- Insurance
- −$102
- HOA
- −$0
- Vacancy / Maint / Mgmt
- −$478
- Net cashflow
- $186
Break-even live
Sensitivity live
| Price | -10% $325 | -5% $255 | +0% $186 | +5% $116 | +10% $47 |
|---|---|---|---|---|---|
| Rent | -10% $6 | -5% $96 | +0% $186 | +5% $275 | +10% $365 |
| Rate | -1.0pp $309 | -0.5pp $248 | base $186 | +0.5pp $122 | +1.0pp $57 |
UW: 25.0% down · 7.5% · 30yr · 1.5% tax · 5.0% vac · 8.0% maint · 8.0% mgmt
Financing live
Cash to close
- Down payment
- $61,425
- Closing costs
- $7,371
- Reserves months
- —
- Total cash needed
- —
Loan-product check · same deal, 3 products live
Conventional
25% down · 7.5% · 30yr
- Down + closing
- —
- Monthly P&I
- —
- Monthly cashflow
- —
- DSCR
- —
- Eligible?
- —
Personal DTI + credit; lowest rate.
DSCR
20% down · 8.5% · 30yr
- Down + closing
- —
- Monthly P&I
- —
- Monthly cashflow
- —
- DSCR
- —
- Eligible?
- —
No personal income docs; deal must DSCR.
Hard money
10% down · 12.0% · 12mo
- Down + closing
- —
- Monthly P&I
- —
- Monthly cashflow
- —
- DSCR
- —
- Eligible?
- —
Short-term bridge; refi at stabilization.
Rent comps 1 comps
| Address | Beds | Baths | Sqft | Rent | $/sqft | DOM | Units | Dist |
|---|---|---|---|---|---|---|---|---|
| 504 Center St Unit 1546027P East Pittsburgh, PA | 5.0 | 2.0 | 1991 | $3,742 | $1.88 | 16d | 1 | 1.49mi |
Listing history 24 events
-
2026-06-22price $245,700 Active 117 DOM
-
2026-06-21days on market $255,700 Active 117 DOM
-
2026-06-18days on market $255,700 Active 114 DOM
-
2026-06-17days on market $255,700 Active 113 DOM
-
2026-06-16days on market $255,700 Active 112 DOM
-
2026-06-15days on market $255,700 Active 111 DOM
-
2026-06-13days on market $255,700 Active 109 DOM
-
2026-06-09days on market $255,700 Active 105 DOM
-
2026-06-08days on market $255,700 Active 104 DOM
-
2026-06-07days on market $255,700 Active 103 DOM
-
2026-06-03days on market $255,700 Active 99 DOM
-
2026-06-02days on market $255,700 Active 98 DOM
-
2026-06-01days on market $255,700 Active 97 DOM
-
2026-05-31days on market $255,700 Active 96 DOM
-
2026-05-04price $255,700 354-char remark
Show marketing remark (354 chars)
Beautifully updated duplex in West Mifflin near the iconic Kennywood Amusement Park! Both units offer separate utilities, modern kitchens with brand-new appliances, and updated baths. Separate utilities. Enjoy peace of mind with new flooring, mostly new windows, a new water heater, and a new gutter system. Fully leased—perfect turnkey investment!
-
2026-03-25status Active 354-char remark
Show marketing remark (354 chars)
Beautifully updated duplex in West Mifflin near the iconic Kennywood Amusement Park! Both units offer separate utilities, modern kitchens with brand-new appliances, and updated baths. Separate utilities. Enjoy peace of mind with new flooring, mostly new windows, a new water heater, and a new gutter system. Fully leased—perfect turnkey investment!
-
2025-11-23$265,700 Active 354-char remark
Show marketing remark (354 chars)
Beautifully updated duplex in West Mifflin near the iconic Kennywood Amusement Park! Both units offer separate utilities, modern kitchens with brand-new appliances, and updated baths. Separate utilities. Enjoy peace of mind with new flooring, mostly new windows, a new water heater, and a new gutter system. Fully leased—perfect turnkey investment!
-
2023-08-28soldstatus $45,000
-
2022-08-25historical Contingent 175-char remark
Show marketing remark (175 chars)
Great location! Each unit pays all separate utilities. One unit recently vacant - live in one and rent the other. With some work and updates this could be a great investment.
-
2022-04-28$75,000 Active 175-char remark
Show marketing remark (175 chars)
Great location! Each unit pays all separate utilities. One unit recently vacant - live in one and rent the other. With some work and updates this could be a great investment.
-
2018-01-15historical Expired
-
2017-07-11price $85,000
-
2017-01-22$75,000 Active
-
1990-03-20soldstatus $25,000
ⓘ Source: listings_history table (triggers on properties + properties_extension) + one-shot
backfill from property_details.listing_events for pre-trigger history.
Tax reassessment forecast PA · Partial reset (capped growth)
- Current annual tax
- $2,646 · $221/mo
- Projected year-2 tax
- $3,264 · $272/mo
- Expected delta
- +$618/yr (+$51/mo · 23.3%)
ⓘ Screening estimate from a state-policy table — verify with the county assessor before closing.
Climate risk First Street
- Flood 1/10 Low FEMA zone X (unshaded) · 0% chance over 30 yrs
- Wildfire 1/10 Low
- Heat 4/10 Moderate 7 d/yr ≥97°F today · 18 d/yr by 30 yrs out
- Wind 2/10 Low
- Air quality 4/10 Moderate 4 unhealthy d/yr today · 5 by 30 yrs out
Nearby sold comps map
Loading sold comps map…
Walkable amenities ~0.75 mi
Loading nearby amenities…
Taxation est. · year 1
- Rental income
- $27,296
- − Mortgage interest
- −$13,763
- − Property taxes
- −$2,646
- − Insurance
- −$1,228
- − Repairs & maintenance
- −$2,184
- − Management
- −$2,184
- − Depreciation
- −$7,148
- Taxable loss
- −$1,857
- Est. tax savings @ 24.0%
- +$446
- After-tax cash flow
- $2,673/yr
For passive investors: Depreciation is non-cash, so a rental often shows a tax loss while cash-flowing — sheltering income. Rental losses are passive: they offset passive income freely, and up to $25,000/yr can offset ordinary (W-2) income if you actively participate and your MAGI is under $100k (phasing out to $0 by $150k); unused losses carry forward. On sale, claimed depreciation is recaptured at up to 25%, and gains may owe capital-gains tax (a 1031 exchange can defer both). Figures are a year-1 estimate at your 24.0% rate — not tax advice; consult a CPA.
Schools (NCES district)
- District
- West Mifflin Area SD
- NCES district ID
- 4225680
- Math proficiency
- 19% ▼ -19.00%
- Reading proficiency
- 41% ▼ -14.00%
- Median HH income
- $46,532
- Composite
- 25.78/100
- National rank
- #7371
- State rank
- #443 of 539 in PA
Livability — West Mifflin
- Score
- 73/100
- State rank
- #539
- US rank
- #5042
Category grades
Schools grade is shown separately in the Schools card above.
Census & demographics
- Census place
- West Mifflin, PA
- County
- Allegheny County · 1,022,028 people
- City population
- 18,816
- Metro
- Pittsburgh, PA
- Population (ZIP)
- 18,816
- Household income
- $72,485
- Rent vs Own
- Severe rent burden
- 334.0
Population outlook (Allegheny County) Hauer SSP2
- Today (2025)
- 1,250,282 people
- By 2030
- 1,256,482 · +0.5%
- By 2040
- 1,256,318 · +0.5%
- By 2050
- 1,244,169 · -0.5%
- By 2075
- 1,197,693 · -4.2%
- By 2100
- 1,093,187 · -12.6%
Race, ethnicity, and origin ACS 2023
- Neighborhood character
- Predominantly White (81%)
- Race & ethnicity
- White 81% Black 9% Two or more races 7% Hispanic / Latino 2% Asian 1%
- Common ancestry
- Romanian 9% Slovak 1% Scotch-Irish 1%
- Foreign-born
- 1% · South Korea
- Languages at home
- 93% English-only · Spanish 4% Other Indo-European 1%
Political lean MEDSL · Allegheny
- 2024 margin
- Strong D (+20.3) · D 59.7% · R 39.4%
- 2008→2024 swing
- +4.8pp toward D · 2008: 15.5pp · 2024: 20.3pp
- All cycles
- 2024: D+20.3 2020: D+20.4 2016: D+16.4 2012: D+14.4 2008: D+15.5
Not yet ingested
- Civics
- —
Market trends
- HPI YoY
- ▼ -107.69%
- Current HPI
- 246.2486
- Rent YoY
- —
- Metro
- Pittsburgh, PA
- State GDP YoY
- ▲ 1.68%
- F500 in state
- 34
Industry mix (Fortune 500 HQ in PA)
| Industry | F500 HQs | Revenue |
|---|---|---|
| Healthcare | 2 | $309B |
|
||
| Insurance | 2 | $27B |
|
||
| Telecommunications / Media | 1 | $124B |
|
||
| Industrial Distribution | 1 | $22B |
|
||
| Financial Services | 1 | $20B |
|
||
| Chemicals / Materials | 1 | $18B |
|
||
Price history
+922.8% since first listed10 events — show timeline
- 2026-05-04 Price Changed $255,700 West Penn MLS
- 2026-03-25 Relisted — West Penn MLS
- 2025-11-23 Listed $265,700 West Penn MLS
- 2023-08-28 Sold (Public Records) $45,000 Public Records
- 2022-08-25 Contingent — West Penn MLS
- 2022-04-28 Listed $75,000 West Penn MLS
- 2018-01-15 Delisted — West Penn MLS
- 2017-07-11 Price Changed $85,000 West Penn MLS
- 2017-01-22 Listed $75,000 West Penn MLS
- 1990-03-20 Sold (Public Records) $25,000 Public Records
Property tax history
+1.9%/yrLatest (2026): $2,646 · +3.9% YoY. Source: county tax records.
Cash-flow waterfall
monthlySold comps — $/sqft
last 12 mo · ≤1 miLoading sold comps…