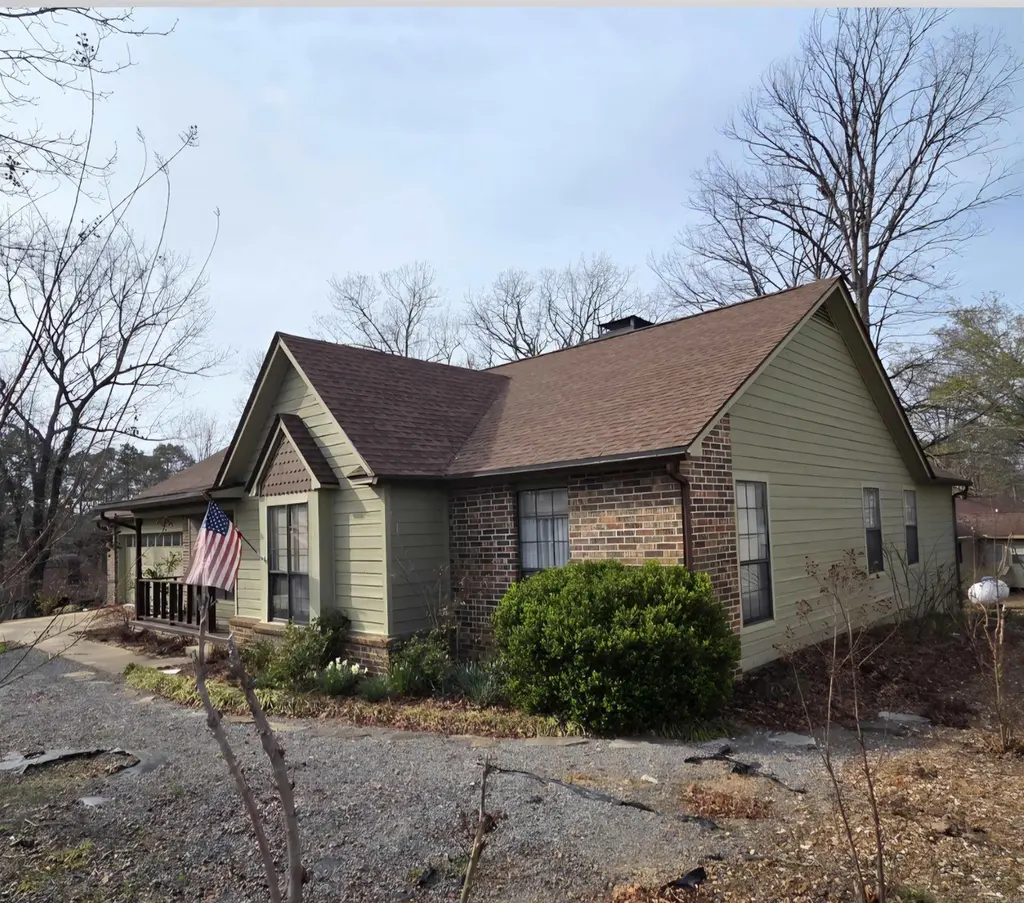
112 Kings Pl · Fairfield Bay, AR
Flood risk 1/10 · Minimal
- FEMA flood zone
- X
- Chance of flooding over 30 yrs
- 0.0%
- Est. flood insurance / yr
- $507 – $1,088
Fire risk 2/10 · Minimal
- Est. fire insurance / yr
- $1,499 – $2,785
Heat risk 4/10 · Minor
- Hot days now (above 107°F)
- 6 days/yr
- Hot days in 30 yrs
- 15 days/yr
Wind risk 3/10 · Minor
- Chance of severe wind over 30 yrs
- 6.0%
Air-quality risk 2/10 · Minimal
- Unhealthy air days now
- 0 days/yr
- Unhealthy air days in 30 yrs
- 1 days/yr
Risk factors via First Street. Map © Google.
Why this score? — see what drove the C grade
The composite is a weighted blend of 9 inputs, each scored 0–100. Each bar is that input's sub-score; the figure is the points it added to the 100-point composite (weight × sub-score).
- Cash flow +15.6/30.0
- ARV discount +15.0/15.0
- DSCR +4.8/10.0
- Appreciation +4.8/10.0
- 1% rule +3.8/10.0
- Schools +3.8/10.0
- Livability +3.1/5.0
- Rent growth +2.5/5.0
- Condition / age +2.5/5.0
$199,900
🖨 Deal sheet 📄 Offer letter ✓ Due diligence
Listing remarks MLS
Welcome to market this beautifully updated 3 bedroom, 2 bath home located on a desirable corner lot in Fairfield Bay! This home has seen numerous updates, including granite countertops installed in 2019, new stainless steel appliances, and new laminate flooring throughout. Enjoy outdoor living on the screened-in porch overlooking beautifully maintained landscaping. The exterior was freshly painted in 2021 along with a new roof, plus new HVAC for peace of mind. Interior updates include new sink faucets, toilets, and fixtures in 2021, with freshly painted cabinets completed in 2025. This move-in-ready home offers both style and functionality in a great location. Take advantage of all Fairfield Bay amenities including golf courses, pools, trails, marina access, and more. Perfect as a full-time residence, vacation home, or investment opportunity!
Key facts
- Laminate flooring
- Screened-in porch
- Granite countertops
Tags
Neighborhood map
What this means for you Summary
Snapshot
- This is a 3-bed/2.0-bath single-family listed at $200k.
Deal economics
- At list price, monthly cash flow is $85 ($1k/yr) — positive.
- The deal already cash-flows at list — no discount required.
- To meet the 1% rule (rent ≥ 1% of price), the offer needs to be $176k (11.8% below list).
- Recommended offer: $176k (11.8% below list) — sets the bar for 1% rule.
- Cap rate 6.8% vs local median 5.3% in Fairfield Bay — meaningfully above typical; check what's discounted (condition, days-on-market, listing class) to confirm the premium yield is real.
Location & tenants
- Location reads 62/100 on livability (#220 in AR) — a middle-class / working-renter tenant base. Strengths: cost of living A+, housing A+, crime B; Watch: employment D+, schools F, amenities F.
- Shirley School District (rural): math 44% / reading 42% proficiency, ranked #132 of 245 in AR (top 54%) — families likely to look elsewhere, expect single-tenant / working-renter base with shorter leases; 73% free/reduced lunch — lower-income household profile, screen leases tightly.
- Market conditions: 259 active listings in the ZIP; 16 units permitted in Van Buren County in 2024 (0 in 5+ unit buildings).
Forward outlook
- In year one you build about $430 of equity ($1k loan paydown + $-952 appreciation (-0.5% local appreciation)).
- Van Buren County population projected at -27% by 2050 — secular population decline; favor cash flow + early exit over multi-decade hold.
Negotiation context
- It's been on market 85 days — a 6% lower offer ($188k) is reasonable based on typical stale-listing flexibility.
- 2 sale attempts since 15y ago; this cycle's ask has dropped $25k (11%) from the opening price — seller is motivated, your offer sets the floor, not the list.
- Current owner paid $148k; 36% above their basis — modest negotiation headroom, anchor on the comps not their cost.
Questions for the listing agent
- It's been on market 85 days. Have you received any prior offers? Is the seller open to a 12% concession, seller financing, or rate buy-down credit?
- Built in 1978 — when were the roof, HVAC, electrical panel, plumbing, and water heater last replaced?
- What does the HOA fee cover, when was the last increase, and are there any pending special assessments or reserve-fund shortfalls?
- Why hasn't it sold? Are there any deal-killer items the seller is aware of (foundation, flood, title, zoning, code violations)?
- Is there a deadline driving the sale (1031 exchange, divorce, estate, relocation)? That informs how much negotiation room exists.
- Schools are F-rated, which usually means shorter tenancies and higher turnover. Who's the typical renter profile here, and what's been the actual vacancy rate?
- What's the average days-on-market for RENTAL listings here right now (not sales)? A rising rental-DOM trend means longer vacancies and softer asking-rent achievability than the comps imply.
- What's the recent tenant-quality profile in this submarket — average credit score on applications, eviction rate, late-payment / NSF rate, and stable-employment percentage? A property-management company in the area should have these aggregated.
- How much new for-sale + rental construction is in the pipeline within 1–3 miles? Heavy new supply typically softens prices + rents 12–24 months out; constrained supply supports both.
Investment metrics
- 1% rule
- 0.88% ✗
- Cap rate
- 6.81%
- Cash-on-cash
- 1.83%
- DSCR
- 1.08
- GRM
- 9.4
CMA / ARV
- ARV (median comp)
- $267,391
- List price
- $199,900
- Delta
- -25.24%
- Verdict
- UNDERPRICED
- Comps
- 20 within 1.0 mi
Show comp detail 9 sales within ~0.75 mi
| Address | Dist | Beds/Ba | Sqft | Sold | Price | $/sf | Match |
|---|---|---|---|---|---|---|---|
| 193 E Blue Ridge Ter | 0.27mi | 3/2.0 | 1,728 (-6%) | 11mo | $306,500 | $177 | 67 |
| 135 Castle Ridge Hts | 0.37mi | 3/2.0 | 1,876 (+2%) | 24mo | $300,000 | $160 | 60 |
| 315 Snead Dr | 0.48mi | 4/3.0 (+1) | 1,779 (-4%) | 11mo | $265,000 | $149 | 54 |
| 121 Rock Hill Rd | 0.74mi | 3/2.5 | 1,750 (-5%) | 2mo | $299,900 | $171 | 53 |
| 106 Blue Ridge Ct | 0.63mi | 2/2.0 (-1) | 1,811 (-2%) | 14mo | $260,000 | $144 | 50 |
| 438 Woodlawn Dr | 0.64mi | 3/2.0 | 1,704 (-8%) | 13mo | $200,000 | $117 | 46 |
| 203 Snead Dr | 0.70mi | 3/2.0 | 1,968 (+7%) | 20mo | $182,500 | $93 | 40 |
| 242 Snead Dr | 0.62mi | 3/2.5 | 2,120 (+15%) | 8mo | $305,000 | $144 | 38 |
| 136 Pine Hill Rd | 0.68mi | 3/2.5 | 1,632 (-12%) | 17mo | $214,900 | $132 | 33 |
Match score weights: distance 35% · size 25% · config 20% · recency 20%. Top-matched comps best support the ARV.
Projected returns pro-forma
-0.48% appreciation · 3.0% rent growth · sell at horizon
- IRR
- -1.9%
- Equity multiple
- 0.91×
- Total profit
- $-4,866
- Equity at exit
- $53,328
- IRR
- 4.2%
- Equity multiple
- 1.43×
- Total profit
- $24,006
- Equity at exit
- $60,451
Cash invested: $55,972 (down + closing). Projections, not guarantees.
Landlord ↔ Tenant lean methodology
- Overall (STATE)
- 92 Strongly Landlord-Friendly
- State Arkansas
- 92 Strongly Landlord-Friendly · R+14
- County
- — inherits STATE
- City
- — inherits STATE
ZIP-level market 72088
- Home prices YoY
- -0.2%
- Active inventory
- 259
- Price-to-rent
- 9.4×
Monthly cashflow live
- Estimated rent
- $1,763 medium interval (Pro) →
- Mortgage (P&I)
- −$1,048
- Tax from tax record
- −$44 /mo · $525/yr
- Insurance
- −$83
- HOA
- −$132
- Vacancy / Maint / Mgmt
- −$370
- Net cashflow
- $85
Break-even live
UW: 25.0% down · 7.5% · 30yr · 1.5% tax · 5.0% vac · 8.0% maint · 8.0% mgmt
Financing live
Cash to close
- Down payment
- $49,975
- Closing costs
- $5,997
- Reserves months
- —
- Total cash needed
- —
Loan-product check · same deal, 3 products live
Conventional
25% down · 7.5% · 30yr
- Down + closing
- —
- Monthly P&I
- —
- Monthly cashflow
- —
- DSCR
- —
- Eligible?
- —
Personal DTI + credit; lowest rate.
DSCR
20% down · 8.5% · 30yr
- Down + closing
- —
- Monthly P&I
- —
- Monthly cashflow
- —
- DSCR
- —
- Eligible?
- —
No personal income docs; deal must DSCR.
Hard money
10% down · 12.0% · 12mo
- Down + closing
- —
- Monthly P&I
- —
- Monthly cashflow
- —
- DSCR
- —
- Eligible?
- —
Short-term bridge; refi at stabilization.
HOA detail
- Monthly dues
- $132 · $1,584/yr
- Likely covers
- landscapingpool
Listing history 24 events
-
2026-06-17status $199,900 Under Contract 85 DOM
-
2026-06-16days on market $199,900 Active 85 DOM
-
2026-06-15days on market $199,900 Active 84 DOM
-
2026-06-14days on market $199,900 Active 82 DOM
-
2026-06-12days on market $199,900 Active 81 DOM
-
2026-06-09days on market $199,900 Active 78 DOM
-
2026-06-08days on market $199,900 Active 77 DOM
-
2026-06-07days on market $199,900 Active 76 DOM
-
2026-06-07days on market $199,900 Active 75 DOM
-
2026-06-04days on market $199,900 Active 72 DOM
-
2026-06-02days on market $199,900 Active 71 DOM
-
2026-06-01days on market $199,900 Active 70 DOM
-
2026-05-31days on market $199,900 Active 69 DOM
-
2026-05-31days on market $199,900 Active 68 DOM
-
2026-05-07price $199,900 854-char remark
Show marketing remark (854 chars)
Welcome to market this beautifully updated 3 bedroom, 2 bath home located on a desirable corner lot in Fairfield Bay! This home has seen numerous updates, including granite countertops installed in 2019, new stainless steel appliances, and new laminate flooring throughout. Enjoy outdoor living on the screened-in porch overlooking beautifully maintained landscaping. The exterior was freshly painted in 2021 along with a new roof, plus new HVAC for peace of mind. Interior updates include new sink faucets, toilets, and fixtures in 2021, with freshly painted cabinets completed in 2025. This move-in-ready home offers both style and functionality in a great location. Take advantage of all Fairfield Bay amenities including golf courses, pools, trails, marina access, and more. Perfect as a full-time residence, vacation home, or investment opportunity!
-
2026-03-23$224,900 New Listing 854-char remark
Show marketing remark (854 chars)
Welcome to market this beautifully updated 3 bedroom, 2 bath home located on a desirable corner lot in Fairfield Bay! This home has seen numerous updates, including granite countertops installed in 2019, new stainless steel appliances, and new laminate flooring throughout. Enjoy outdoor living on the screened-in porch overlooking beautifully maintained landscaping. The exterior was freshly painted in 2021 along with a new roof, plus new HVAC for peace of mind. Interior updates include new sink faucets, toilets, and fixtures in 2021, with freshly painted cabinets completed in 2025. This move-in-ready home offers both style and functionality in a great location. Take advantage of all Fairfield Bay amenities including golf courses, pools, trails, marina access, and more. Perfect as a full-time residence, vacation home, or investment opportunity!
-
2014-09-10soldstatus $147,500
-
2014-09-05soldstatus $147,500 499-char remark
Show marketing remark (499 chars)
What a beautiful home to relax and enjoy the Indian Hills area in. Just off the golf course, this custom Tremont Style has an open and airy living space complete with gas log fireplace, wet bar, and skylight. The large windows on rear open to a nice screen porch and beautifully landscaped yard. From the formal dining room, catch a glimpse of Greers Ferry Lake. The spacious and updated kitchen has a nice bay window for your morning coffee. The spacious Master Suite offers double walk in closets.
-
2014-04-01historical 499-char remark
Show marketing remark (499 chars)
What a beautiful home to relax and enjoy the Indian Hills area in. Just off the golf course, this custom Tremont Style has an open and airy living space complete with gas log fireplace, wet bar, and skylight. The large windows on rear open to a nice screen porch and beautifully landscaped yard. From the formal dining room, catch a glimpse of Greers Ferry Lake. The spacious and updated kitchen has a nice bay window for your morning coffee. The spacious Master Suite offers double walk in closets.
-
2011-10-26$147,500 499-char remark
Show marketing remark (499 chars)
What a beautiful home to relax and enjoy the Indian Hills area in. Just off the golf course, this custom Tremont Style has an open and airy living space complete with gas log fireplace, wet bar, and skylight. The large windows on rear open to a nice screen porch and beautifully landscaped yard. From the formal dining room, catch a glimpse of Greers Ferry Lake. The spacious and updated kitchen has a nice bay window for your morning coffee. The spacious Master Suite offers double walk in closets.
-
2005-11-09soldstatus $150,000
-
2003-08-08soldstatus $145,500
-
1998-01-09soldstatus $135,000
-
1988-03-02soldstatus $108,000
ⓘ Source: listings_history table (triggers on properties + properties_extension) + one-shot
backfill from property_details.listing_events for pre-trigger history.
Tax reassessment forecast AR · Resets to sale price
- Current annual tax
- $525 · $44/mo
- Projected year-2 tax
- $1,279 · $107/mo
- Expected delta
- +$754/yr (+$63/mo · 143.6%)
ⓘ Screening estimate from a state-policy table — verify with the county assessor before closing.
Climate risk First Street
- Flood 1/10 Low FEMA zone X · 0% chance over 30 yrs
- Wildfire 2/10 Low
- Heat 4/10 Moderate 6 d/yr ≥107°F today · 15 d/yr by 30 yrs out
- Wind 3/10 Moderate 6% chance of damaging wind over 30 yrs
- Air quality 2/10 Low 0 unhealthy d/yr today · 1 by 30 yrs out
Nearby sold comps map
Loading sold comps map…
Walkable amenities ~0.75 mi
Loading nearby amenities…
Taxation est. · year 1
- Rental income
- $21,155
- − Mortgage interest
- −$11,198
- − Property taxes
- −$525
- − Insurance
- −$1,000
- − Repairs & maintenance
- −$1,692
- − Management
- −$1,692
- − HOA
- −$1,584
- − Depreciation
- −$5,815
- Taxable loss
- −$2,352
- Est. tax savings @ 24.0%
- +$564
- After-tax cash flow
- $1,588/yr
For passive investors: Depreciation is non-cash, so a rental often shows a tax loss while cash-flowing — sheltering income. Rental losses are passive: they offset passive income freely, and up to $25,000/yr can offset ordinary (W-2) income if you actively participate and your MAGI is under $100k (phasing out to $0 by $150k); unused losses carry forward. On sale, claimed depreciation is recaptured at up to 25%, and gains may owe capital-gains tax (a 1031 exchange can defer both). Figures are a year-1 estimate at your 24.0% rate — not tax advice; consult a CPA.
Schools (NCES district)
- District
- Shirley School District
- NCES district ID
- 0512420
- Math proficiency
- 44% ▲ 4.00%
- Reading proficiency
- 42% ▲ 1.00%
- Median HH income
- $36,296
- Composite
- 37.98/100
- National rank
- #8669
- State rank
- #132 of 245 in AR
Livability — Fairfield Bay
- Score
- 62/100
- State rank
- #220
- US rank
- #16778
Category grades
Schools grade is shown separately in the Schools card above.
Census & demographics
- Census place
- Fairfield Bay, AR
- City population
- 2,264
- Population (ZIP)
- 2,264
Population outlook (Van Buren County) Hauer SSP2
- Today (2025)
- 15,459 people
- By 2030
- 14,645 · -5.3%
- By 2040
- 12,918 · -16.4%
- By 2050
- 11,263 · -27.1%
- By 2075
- 7,870 · -49.1%
- By 2100
- 4,918 · -68.2%
Race, ethnicity, and origin ACS 2023
- Neighborhood character
- Predominantly White (88%)
- Race & ethnicity
- White 88% Hispanic / Latino 6% Two or more races 3% Asian 2%
- Hispanic origin (detail)
- Mexican 6%
- Common ancestry
- Lithuanian 9% Iranian 2% Romanian 2%
- Foreign-born
- 3% · Canada, Dominican Republic
- Languages at home
- 94% English-only · Other Asian/Pacific 4% Tagalog/Filipino 1% Spanish 1%
Political lean MEDSL · Van Buren
- 2024 margin
- Solid R (+60.2) · D 18.9% · R 79.0% · Other 2.1%
- 2008→2024 swing
- -28.5pp toward R · 2008: -31.7pp · 2024: -60.2pp
- All cycles
- 2024: R+60.2 2020: R+56.9 2016: R+53.9 2012: R+39.5 2008: R+31.7
Not yet ingested
- Civics
- —
Market trends
- HPI YoY
- ▼ -0.48%
- Current HPI
- 238.2694
- Rent YoY
- —
- Metro
- —
- State GDP YoY
- ▲ 3.80%
- F500 in state
- 10
Industry mix (Fortune 500 HQ in AR)
| Industry | F500 HQs | Revenue |
|---|---|---|
| Retail | 1 | $681B |
|
||
| Food / Agriculture | 1 | $53B |
|
||
| Retail / Energy | 1 | $22B |
|
||
| Transportation / Logistics | 1 | $12B |
|
||
| Energy | 1 | $4B |
|
||
Price history
+85.1% since first listed10 events — show timeline
- 2026-05-07 Price Changed $199,900 CARMLS
- 2026-03-23 Listed $224,900 CARMLS
- 2014-09-10 Sold (Public Records) $147,500 Public Records
- 2014-09-05 Sold (MLS) $147,500 CARMLS
- 2014-04-01 Listing Removed — CARMLS
- 2011-10-26 Listed $147,500 CARMLS
- 2005-11-09 Sold (Public Records) $150,000 Public Records
- 2003-08-08 Sold (Public Records) $145,500 Public Records
- 1998-01-09 Sold (Public Records) $135,000 Public Records
- 1988-03-02 Sold (Public Records) $108,000 Public Records
Property tax history
+0.1%/yrLatest (2025): $525 · -16.0% YoY. Source: county tax records.
Cash-flow waterfall
monthlySold comps — $/sqft
last 12 mo · ≤1 miLoading sold comps…