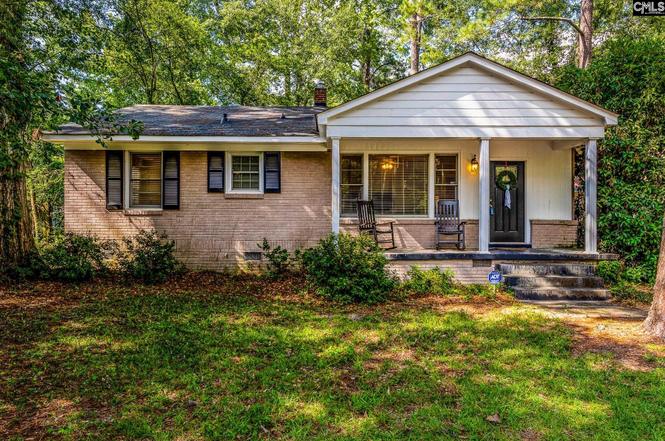
3963 Live Oak St · Columbia, SC
Flood risk 1/10 · Minimal
- FEMA flood zone
- X (unshaded)
- Chance of flooding over 30 yrs
- 0.0%
- Est. flood insurance / yr
- $507 – $1,088
Fire risk 3/10 · Minor
- Est. fire insurance / yr
- $783 – $1,453
Heat risk 6/10 · Moderate
- Hot days now (above 109°F)
- 7 days/yr
- Hot days in 30 yrs
- 16 days/yr
Wind risk 6/10 · Moderate
- Chance of severe wind over 30 yrs
- 65.0%
Air-quality risk 3/10 · Minor
- Unhealthy air days now
- 2 days/yr
- Unhealthy air days in 30 yrs
- 2 days/yr
Risk factors via First Street. Map © Google.
Why this score? — see what drove the D+ grade
The composite is a weighted blend of 9 inputs, each scored 0–100. Each bar is that input's sub-score; the figure is the points it added to the 100-point composite (weight × sub-score).
- ARV discount +13.8/15.0
- Cash flow +12.2/30.0
- Rent growth +4.2/5.0
- Livability +3.9/5.0
- DSCR +3.6/10.0
- Schools +2.6/10.0
- 1% rule +2.5/10.0
- Condition / age +2.5/5.0
- Appreciation +0.0/10.0
$200,000
🖨 Deal sheet (PDF) 📄 Offer letter ✓ Due diligence
Listing remarks
Welcome to 3963 Live Oak Street! This charming 3-bedroom, 1-bath home giving both comfort and convenience in the heart of Columbia. Inside, you’ll find a bright living area with hardwood floors in great shape, a functional kitchen, and spacious bedrooms. The bathroom features a refreshed tub surround, and the home has fresh paint throughout. Major updates include a new HVAC system installed in 2017.Outside, relax on the beautiful front porch or enjoy the large backyard—perfect for entertaining, gardening, or pets. The property is located just minutes from downtown Columbia, Rosewood, and Five Points, providing quick access to shopping, dining, and entertainment. Zoned for popula
Key facts
- Front porch
- Large backyard
- Hardwood floors
Tags
Property features AI
Finance
- Other: Paved road access; Property on approximately 0.21 acre lot
Exterior
- Parking: Attached carport
- Utilities: Public water; Public sewer
- Home design: Single-story home
- Construction: Crawlspace foundation
- Exterior features: Deck; Shed; Partial brick exterior above foundation; Privacy wood fence in rear
Interior
- Kitchen: Kitchen on main level; Hardwood floor in kitchen
- Bedrooms: Master bedroom on main level with hardwood floor; Second bedroom on main level with hardwood floor; Third bedroom on main level with hardwood floor
- Flooring: Hardwood flooring
- Bathrooms: One full bathroom on main level
- Heating & cooling: Central heating; Central cooling
- Interior features: Hardwood floors throughout main living areas; Hardwood floor in kitchen
Neighborhood map
What this means for you Summary
Snapshot
- This is a 2-bed/1.0-bath single-family listed at $200k.
Deal economics
- At list price, monthly cash flow is $-41 ($-492/yr) — negative.
- To cash-flow at today's rent, offer at most $193k (3.6% below list).
- To meet the 1% rule (rent ≥ 1% of price), the offer needs to be $149k (25.4% below list).
- Recommended offer: $149k (25.4% below list) — sets the bar for 1% rule.
Location & tenants
- Location reads 78/100 on livability (#18 in SC, #2,436 nationally) — a middle-class / working-renter tenant base. Strengths: amenities A+, commute A+, cost of living A+; Watch: employment D, crime F.
- Richland 01 (urban): math 26% / reading 36% proficiency, ranked #54 of 80 in SC (top 68%) — families likely to look elsewhere, expect single-tenant / working-renter base with shorter leases; 64% free/reduced lunch — lower-income household profile, screen leases tightly.
- Zoned schools: South Kilbourne Elementary (math 12% / reading 17%, grade F, #553 of 597 statewide, top 95%, 296 students, 100% FRL); Hand Middle (math 29% / reading 37%, grade F, #116 of 229 statewide, top 51%, 652 students, 100% FRL); Dreher High (math 47% / reading 92%, grade B, #60 of 196 statewide, top 32%, 1,150 students, 100% FRL) — zoned schools average 100% FRL vs 64% district-wide (36 pts higher); higher-poverty schools than district average — tighter screening recommended.
- Market conditions: Rents rising fast (+7.0%/yr); 150 active listings in the ZIP; 40 comparable units currently listed for rent nearby; rentals at typical pace (median 26d on market — plan ~3-4 weeks tenant-placement turnaround); 3,472 units permitted in Richland County in 2024 (1,096 in 5+ unit buildings).
Forward outlook
- Local home prices are declining (-3.0%/yr); year-one equity from $1k of loan paydown is wiped out by about $6k of value loss. Plan a longer hold.
- Richland County population projected at +30% by 2050 — long-run rental-demand tailwind backs the buy-and-hold thesis.
Negotiation context
- It's been on market 87 days — a 6% lower offer ($188k) is reasonable based on typical stale-listing flexibility.
- 3 sale attempts with the ask held roughly flat each time — persistent listings suggest the price (not the market) is what's stuck; bring a comps-based counter.
- Current owner paid $128k; list at $200k implies a 56% gain — meaningful room to come down on a strong offer.
Risks & watch-outs
- Watch-outs: built in 1950 — expect roof / HVAC / electrical / plumbing capex.
- Climate carrying-cost: major wind risk, 65% chance of damaging wind over 30y; extreme-heat days projected 7→16/yr by 2055 (HVAC capex compounding) — expect insurance premiums to compound above CPI over the hold.
Questions for the listing agent
- What do current leases actually rent for vs. the listed asking? Can we see a recent rent roll and the last 12 months of T-12 income?
- It's been on market 87 days. Have you received any prior offers? Is the seller open to a 25% concession, seller financing, or rate buy-down credit?
- Built in 1950 — when were the roof, HVAC, electrical panel, plumbing, and water heater last replaced?
- Why hasn't it sold? Are there any deal-killer items the seller is aware of (foundation, flood, title, zoning, code violations)?
- Is there a deadline driving the sale (1031 exchange, divorce, estate, relocation)? That informs how much negotiation room exists.
- Schools are D-rated, which usually means shorter tenancies and higher turnover. Who's the typical renter profile here, and what's been the actual vacancy rate?
- Crime grade is F in this area — have there been break-ins, vandalism, or insurance claims at this property in the last 3 years? What carrier currently insures it and at what premium?
- The area grade is low — what's the realistic commute time and amenity access for the typical tenant pool here? Any planned neighborhood developments (good or bad) we should know about?
- What's the average days-on-market for RENTAL listings here right now (not sales)? A rising rental-DOM trend means longer vacancies and softer asking-rent achievability than the comps imply.
- What's the recent tenant-quality profile in this submarket — average credit score on applications, eviction rate, late-payment / NSF rate, and stable-employment percentage? A property-management company in the area should have these aggregated.
- How much new for-sale + rental construction is in the pipeline within 1–3 miles? Heavy new supply typically softens prices + rents 12–24 months out; constrained supply supports both.
Investment metrics
- 1% rule
- 0.75% ✗
- Cap rate
- 6.05%
- Cash-on-cash
- -0.88%
- DSCR
- 0.96
- GRM
- 11.2
CMA / ARV
- ARV (on-the-fly)
- $232,388
- Comps found
- 1
Show comp detail 1 sale within ~0.75 mi
| Address | Dist | Beds/Ba | Sqft | Sold | Price | $/sf | Match |
|---|---|---|---|---|---|---|---|
| 1207 Chevis St | 0.33mi | 2/2.0 | 1,116 (+5%) | 2mo | $243,000 | $218 | 72 |
Match score weights: distance 35% · size 25% · config 20% · recency 20%. Top-matched comps best support the ARV.
Projected returns pro-forma
-3.0% appreciation · 6.95% rent growth · sell at horizon
- IRR
- -14.0%
- Equity multiple
- 0.48×
- Total profit
- $-28,929
- Equity at exit
- $29,821
- IRR
- -0.3%
- Equity multiple
- 0.97×
- Total profit
- $-1,405
- Equity at exit
- $17,292
Cash invested: $56,000 (down + closing). Projections, not guarantees.
Landlord ↔ Tenant lean methodology
- Overall (STATE)
- 90 Strongly Landlord-Friendly
- State South Carolina
- 90 Strongly Landlord-Friendly · R+6
- County
- — inherits STATE
- City
- — inherits STATE
ZIP-level market 29205
- Rents YoY
- 7.0%
- Active inventory
- 150
- Price-to-rent
- 11.2×
Monthly cashflow live
- Estimated rent
- $1,493 high interval (Pro) →
- Mortgage (P&I)
- −$1,049
- Tax from tax record
- −$88 /mo · $1,058/yr
- Insurance
- −$83
- HOA
- −$0
- Vacancy / Maint / Mgmt
- −$313
- Net cashflow
- $-41
Break-even live
Sensitivity live
| Price | -10% $72 | -5% $16 | +0% $-41 | +5% $-98 | +10% $-154 |
|---|---|---|---|---|---|
| Rent | -10% $-159 | -5% $-100 | +0% $-41 | +5% $18 | +10% $77 |
| Rate | -1.0pp $60 | -0.5pp $10 | base $-41 | +0.5pp $-93 | +1.0pp $-146 |
UW: 25.0% down · 7.5% · 30yr · 1.5% tax · 5.0% vac · 8.0% maint · 8.0% mgmt
Financing live
Cash to close
- Down payment
- $50,000
- Closing costs
- $6,000
- Reserves months
- —
- Total cash needed
- —
Loan-product check · same deal, 3 products live
Conventional
25% down · 7.5% · 30yr
- Down + closing
- —
- Monthly P&I
- —
- Monthly cashflow
- —
- DSCR
- —
- Eligible?
- —
Personal DTI + credit; lowest rate.
DSCR
20% down · 8.5% · 30yr
- Down + closing
- —
- Monthly P&I
- —
- Monthly cashflow
- —
- DSCR
- —
- Eligible?
- —
No personal income docs; deal must DSCR.
Hard money
10% down · 12.0% · 12mo
- Down + closing
- —
- Monthly P&I
- —
- Monthly cashflow
- —
- DSCR
- —
- Eligible?
- —
Short-term bridge; refi at stabilization.
Rent comps 40 comps
| Address | Beds | Baths | Sqft | Rent | $/sqft | DOM | Units | Dist |
|---|---|---|---|---|---|---|---|---|
| 914 Chevis St Columbia, SC | 3.0 | 2.0 | 1280 | $2,100 | $1.64 | 25d | 1 | 0.09mi |
| 3901 Bright Ave Columbia, SC | 3.0 | 1.0 | 1047 | $1,380 | $1.32 | 16d | 1 | 0.11mi |
| 721 Deerwood St Columbia, SC | 2.0 | 1.0 | 1000 | $1,150 | $1.15 | 16d | 1 | 0.13mi |
| 828 Suber St Unit E Columbia, SC | 2.0 | 1.0 | 1100 | $995 | $0.90 | 13d | 1 | 0.18mi |
| 23 Cavalier Ct Unit A Columbia, SC | 2.0 | 1.0 | 871 | $1,300 | $1.49 | 25d | 1 | 0.28mi |
| 823 S Kilbourne Rd Columbia, SC | 2.0 | 1.0 | 743 | $1,100 | $1.48 | 25d | 1 | 0.32mi |
| 524 S Beltline Blvd Columbia, SC | 2.0 | 1.0 | 1050 | $1,300 | $1.24 | 25d | 1 | 0.33mi |
| 3840 Overbrook Dr Columbia, SC | 2.0 | 2.0 | 900 | $1,595 | $1.77 | 25d | 1 | 0.35mi |
| 3732 Hickory St Columbia, SC | 2.0 | 1.5 | 840 | $1,350 | $1.61 | 25d | 1 | 0.37mi |
| 1324 Deerwood St Unit 1 Columbia, SC | 2.0 | 2.0 | 1030 | $1,350 | $1.31 | 25d | 1 | 0.41mi |
| 1 Tempo Ct Columbia, SC | 3.0 | 1.5 | 1032 | $1,745 | $1.69 | 25d | 1 | 0.43mi |
| 21 Tempo Ct Columbia, SC | 3.0 | 1.5 | 1032 | $1,498 | $1.45 | 13d | 1 | 0.44mi |
| 320 S Beltline Blvd Columbia, SC | 2.0 | 1.0 | 800 | $1,048 | $1.31 | 25d | 5 | 0.52mi |
| 3425 Manor Ave Columbia, SC | 3.0 | 2.0 | 1200 | $2,100 | $1.75 | 13d | 1 | 0.56mi |
| 500 Gills Creek Pkwy Columbia, SC | 1.0–2.0 | 1.0–2.0 | 807 | $1,375 | $1.70 | 13d | 27 | 0.60mi |
| 501 Pelham Dr Columbia, SC | 1.0–2.0 | 1.0–2.0 | 805 | $1,625 | $2.02 | 4d | 24 | 0.63mi |
| 317 Beltline Blvd Unit 1 Columbia, SC | 3.0 | 1.0 | 1150 | $1,200 | $1.04 | 25d | 1 | 0.71mi |
| 3626 Hydrangea St Columbia, SC | 2.0 | 1.0 | 800 | $1,040 | $1.30 | 23d | 1 | 0.72mi |
| 4319 Wilmot Ave Columbia, SC | 3.0 | 1.0 | 1000 | $1,650 | $1.65 | 25d | 1 | 0.79mi |
| 1649 S Beltline Blvd Columbia, SC | 2.0 | 1.0 | 900 | $1,250 | $1.39 | 25d | 1 | 0.87mi |
| 222 Prospect St Unit 224 Columbia, SC | 2.0 | 1.0 | 750 | $1,250 | $1.67 | 25d | 1 | 0.92mi |
| 3800 Wilmot Ave Columbia, SC | 2.0 | 1.0 | 720 | $1,500 | $2.08 | 25d | 1 | 0.97mi |
| 715 Montague Rd Columbia, SC | 2.0 | 1.0 | 1000 | $1,180 | $1.18 | 25d | 1 | 0.97mi |
| 1840 Tall Pines Cir Columbia, SC | 3.0 | 1.5 | 1021 | $1,350 | $1.32 | 16d | 1 | 0.97mi |
| 1908 Tall Pines Cir Unit 4 Columbia, SC | 1.0 | 1.0 | 750 | $900 | $1.20 | 25d | 1 | 1.00mi |
| 4103 Devine St Columbia, SC | 1.0 | 1.0 | 785 | $1,072 | $1.37 | 25d | 1 | 1.08mi |
| 3125 Heyward St Unit A Columbia, SC | 3.0 | 1.0 | 1200 | $2,400 | $2.00 | 25d | 1 | 1.11mi |
| 3125 Heyward St Unit B Columbia, SC | 2.0 | 1.0 | 1100 | $1,600 | $1.45 | 25d | 1 | 1.11mi |
| 2725 Kingswood Dr Columbia, SC | 3.0 | 1.0 | 940 | $1,500 | $1.60 | 25d | 1 | 1.22mi |
| 712 Brandon Ave Unit 712 Brand Columbia, SC | 1.0 | 1.0 | 800 | $1,095 | $1.37 | 25d | 1 | 1.27mi |
| 914 Woodlawn Ave Columbia, SC | 3.0 | 2.0 | 1300 | $1,800 | $1.38 | 25d | 1 | 1.30mi |
| 1 Graymont Cir Columbia, SC | 3.0 | 2.5 | 1400 | $2,175 | $1.55 | 25d | 1 | 1.31mi |
| 807 Cedar Ter Columbia, SC | 2.0 | 1.0 | 937 | $1,200 | $1.28 | 16d | 1 | 1.31mi |
| 19 Graymont Cir Unit NA Columbia, SC | 3.0 | 2.0 | 1250 | $2,400 | $1.92 | 25d | 1 | 1.32mi |
| 13 Acme St Columbia, SC | 3.0 | 1.0 | 900 | $1,300 | $1.44 | 25d | 1 | 1.35mi |
| 915 Brandon Ave Columbia, SC | 2.0 | 1.0 | 1200 | $1,500 | $1.25 | 25d | 1 | 1.36mi |
| 822 Cedar Ter Unit 824 Columbia, SC | 1.0 | 1.0 | 775 | $895 | $1.15 | 16d | 1 | 1.36mi |
| 114 Easy St Columbia, SC | 2.0 | 2.0 | 1100 | $1,500 | $1.36 | 13d | 1 | 1.40mi |
| 318 S Woodrow St Columbia, SC | 2.0 | 1.0 | 1103 | $1,700 | $1.54 | 25d | 1 | 1.42mi |
| 4600 Fort Jackson Blvd Columbia, SC | 2.0 | 1.0 | 940 | $965 | $1.03 | 16d | 2 | 1.43mi |
Listing history 17 events
-
2026-04-22price $200,000
-
2026-03-03$207,000 Active
-
2026-01-07price $212,000
-
2025-11-04status Active
-
2025-10-17status Pending
-
2025-09-25price $215,000
-
2025-08-22$217,000 Active
-
2017-10-17soldstatus $128,500
-
2017-09-14price $129,500
-
2014-12-18soldstatus $113,500
-
2005-10-26soldstatus $132,000
-
2002-12-23soldstatus $115,000
-
2002-12-23soldstatus $115,000
-
2000-12-22soldstatus $107,000
-
2000-05-23soldstatus $70,000
-
1991-08-09soldstatus $57,500
-
1986-06-01soldstatus $50,900
ⓘ Source: listings_history table (triggers on properties + properties_extension) + one-shot
backfill from property_details.listing_events for pre-trigger history.
Tax reassessment forecast SC · Resets to sale price
- Current annual tax
- $1,058 · $88/mo
- Projected year-2 tax
- $1,140 · $95/mo
- Expected delta
- +$82/yr (+$7/mo · 7.8%)
ⓘ Screening estimate from a state-policy table — verify with the county assessor before closing.
Climate risk First Street
- Flood 1/10 Low FEMA zone X (unshaded) · 0% chance over 30 yrs
- Wildfire 3/10 Moderate
- Heat 6/10 Major 7 d/yr ≥109°F today · 16 d/yr by 30 yrs out
- Wind 6/10 Major 65% chance of damaging wind over 30 yrs
- Air quality 3/10 Moderate 2 unhealthy d/yr today · 2 by 30 yrs out
Nearby sold comps map
Loading sold comps map…
Walkable amenities ~0.75 mi
Loading nearby amenities…
Taxation est. · year 1
- Rental income
- $17,914
- − Mortgage interest
- −$11,203
- − Property taxes
- −$1,058
- − Insurance
- −$1,000
- − Repairs & maintenance
- −$1,433
- − Management
- −$1,433
- − Depreciation
- −$5,818
- Taxable loss
- −$4,032
- Est. tax savings @ 24.0%
- +$968
- After-tax cash flow
- $476/yr
For passive investors: Depreciation is non-cash, so a rental often shows a tax loss while cash-flowing — sheltering income. Rental losses are passive: they offset passive income freely, and up to $25,000/yr can offset ordinary (W-2) income if you actively participate and your MAGI is under $100k (phasing out to $0 by $150k); unused losses carry forward. On sale, claimed depreciation is recaptured at up to 25%, and gains may owe capital-gains tax (a 1031 exchange can defer both). Figures are a year-1 estimate at your 24.0% rate — not tax advice; consult a CPA.
Schools (NCES district)
- District
- Richland 01
- NCES district ID
- 4503360
- Math proficiency
- 26% ▼ -7.00%
- Reading proficiency
- 36% ▼ -5.00%
- Median HH income
- $38,931
- Composite
- 25.94/100
- National rank
- #7335
- State rank
- #54 of 80 in SC
Livability — Columbia
- Score
- 78/100
- State rank
- #18
- US rank
- #2436
Category grades
Schools grade is shown separately in the Schools card above.
Census & demographics
- Census place
- Columbia, SC
- County
- Richland County · 389,530 people
- City population
- 335,994
- Metro
- Columbia, SC
- Population (ZIP)
- 22,223
- Household income
- $64,231
- Rent vs Own
- Severe rent burden
- 1372.0
Population outlook (Richland County) Hauer SSP2
- Today (2025)
- 459,667 people
- By 2030
- 487,524 · +6.1%
- By 2040
- 542,035 · +17.9%
- By 2050
- 595,371 · +29.5%
- By 2075
- 732,998 · +59.5%
- By 2100
- 820,415 · +78.5%
Race, ethnicity, and origin ACS 2023
- Neighborhood character
- Predominantly White (73%)
- Race & ethnicity
- White 73% Black 16% Two or more races 6% Hispanic / Latino 5% Asian 3%
- Common ancestry
- Serbian 6% Slovak 4% Lithuanian 3%
- Foreign-born
- 4% · Canada, China
- Languages at home
- 93% English-only · Spanish 3% German/W. Germanic 1% Chinese 1%
Political lean MEDSL · Richland
- 2024 margin
- Solid D (+34.6) · D 66.4% · R 31.8% · Other 1.8%
- 2008→2024 swing
- +5.7pp toward D · 2008: 28.9pp · 2024: 34.6pp
- All cycles
- 2024: D+34.6 2020: D+38.3 2016: D+32.9 2012: D+33.3 2008: D+28.9
Not yet ingested
- Civics
- —
Market trends
- HPI YoY
- ▼ -457.47%
- Current HPI
- 230.5538
- Rent YoY
- ▲ 6.95%
- Metro
- Columbia, SC
- State GDP YoY
- ▲ 4.51%
- F500 in state
- 2
Industry mix (Fortune 500 HQ in SC)
| Industry | F500 HQs | Revenue |
|---|---|---|
| Packaging | 1 | $7B |
|
||
Price history
+292.9% since first listed17 events — show timeline
- 2026-04-22 Price Changed $200,000 Consolidated MLS
- 2026-03-03 Listed $207,000 Consolidated MLS
- 2026-01-07 Price Changed $212,000 Consolidated MLS
- 2025-11-04 Relisted — Consolidated MLS
- 2025-10-17 Pending — Consolidated MLS
- 2025-09-25 Price Changed $215,000 Consolidated MLS
- 2025-08-22 Listed $217,000 Consolidated MLS
- 2017-10-17 Sold (Public Records) $128,500 Public Records
- 2017-09-14 Price Changed $129,500 Consolidated MLS
- 2014-12-18 Sold (Public Records) $113,500 Public Records
- 2005-10-26 Sold (Public Records) $132,000 Public Records
- 2002-12-23 Sold (Public Records) $115,000 Public Records
- 2002-12-23 Sold (Public Records) $115,000 Public Records
- 2000-12-22 Sold (Public Records) $107,000 Public Records
- 2000-05-23 Sold (Public Records) $70,000 Public Records
- 1991-08-09 Sold (Public Records) $57,500 Public Records
- 1986-06-01 Sold (Public Records) $50,900 Public Records
Property tax history
+2.9%/yrLatest (2025): $1,058 · +3.6% YoY. Source: county tax records.
Cash-flow waterfall
monthlySold comps — $/sqft
last 12 mo · ≤1 miLoading sold comps…