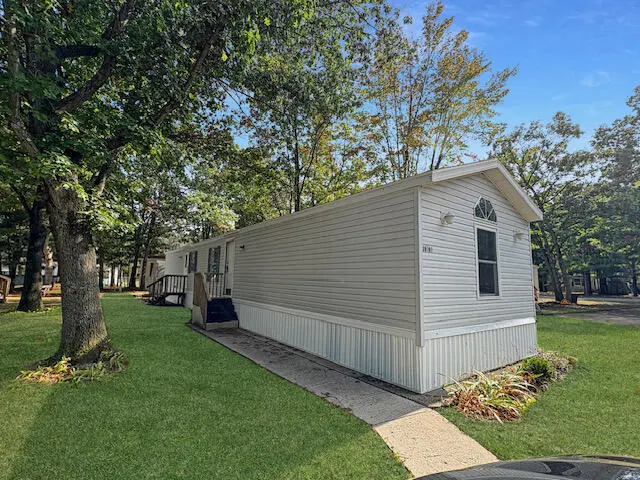
20101 Tamarack Dr · Reynolds, MI
Flood risk 1/10 · Minimal
- FEMA flood zone
- X
- Chance of flooding over 30 yrs
- 0.0%
- Est. flood insurance / yr
- $507 – $1,088
Fire risk 1/10 · Minimal
- Est. fire insurance / yr
- $784 – $1,456
Heat risk 2/10 · Minimal
- Hot days now (above 96°F)
- 7 days/yr
- Hot days in 30 yrs
- 14 days/yr
Wind risk 1/10 · Minimal
- Chance of severe wind over 30 yrs
- —
Air-quality risk 2/10 · Minimal
- Unhealthy air days now
- 1 days/yr
- Unhealthy air days in 30 yrs
- 1 days/yr
Risk factors via First Street. Map © Google.
Why this score? — see what drove the C- grade
The composite is a weighted blend of 9 inputs, each scored 0–100. Each bar is that input's sub-score; the figure is the points it added to the 100-point composite (weight × sub-score).
- Cash flow +16.9/30.0
- 1% rule +10.0/10.0
- ARV discount +7.5/15.0
- DSCR +5.3/10.0
- Schools +2.9/10.0
- Rent growth +2.5/5.0
- Livability +2.5/5.0
- Condition / age +2.5/5.0
- Appreciation +0.0/10.0
$45,000
🖨 Deal sheet 📄 Offer letter ✓ Due diligence
Listing remarks MLS
Welcome to this spacious 3-bedroom, 2-bathroom manufactured home in Howard City! New Roof!!! Featuring an open floor plan, the home offers a large living room that flows into a bright kitchen with ample cabinetry and counter space. The primary suite includes a private full bath, while two additional bedrooms and another full bathroom provide plenty of extra space. Set on a quiet lot, this property offers a comfortable lifestyle with easy access to local amenities and US-131 for commuting. With modern updates and room to personalize, this home is move-in ready and waiting for its next owner! Owner is licensed realtor in the state of MI.
Key facts
- Bright kitchen
- Open floor plan
- Ample cabinetry
Tags
Neighborhood map
What this means for you Summary
Snapshot
- This is a 3-bed/2.0-bath single-family listed at $45k.
Deal economics
- At list price, monthly cash flow is $30 ($360/yr) — positive.
- The deal already cash-flows at list — no discount required.
- Meets the 1% rule at list price ($1k rent vs $45k).
- Recommended offer: $41k (9.0% below list) — sets the bar for market timing.
Location & tenants
- Location reads: area grade C — affects rentability + tenant quality, not the cash-flow math above.
- Tri County Area Schools (rural): math 26% / reading 42% proficiency, ranked #302 of 540 in MI (top 56%) — families likely to look elsewhere, expect single-tenant / working-renter base with shorter leases.
- Market conditions: 75 active listings in the ZIP; 273 units permitted in Montcalm County in 2024 (5 in 5+ unit buildings).
Forward outlook
- Local home prices are declining (-3.0%/yr); year-one equity from $311 of loan paydown is wiped out by about $1k of value loss. Plan a longer hold.
- Montcalm County population projected at -17% by 2050 — secular population decline; favor cash flow + early exit over multi-decade hold.
Negotiation context
- It's been on market 106 days — a 9% lower offer ($41k) is reasonable based on typical stale-listing flexibility.
- 7 sale attempts with the ask held roughly flat each time — persistent listings suggest the price (not the market) is what's stuck; bring a comps-based counter.
Risks & watch-outs
- Watch-outs: HOA is 45% of rent.
Questions for the listing agent
- It's been on market 106 days. Have you received any prior offers? Is the seller open to a 9% concession, seller financing, or rate buy-down credit?
- What does the HOA fee cover, when was the last increase, and are there any pending special assessments or reserve-fund shortfalls?
- Why hasn't it sold? Are there any deal-killer items the seller is aware of (foundation, flood, title, zoning, code violations)?
- Is there a deadline driving the sale (1031 exchange, divorce, estate, relocation)? That informs how much negotiation room exists.
- What's the average days-on-market for RENTAL listings here right now (not sales)? A rising rental-DOM trend means longer vacancies and softer asking-rent achievability than the comps imply.
- What's the recent tenant-quality profile in this submarket — average credit score on applications, eviction rate, late-payment / NSF rate, and stable-employment percentage? A property-management company in the area should have these aggregated.
- How much new for-sale + rental construction is in the pipeline within 1–3 miles? Heavy new supply typically softens prices + rents 12–24 months out; constrained supply supports both.
Investment metrics
- 1% rule
- 2.22% ✓
- Cap rate
- 7.09%
- Cash-on-cash
- 2.85%
- DSCR
- 1.13
- GRM
- 3.7
CMA / ARV
- ARV (median comp)
- $264,241
- List price
- $45,000
- Delta
- -82.97%
- Verdict
- UNDERPRICED
- Comps
- 2 within 1.0 mi
Projected returns pro-forma
-3.0% appreciation · 3.0% rent growth · sell at horizon
- IRR
- -11.0%
- Equity multiple
- 0.60×
- Total profit
- $-5,091
- Equity at exit
- $6,710
- IRR
- -0.9%
- Equity multiple
- 0.94×
- Total profit
- $-791
- Equity at exit
- $3,891
Cash invested: $12,600 (down + closing). Projections, not guarantees.
Landlord ↔ Tenant lean methodology
- Overall (STATE)
- 62 Landlord-Friendly
- State Michigan
- 62 Landlord-Friendly · EVEN
- County
- — inherits STATE
- City
- — inherits STATE
ZIP-level market 49329
- Home prices YoY
- -15.6%
- Active inventory
- 75
- Price-to-rent
- 3.7×
Monthly cashflow live
- Estimated rent
- $1,001 medium interval (Pro) →
- Mortgage (P&I)
- −$236
- Tax est. 1.5%
- −$56 /mo · $675/yr
- Insurance
- −$19
- HOA
- −$450
- Vacancy / Maint / Mgmt
- −$210
- Net cashflow
- $30
Break-even live
UW: 25.0% down · 7.5% · 30yr · 1.5% tax · 5.0% vac · 8.0% maint · 8.0% mgmt
Financing live
Cash to close
- Down payment
- $11,250
- Closing costs
- $1,350
- Reserves months
- —
- Total cash needed
- —
Loan-product check · same deal, 3 products live
Conventional
25% down · 7.5% · 30yr
- Down + closing
- —
- Monthly P&I
- —
- Monthly cashflow
- —
- DSCR
- —
- Eligible?
- —
Personal DTI + credit; lowest rate.
DSCR
20% down · 8.5% · 30yr
- Down + closing
- —
- Monthly P&I
- —
- Monthly cashflow
- —
- DSCR
- —
- Eligible?
- —
No personal income docs; deal must DSCR.
Hard money
10% down · 12.0% · 12mo
- Down + closing
- —
- Monthly P&I
- —
- Monthly cashflow
- —
- DSCR
- —
- Eligible?
- —
Short-term bridge; refi at stabilization.
HOA detail
- Monthly dues
- $450 · $5,400/yr
Listing history 26 events
-
2026-06-09days on market $45,000 Active 106 DOM
-
2026-06-08days on market $45,000 Active 105 DOM
-
2026-06-07days on market $45,000 Active 104 DOM
-
2026-06-07days on market $45,000 Active 103 DOM
-
2026-06-04days on market $45,000 Active 100 DOM
-
2026-06-02days on market $45,000 Active 99 DOM
-
2026-06-01days on market $45,000 Active 98 DOM
-
2026-05-31days on market $45,000 Active 97 DOM
-
2026-05-31days on market $45,000 Active 96 DOM
-
2026-02-23$45,000 Active 643-char remark
Show marketing remark (643 chars)
Welcome to this spacious 3-bedroom, 2-bathroom manufactured home in Howard City! New Roof!!! Featuring an open floor plan, the home offers a large living room that flows into a bright kitchen with ample cabinetry and counter space. The primary suite includes a private full bath, while two additional bedrooms and another full bathroom provide plenty of extra space. Set on a quiet lot, this property offers a comfortable lifestyle with easy access to local amenities and US-131 for commuting. With modern updates and room to personalize, this home is move-in ready and waiting for its next owner! Owner is licensed realtor in the state of MI.
-
2026-02-23$45,000 Active
Show marketing remark (643 chars)
Welcome to this spacious 3-bedroom, 2-bathroom manufactured home in Howard City! New Roof!!! Featuring an open floor plan, the home offers a large living room that flows into a bright kitchen with ample cabinetry and counter space. The primary suite includes a private full bath, while two additional bedrooms and another full bathroom provide plenty of extra space. Set on a quiet lot, this property offers a comfortable lifestyle with easy access to local amenities and US-131 for commuting. With modern updates and room to personalize, this home is move-in ready and waiting for its next owner! Owner is licensed realtor in the state of MI.
-
2026-02-21historical
-
2026-02-20historical
-
2025-12-02$48,900 Active
-
2025-12-02$48,900 Active
-
2025-12-02historical
-
2025-12-01historical
-
2025-11-21price $48,900
-
2025-11-20price $48,900
-
2025-11-20price $48,900
-
2025-09-22$49,900 Active
-
2025-09-22$49,900 Active
-
2025-08-04soldstatus $360,000
-
2021-09-24soldstatus $215,000
-
2014-04-03soldstatus $45,000
ⓘ Source: listings_history table (triggers on properties + properties_extension) + one-shot
backfill from property_details.listing_events for pre-trigger history.
Climate risk First Street
- Flood 1/10 Low FEMA zone X · 0% chance over 30 yrs
- Wildfire 1/10 Low
- Heat 2/10 Low 7 d/yr ≥96°F today · 14 d/yr by 30 yrs out
- Wind 1/10 Low
- Air quality 2/10 Low 1 unhealthy d/yr today · 1 by 30 yrs out
Nearby sold comps map
Loading sold comps map…
Walkable amenities ~0.75 mi
Loading nearby amenities…
Taxation est. · year 1
- Rental income
- $12,015
- − Mortgage interest
- −$2,521
- − Property taxes
- −$675
- − Insurance
- −$225
- − Repairs & maintenance
- −$961
- − Management
- −$961
- − HOA
- −$5,400
- − Depreciation
- −$1,309
- Taxable loss
- −$38
- Est. tax savings @ 24.0%
- +$9
- After-tax cash flow
- $369/yr
For passive investors: Depreciation is non-cash, so a rental often shows a tax loss while cash-flowing — sheltering income. Rental losses are passive: they offset passive income freely, and up to $25,000/yr can offset ordinary (W-2) income if you actively participate and your MAGI is under $100k (phasing out to $0 by $150k); unused losses carry forward. On sale, claimed depreciation is recaptured at up to 25%, and gains may owe capital-gains tax (a 1031 exchange can defer both). Figures are a year-1 estimate at your 24.0% rate — not tax advice; consult a CPA.
Schools (NCES district)
- District
- Tri County Area Schools
- NCES district ID
- 2633930
- Math proficiency
- 26% ▼ -2.00%
- Reading proficiency
- 42% ▲ 2.00%
- Median HH income
- $48,772
- Composite
- 29.34/100
- National rank
- #6542
- State rank
- #302 of 540 in MI
Livability — Reynolds
No livability data for this city. (Only ~50 U.S. cities are tracked.)
Census & demographics
- Population (ZIP)
- 9,030
Population outlook (Montcalm County) Hauer SSP2
- Today (2025)
- 61,011 people
- By 2030
- 59,467 · -2.5%
- By 2040
- 55,427 · -9.2%
- By 2050
- 50,517 · -17.2%
- By 2075
- 38,731 · -36.5%
- By 2100
- 26,770 · -56.1%
Race, ethnicity, and origin ACS 2023
- Neighborhood character
- Predominantly White (87%)
- Race & ethnicity
- White 87% Black 6% Two or more races 5% Hispanic / Latino 2%
- Common ancestry
- Iranian 8% Romanian 3% Lithuanian 2%
- Foreign-born
- 5% · Canada
- Languages at home
- 99% English-only · Spanish 1%
Political lean MEDSL · Montcalm
- 2024 margin
- Solid R (+39.0) · D 29.8% · R 68.7% · Other 1.5%
- 2008→2024 swing
- -38.7pp toward R · 2008: -0.3pp · 2024: -39.0pp
- All cycles
- 2024: R+39.0 2020: R+37.7 2016: R+34.0 2012: R+8.6 2008: R+0.3
Not yet ingested
- Civics
- —
Market trends
- HPI YoY
- ▼ -56.56%
- Current HPI
- 305.7702
- Rent YoY
- —
- Metro
- —
- State GDP YoY
- ▲ 1.37%
- F500 in state
- 28
Industry mix (Fortune 500 HQ in MI)
| Industry | F500 HQs | Revenue |
|---|---|---|
| Automotive Parts | 3 | $48B |
|
||
| Automotive | 2 | $372B |
|
||
| Chemicals | 1 | $45B |
|
||
| Automotive Retail | 1 | $29B |
|
||
| Healthcare / Medical Devices | 1 | $23B |
|
||
| Automotive Technology | 1 | $20B |
|
||
Price history
+0.0% since first listed17 events — show timeline
- 2026-02-23 Listed $45,000 REALCOMP
- 2026-02-23 Listed $45,000 SW Michigan MLS
- 2026-02-23 Listed $45,000 MiRealSource-MiMLS
- 2026-02-21 Listing Removed — MiRealSource-MiMLS
- 2026-02-20 Listing Removed — REALCOMP
- 2025-12-02 Listing Removed — MiRealSource-MiMLS
- 2025-12-02 Listed $48,900 REALCOMP
- 2025-12-02 Listed $48,900 MiRealSource-MiMLS
- 2025-12-01 Listing Removed — REALCOMP
- 2025-11-21 Price Changed $48,900 MiRealSource-MiMLS
- 2025-11-20 Price Changed $48,900 REALCOMP
- 2025-11-20 Price Changed $48,900 SW Michigan MLS
- 2025-09-22 Listed $49,900 REALCOMP
- 2025-09-22 Listed $49,900 MiRealSource-MiMLS
- 2025-08-04 Sold (Public Records) $360,000 Public Records
- 2021-09-24 Sold (Public Records) $215,000 Public Records
- 2014-04-03 Sold (Public Records) $45,000 Public Records
Cash-flow waterfall
monthlySold comps — $/sqft
last 12 mo · ≤1 miLoading sold comps…