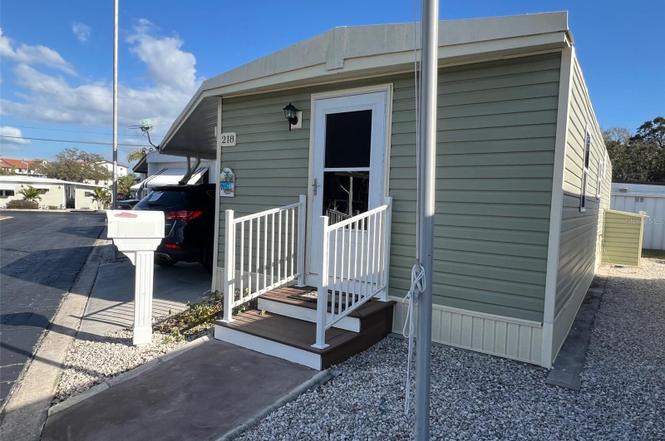
8300 Seminole Blvd #218 · Seminole, FL
Flood risk 1/10 · Minimal
- FEMA flood zone
- X (unshaded)
- Chance of flooding over 30 yrs
- 0.0%
- Est. flood insurance / yr
- $507 – $1,088
Fire risk 1/10 · Minimal
- Est. fire insurance / yr
- $947 – $1,759
Heat risk 10/10 · Severe
- Hot days now (above 107°F)
- 7 days/yr
- Hot days in 30 yrs
- 25 days/yr
Wind risk 10/10 · Severe
- Chance of severe wind over 30 yrs
- 99.0%
Air-quality risk 3/10 · Minor
- Unhealthy air days now
- 2 days/yr
- Unhealthy air days in 30 yrs
- 2 days/yr
Risk factors via First Street. Map © Google.
Why this score? — see what drove the C+ grade
The composite is a weighted blend of 9 inputs, each scored 0–100. Each bar is that input's sub-score; the figure is the points it added to the 100-point composite (weight × sub-score).
- Cash flow +30.0/30.0
- 1% rule +10.0/10.0
- DSCR +10.0/10.0
- Livability +4.4/5.0
- Schools +4.3/10.0
- Rent growth +2.5/5.0
- Condition / age +2.5/5.0
- ARV discount +0.0/15.0
- Appreciation +0.0/10.0
$72,000
🖨 Deal sheet 📄 Offer letter ✓ Due diligence
Listing remarks MLS
Great buy for this one bedroom mobile home in the desirable Seminole 55 Plus community. Low fee of $92.00 a month
Key facts
- Open floor plan
- Shuffleboard courts
- Smooth drywall
Tags
Property features AI
Finance
- Other: Furnished; Directions: Seminole Blvd. south and just before Park Blvd. Community on west side. Enter and bear left past clubhouse; Lot 218 on left.
- Financial info: Total monthly fees $145 (total annual $1,740); Lease restrictions apply
- HOA & community: Has HOA (monthly fee $145); Association requires approval; Association amenities: clubhouse, fitness center, shuffleboard court; Association fee includes escrow reserves, grounds maintenance, sewer, trash, water; Senior community; Pets not allowed; Golf carts allowed; Buyer approval required
Exterior
- Parking: Carport with 2 spaces
- Utilities: Public water; Public sewer; Cable available and connected; Electricity available and connected; Water available and connected; Sewer available and connected
- Home design: Manufactured home (single wide); One story; Faces north; Residential property
- Construction: Vinyl siding; Built-up roof; Crawlspace foundation; Built in (year not provided)
- Exterior features: Storage shed; Paved lot; Asphalt road
Interior
- Kitchen: Dishwasher; Microwave; Range; Refrigerator; Eat-in kitchen
- Bedrooms: 1 bedroom
- Bathrooms: 1 full bathroom
- Heating & cooling: Central heating; Central air
- Interior features: Ceiling fans; Eat-in kitchen; Open floorplan; Thermostat; Window treatments; Double pane windows
- Laundry & utility: Washer; Dryer; Electric water heater; Water softener; Other laundry features
Neighborhood map
What this means for you Summary
Snapshot
- This is a 1-bed/1.0-bath manufactured listed at $72k.
Deal economics
- At list price, monthly cash flow is $474 ($6k/yr) — positive.
- The deal already cash-flows at list — no discount required.
- Meets the 1% rule at list price ($1k rent vs $72k).
- Recommended offer: $66k (9.0% below list) — sets the bar for market timing.
- Cap rate 14.2% vs local median 3.8% in Seminole — top-decile yield for the area; either an underpriced asset or a hidden risk that comps aren't pricing in. Stress-test before assuming the spread holds.
Location & tenants
- Location reads 88/100 on livability (#5 in FL, #174 nationally) — a professional / high-income tenant draw. Strengths: commute A+, housing A+, health & safety A+.
- Pinellas (suburban): math 51% / reading 51% proficiency, ranked #31 of 73 in FL (top 42%) — acceptable for families but not a draw, mixed tenant base, ~2y average lease.
- Market conditions: Rents flat; 207 active listings in the ZIP; 9 comparable units currently listed for rent nearby; rentals leasing fast (median 5d on market — plan ~1-2 weeks tenant-placement turnaround); 2,676 units permitted in Pinellas County in 2024 (1,422 in 5+ unit buildings).
Forward outlook
- Local home prices are declining (-3.0%/yr); year-one equity from $498 of loan paydown is wiped out by about $2k of value loss. Plan a longer hold.
- Pinellas County population projected at +14% by 2050 — modest demand growth; plan on rents tracking national, not racing it.
- At projected returns (-3.0% appreciation + 0.1% rent growth), your $20k cash investment doubles in ~5 years — after that, you're playing with house money.
Negotiation context
- It's been on market 119 days — a 9% lower offer ($66k) is reasonable based on typical stale-listing flexibility.
- 2 sale attempts since 14y ago; this cycle's ask has dropped $8k (10%) from the opening price — seller is motivated, your offer sets the floor, not the list.
- Current owner paid $15k; list at $72k implies a 380% gain — meaningful room to come down on a strong offer.
Risks & watch-outs
- Climate carrying-cost: severe wind risk, 99% chance of damaging wind over 30y; extreme-heat days projected 7→25/yr by 2055 (HVAC capex compounding) — expect insurance premiums to compound above CPI over the hold.
Questions for the listing agent
- It's been on market 119 days. Have you received any prior offers? Is the seller open to a 9% concession, seller financing, or rate buy-down credit?
- What does the HOA fee cover, when was the last increase, and are there any pending special assessments or reserve-fund shortfalls?
- Why hasn't it sold? Are there any deal-killer items the seller is aware of (foundation, flood, title, zoning, code violations)?
- Is there a deadline driving the sale (1031 exchange, divorce, estate, relocation)? That informs how much negotiation room exists.
- Schools are B-rated — typically a magnet for longer-tenancy family renters. What's the average tenant stay here, and is there a school-zone premium baked into asking?
- What's the average days-on-market for RENTAL listings here right now (not sales)? A rising rental-DOM trend means longer vacancies and softer asking-rent achievability than the comps imply.
- What's the recent tenant-quality profile in this submarket — average credit score on applications, eviction rate, late-payment / NSF rate, and stable-employment percentage? A property-management company in the area should have these aggregated.
- How much new for-sale + rental construction is in the pipeline within 1–3 miles? Heavy new supply typically softens prices + rents 12–24 months out; constrained supply supports both.
Investment metrics
- 1% rule
- 1.96% ✓
- Cap rate
- 14.20%
- Cash-on-cash
- 28.24%
- DSCR
- 2.26
- GRM
- 4.2
CMA / ARV
- ARV (on-the-fly)
- $57,680
- Comps found
- 2
Show comp detail 2 sales within ~0.75 mi
| Address | Dist | Beds/Ba | Sqft | Sold | Price | $/sf | Match |
|---|---|---|---|---|---|---|---|
| 434 Denice Dr #434 | 0.28mi | 2/1.0 (+1) | 555 (-1%) | 9mo | $57,000 | $103 | 73 |
| 8300 Seminole Blvd #345 | 0.00mi | 2/1.0 (+1) | 624 (+11%) | 14mo | $60,000 | $96 | 64 |
Match score weights: distance 35% · size 25% · config 20% · recency 20%. Top-matched comps best support the ARV.
Projected returns pro-forma
-3.0% appreciation · 0.1% rent growth · sell at horizon
- IRR
- 18.7%
- Equity multiple
- 1.73×
- Total profit
- $14,650
- Equity at exit
- $10,735
- IRR
- 24.7%
- Equity multiple
- 2.81×
- Total profit
- $36,589
- Equity at exit
- $6,225
Cash invested: $20,160 (down + closing). Projections, not guarantees.
Landlord ↔ Tenant lean methodology
- Overall (STATE)
- 87 Strongly Landlord-Friendly
- State Florida
- 87 Strongly Landlord-Friendly · R+3
- County
- — inherits STATE
- City
- — inherits STATE
ZIP-level market 33772
- Rents YoY
- 0.1%
- Active inventory
- 207
- Price-to-rent
- 4.2×
Monthly cashflow live
- Estimated rent
- $1,414 high interval (Pro) →
- Mortgage (P&I)
- −$378
- Tax est. 1.5%
- −$90 /mo · $1,080/yr
- Insurance
- −$30
- HOA
- −$145
- Vacancy / Maint / Mgmt
- −$297
- Net cashflow
- $474
Break-even live
UW: 25.0% down · 7.5% · 30yr · 1.5% tax · 5.0% vac · 8.0% maint · 8.0% mgmt
Financing live
Cash to close
- Down payment
- $18,000
- Closing costs
- $2,160
- Reserves months
- —
- Total cash needed
- —
Loan-product check · same deal, 3 products live
Conventional
25% down · 7.5% · 30yr
- Down + closing
- —
- Monthly P&I
- —
- Monthly cashflow
- —
- DSCR
- —
- Eligible?
- —
Personal DTI + credit; lowest rate.
DSCR
20% down · 8.5% · 30yr
- Down + closing
- —
- Monthly P&I
- —
- Monthly cashflow
- —
- DSCR
- —
- Eligible?
- —
No personal income docs; deal must DSCR.
Hard money
10% down · 12.0% · 12mo
- Down + closing
- —
- Monthly P&I
- —
- Monthly cashflow
- —
- DSCR
- —
- Eligible?
- —
Short-term bridge; refi at stabilization.
Rent comps 9 comps
| Address | Beds | Baths | Sqft | Rent | $/sqft | DOM | Units | Dist |
|---|---|---|---|---|---|---|---|---|
| 8425 112th St #104 Seminole, FL | 1.0 | 1.0 | 608 | $1,300 | $2.14 | 4d | 1 | 0.26mi |
| 8555 112th St #206 Seminole, FL | 1.0 | 1.0 | 638 | $1,250 | $1.96 | 4d | 1 | 0.31mi |
| 8450 112th St #103 Seminole, FL | 1.0 | 1.0 | 608 | $1,250 | $2.06 | 24d | 1 | 0.32mi |
| 10764 70th Ave Seminole, FL | 1.0–2.0 | 1.0–2.0 | 828 | $1,500 | $1.81 | 4d | 2 | 0.89mi |
| 10405 Addison Way Seminole, FL | 1.0–3.0 | 1.0–2.0 | 1133 | $1,807 | $1.59 | 2d | 18 | 1.02mi |
| 12100 Park Blvd Seminole, FL | 1.0–3.0 | 1.0–2.5 | 921 | $1,296 | $1.41 | 2d | 40 | 1.13mi |
| 10546 106th Ave N Unit a Largo, FL | 1.0 | 1.0 | 624 | $1,223 | $1.96 | 24d | 1 | 1.45mi |
| 10464 106th Ave N Unit 2 Largo, FL | 1.0 | 1.0 | 500 | $1,200 | $2.40 | 24d | 1 | 1.47mi |
| 10464 106th Ave N Unit 2 Largo, FL | 1.0 | 1.0 | 500 | $1,250 | $2.50 | 14d | 1 | 1.47mi |
HOA detail
- Monthly dues
- $145 · $1,740/yr
Listing history 17 events
-
2026-06-18days on market $72,000 Active 119 DOM
-
2026-06-17days on market $72,000 Active 118 DOM
-
2026-06-16days on market $72,000 Active 117 DOM
-
2026-06-15days on market $72,000 Active 116 DOM
-
2026-06-13days on market $72,000 Active 114 DOM
-
2026-06-09days on market $72,000 Active 110 DOM
-
2026-06-08days on market $72,000 Active 109 DOM
-
2026-06-07days on market $72,000 Active 108 DOM
-
2026-06-04days on market $72,000 Active 105 DOM
-
2026-06-03days on market $72,000 Active 104 DOM
-
2026-06-01days on market $72,000 Active 102 DOM
-
2026-05-31days on market $72,000 Active 101 DOM
-
2026-04-30price $72,000
-
2026-02-20$80,000 Active
-
2012-12-03soldstatus $15,000 113-char remark
Show marketing remark (113 chars)
Great buy for this one bedroom mobile home in the desirable Seminole 55 Plus community. Low fee of $92.00 a month
-
2012-10-16$15,000 113-char remark
Show marketing remark (113 chars)
Great buy for this one bedroom mobile home in the desirable Seminole 55 Plus community. Low fee of $92.00 a month
-
1997-05-14soldstatus $10,000
ⓘ Source: listings_history table (triggers on properties + properties_extension) + one-shot
backfill from property_details.listing_events for pre-trigger history.
Climate risk First Street
- Flood 1/10 Low FEMA zone X (unshaded) · 0% chance over 30 yrs
- Wildfire 1/10 Low
- Heat 10/10 Extreme 7 d/yr ≥107°F today · 25 d/yr by 30 yrs out
- Wind 10/10 Extreme 99% chance of damaging wind over 30 yrs
- Air quality 3/10 Moderate 2 unhealthy d/yr today · 2 by 30 yrs out
Nearby sold comps map
Loading sold comps map…
Walkable amenities ~0.75 mi
Loading nearby amenities…
Taxation est. · year 1
- Rental income
- $16,967
- − Mortgage interest
- −$4,033
- − Property taxes
- −$1,080
- − Insurance
- −$360
- − Repairs & maintenance
- −$1,357
- − Management
- −$1,357
- − HOA
- −$1,740
- − Depreciation
- −$2,095
- Taxable income
- $4,945
- Est. tax owed @ 24.0%
- −$1,187
- After-tax cash flow
- $4,506/yr
For passive investors: Depreciation is non-cash, so a rental often shows a tax loss while cash-flowing — sheltering income. Rental losses are passive: they offset passive income freely, and up to $25,000/yr can offset ordinary (W-2) income if you actively participate and your MAGI is under $100k (phasing out to $0 by $150k); unused losses carry forward. On sale, claimed depreciation is recaptured at up to 25%, and gains may owe capital-gains tax (a 1031 exchange can defer both). Figures are a year-1 estimate at your 24.0% rate — not tax advice; consult a CPA.
Schools (NCES district)
- District
- Pinellas
- NCES district ID
- 1201560
- Math proficiency
- 51% ▼ -5.00%
- Reading proficiency
- 51% ▼ -3.00%
- Median HH income
- $46,270
- Composite
- 43.27/100
- National rank
- #3046
- State rank
- #31 of 73 in FL
Livability — Seminole
- Score
- 88/100
- State rank
- #5
- US rank
- #174
Category grades
Schools grade is shown separately in the Schools card above.
Census & demographics
- County
- Pinellas County · 939,478 people
- City population
- 42,315
- Metro
- Tampa-St. Petersburg-Clearwater, FL
- Population (ZIP)
- 23,733
- Household income
- $73,586
- Rent vs Own
- Severe rent burden
- 720.0
Population outlook (Pinellas County) Hauer SSP2
- Today (2025)
- 1,027,532 people
- By 2030
- 1,063,586 · +3.5%
- By 2040
- 1,125,020 · +9.5%
- By 2050
- 1,168,637 · +13.7%
- By 2075
- 1,265,188 · +23.1%
- By 2100
- 1,260,357 · +22.7%
Race, ethnicity, and origin ACS 2023
- Neighborhood character
- Predominantly White (84%)
- Race & ethnicity
- White 84% Hispanic / Latino 8% Two or more races 7% Asian 3% Black 2%
- Hispanic origin (detail)
- Puerto Rican 2%
- Common ancestry
- Romanian 5% Lithuanian 3% Slovak 3%
- Foreign-born
- 10% · Canada, Vietnam, Jamaica
- Languages at home
- 89% English-only · Spanish 5% Other Indo-European 1% Russian/Polish/Slavic 1%
Political lean MEDSL · Pinellas
- 2024 margin
- Lean R (+5.2) · D 46.9% · R 52.1%
- 2008→2024 swing
- -13.5pp toward R · 2008: 8.3pp · 2024: -5.2pp
- All cycles
- 2024: R+5.2 2020: D+0.2 2016: R+1.1 2012: D+5.6 2008: D+8.3
Not yet ingested
- Civics
- —
Market trends
- HPI YoY
- ▼ -485.84%
- Current HPI
- 315.303
- Rent YoY
- ▲ 0.10%
- Metro
- Tampa-St. Petersburg-Clearwater, FL
- State GDP YoY
- ▲ 3.28%
- F500 in state
- 36
Industry mix (Fortune 500 HQ in FL)
| Industry | F500 HQs | Revenue |
|---|---|---|
| Industrial Technology | 2 | $29B |
|
||
| Insurance | 2 | $17B |
|
||
| Retail | 1 | $60B |
|
||
| Technology Distribution | 1 | $58B |
|
||
| Homebuilding | 1 | $35B |
|
||
| Technology Manufacturing | 1 | $35B |
|
||
Price history
+620.0% since first listed5 events — show timeline
- 2026-04-30 Price Changed $72,000 Stellar MLS as Distributed by MLS Grid
- 2026-02-20 Listed $80,000 Stellar MLS as Distributed by MLS Grid
- 2012-12-03 Sold (MLS) $15,000 Stellar MLS as Distributed by MLS Grid
- 2012-10-16 Listed $15,000 Stellar MLS as Distributed by MLS Grid
- 1997-05-14 Sold (Public Records) $10,000 Public Records
Property tax history
-11.7%/yrLatest (2025): $107 · +21.9% YoY. Source: county tax records.
Cash-flow waterfall
monthlySold comps — $/sqft
last 12 mo · ≤1 miLoading sold comps…