3635 Antelope Rd Spc 19 · White City, OR
Flood risk 1/10 · Minimal
- FEMA flood zone
- X (unshaded)
- Chance of flooding over 30 yrs
- 0.0%
- Est. flood insurance / yr
- $507 – $1,088
Fire risk 8/10 · Major
- Est. fire insurance / yr
- $498 – $926
Heat risk 6/10 · Moderate
- Hot days now (above 98°F)
- 7 days/yr
- Hot days in 30 yrs
- 15 days/yr
Wind risk 1/10 · Minimal
- Chance of severe wind over 30 yrs
- —
Air-quality risk 10/10 · Severe
- Unhealthy air days now
- 28 days/yr
- Unhealthy air days in 30 yrs
- 30 days/yr
Risk factors via First Street. Map © Google.
Why this score? — see what drove the B- grade
The composite is a weighted blend of 9 inputs, each scored 0–100. Each bar is that input's sub-score; the figure is the points it added to the 100-point composite (weight × sub-score).
- Cash flow +30.0/30.0
- 1% rule +10.0/10.0
- DSCR +10.0/10.0
- ARV discount +7.5/15.0
- Livability +3.4/5.0
- Schools +3.3/10.0
- Rent growth +2.5/5.0
- Condition / age +2.5/5.0
- Appreciation +0.0/10.0
$85,000
🖨 Deal sheet 📄 Offer letter ✓ Due diligence
Listing remarks MLS
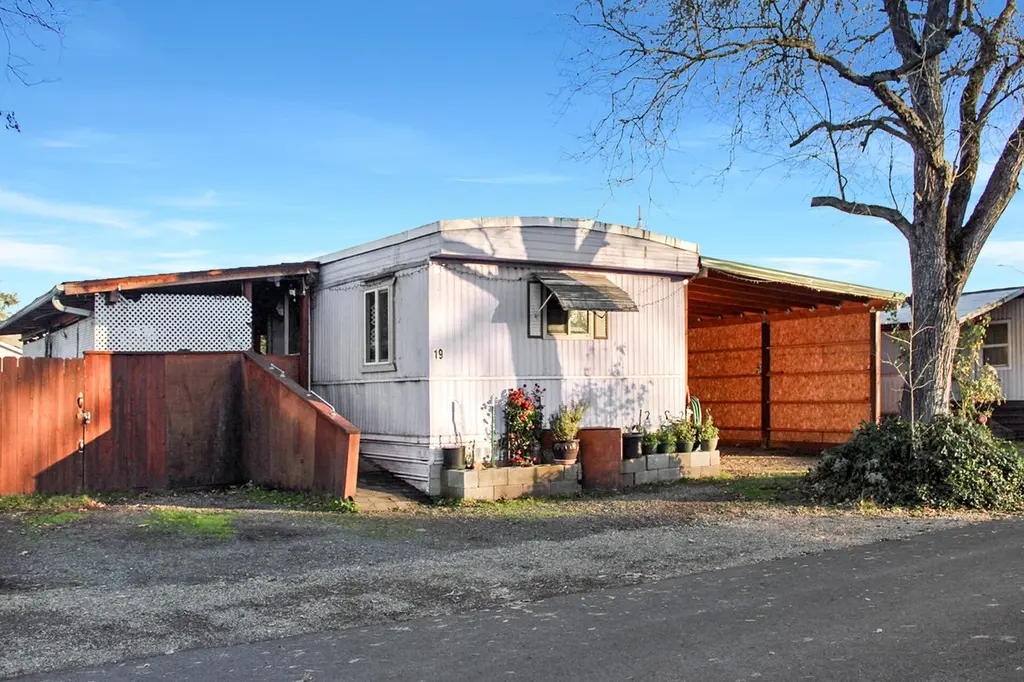
1975 Single wide manufactured home located in the Antelope Acres manufactured home park. Home has received documented weatherization and energy-efficiency improvements, including upgraded insulation, air sealing, ventilation improvements, and installation of a ductless mini-split heat pump. Interior reflects a classic manufactured home style with a functional layout and opportunity for cosmetic updates. Property includes a detached bonus room offering flexible use such as office or hobby space. Property also has been gardened and has many fruit trees planted. Large Carport with shelving provides the extra space for parking and storage. Manufactured home is located in a park and is subject to space rent and park approval.
Key facts
- Fruit trees planted
- Large carport
- Upgraded insulation
Tags
Neighborhood map
What this means for you Summary
Snapshot
- This is a 2-bed/1.0-bath land listed at $85k.
Deal economics
- At list price, monthly cash flow is $791 ($9k/yr) — positive.
- The deal already cash-flows at list — no discount required.
- Meets the 1% rule at list price ($2k rent vs $85k).
- Recommended offer: $75k (12.0% below list) — sets the bar for market timing.
- Cap rate 17.5% vs local median 3.4% in White City — top-decile yield for the area; either an underpriced asset or a hidden risk that comps aren't pricing in. Stress-test before assuming the spread holds.
Location & tenants
- Location reads 67/100 on livability (#182 in OR) — a middle-class / working-renter tenant base. Strengths: housing A+, health & safety A+, cost of living A; Watch: employment C-, schools F, crime D-.
- Eagle Point SD 9 (suburban): math 26% / reading 45% proficiency, ranked #134 of 183 in OR (top 73%) — families likely to look elsewhere, expect single-tenant / working-renter base with shorter leases.
- Market conditions: 103 active listings in the ZIP; 2 comparable units currently listed for rent nearby; 904 units permitted in Jackson County in 2024 (212 in 5+ unit buildings).
Forward outlook
- Local home prices are declining (-3.0%/yr); year-one equity from $588 of loan paydown is wiped out by about $3k of value loss. Plan a longer hold.
- Jackson County population projected at +17% by 2050 — long-run rental-demand tailwind backs the buy-and-hold thesis.
- At projected returns (-3.0% appreciation + 3.0% rent growth), your $24k cash investment doubles in ~3 years — after that, you're playing with house money.
Negotiation context
- It's been on market 165 days — a 12% lower offer ($75k) is reasonable based on typical stale-listing flexibility.
Risks & watch-outs
- Climate carrying-cost: severe wildfire risk; extreme-heat days projected 7→15/yr by 2055 (HVAC capex compounding) — expect insurance premiums to compound above CPI over the hold.
Questions for the listing agent
- It's been on market 165 days. Have you received any prior offers? Is the seller open to a 12% concession, seller financing, or rate buy-down credit?
- Built in 1975 — when were the roof, HVAC, electrical panel, plumbing, and water heater last replaced?
- Why hasn't it sold? Are there any deal-killer items the seller is aware of (foundation, flood, title, zoning, code violations)?
- Is there a deadline driving the sale (1031 exchange, divorce, estate, relocation)? That informs how much negotiation room exists.
- Schools are F-rated, which usually means shorter tenancies and higher turnover. Who's the typical renter profile here, and what's been the actual vacancy rate?
- Crime grade is D in this area — have there been break-ins, vandalism, or insurance claims at this property in the last 3 years? What carrier currently insures it and at what premium?
- What's the average days-on-market for RENTAL listings here right now (not sales)? A rising rental-DOM trend means longer vacancies and softer asking-rent achievability than the comps imply.
- What's the recent tenant-quality profile in this submarket — average credit score on applications, eviction rate, late-payment / NSF rate, and stable-employment percentage? A property-management company in the area should have these aggregated.
- How much new for-sale + rental construction is in the pipeline within 1–3 miles? Heavy new supply typically softens prices + rents 12–24 months out; constrained supply supports both.
Investment metrics
- 1% rule
- 1.92% ✓
- Cap rate
- 17.46%
- Cash-on-cash
- 39.89%
- DSCR
- 2.78
- GRM
- 4.3
CMA / ARV
- ARV (median comp)
- $48,763
- List price
- $85,000
- Delta
- 74.31%
- Verdict
- OVERPRICED
- Comps
- 7 within 1.0 mi
Projected returns pro-forma
-3.0% appreciation · 3.0% rent growth · sell at horizon
- IRR
- 36.2%
- Equity multiple
- 2.54×
- Total profit
- $36,588
- Equity at exit
- $12,674
- IRR
- 42.9%
- Equity multiple
- 5.06×
- Total profit
- $96,622
- Equity at exit
- $7,349
Cash invested: $23,800 (down + closing). Projections, not guarantees.
Landlord ↔ Tenant lean methodology
- Overall (STATE)
- 28 Tenant-Leaning
- State Oregon
- 28 Tenant-Leaning · D+6
- County
- — inherits STATE
- City
- — inherits STATE
ZIP-level market 97503
- Home prices YoY
- -28.5%
- Active inventory
- 103
- Price-to-rent
- 4.3×
Monthly cashflow live
- Estimated rent
- $1,631 medium interval (Pro) →
- Mortgage (P&I)
- −$446
- Tax from tax record
- −$16 /mo · $189/yr
- Insurance
- −$35
- HOA
- −$0
- Vacancy / Maint / Mgmt
- −$342
- Net cashflow
- $791
Break-even live
UW: 25.0% down · 7.5% · 30yr · 1.5% tax · 5.0% vac · 8.0% maint · 8.0% mgmt
Financing live
Cash to close
- Down payment
- $21,250
- Closing costs
- $2,550
- Reserves months
- —
- Total cash needed
- —
Loan-product check · same deal, 3 products live
Conventional
25% down · 7.5% · 30yr
- Down + closing
- —
- Monthly P&I
- —
- Monthly cashflow
- —
- DSCR
- —
- Eligible?
- —
Personal DTI + credit; lowest rate.
DSCR
20% down · 8.5% · 30yr
- Down + closing
- —
- Monthly P&I
- —
- Monthly cashflow
- —
- DSCR
- —
- Eligible?
- —
No personal income docs; deal must DSCR.
Hard money
10% down · 12.0% · 12mo
- Down + closing
- —
- Monthly P&I
- —
- Monthly cashflow
- —
- DSCR
- —
- Eligible?
- —
Short-term bridge; refi at stabilization.
Rent comps 2 comps
| Address | Beds | Baths | Sqft | Rent | $/sqft | DOM | Units | Dist |
|---|---|---|---|---|---|---|---|---|
| 3407 Sharon Way White City, OR | 2.0 | 2.0 | 922 | $1,595 | $1.73 | 21d | 1 | 0.27mi |
| 7925 Ajax St White City, OR | 3.0 | 1.0 | 1026 | $1,775 | $1.73 | 13d | 1 | 1.01mi |
Listing history 18 events
-
2026-06-19days on market $85,000 Active 165 DOM
-
2026-06-18days on market $85,000 Active 164 DOM
-
2026-06-17days on market $85,000 Active 163 DOM
-
2026-06-16days on market $85,000 Active 162 DOM
-
2026-06-15days on market $85,000 Active 161 DOM
-
2026-06-14days on market $85,000 Active 159 DOM
-
2026-06-13days on market $85,000 Active 158 DOM
-
2026-06-10days on market $85,000 Active 156 DOM
-
2026-06-09days on market $85,000 Active 155 DOM
-
2026-06-08days on market $85,000 Active 154 DOM
-
2026-06-07days on market $85,000 Active 153 DOM
-
2026-06-05days on market $85,000 Active 150 DOM
-
2026-06-03days on market $85,000 Active 149 DOM
-
2026-06-02days on market $85,000 Active 148 DOM
-
2026-06-01days on market $85,000 Active 147 DOM
-
2026-05-31days on market $85,000 Active 146 DOM
-
2026-05-30days on market $85,000 Active 145 DOM
-
2026-01-05$85,000 Active 730-char remark
Show marketing remark (730 chars)
1975 Single wide manufactured home located in the Antelope Acres manufactured home park. Home has received documented weatherization and energy-efficiency improvements, including upgraded insulation, air sealing, ventilation improvements, and installation of a ductless mini-split heat pump. Interior reflects a classic manufactured home style with a functional layout and opportunity for cosmetic updates. Property includes a detached bonus room offering flexible use such as office or hobby space. Property also has been gardened and has many fruit trees planted. Large Carport with shelving provides the extra space for parking and storage. Manufactured home is located in a park and is subject to space rent and park approval.
ⓘ Source: listings_history table (triggers on properties + properties_extension) + one-shot
backfill from property_details.listing_events for pre-trigger history.
Tax reassessment forecast OR · Resets to sale price
- Current annual tax
- $189 · $16/mo
- Projected year-2 tax
- $824 · $69/mo
- Expected delta
- +$636/yr (+$53/mo · 336.8%)
ⓘ Screening estimate from a state-policy table — verify with the county assessor before closing.
Climate risk First Street
- Flood 1/10 Low FEMA zone X (unshaded) · 0% chance over 30 yrs
- Wildfire 8/10 Severe
- Heat 6/10 Major 7 d/yr ≥98°F today · 15 d/yr by 30 yrs out
- Wind 1/10 Low
- Air quality 10/10 Extreme 28 unhealthy d/yr today · 30 by 30 yrs out
Nearby sold comps map
Loading sold comps map…
Walkable amenities ~0.75 mi
Loading nearby amenities…
Taxation est. · year 1
- Rental income
- $19,566
- − Mortgage interest
- −$4,761
- − Property taxes
- −$189
- − Insurance
- −$425
- − Repairs & maintenance
- −$1,565
- − Management
- −$1,565
- − Depreciation
- −$2,473
- Taxable income
- $8,588
- Est. tax owed @ 24.0%
- −$2,061
- After-tax cash flow
- $7,433/yr
For passive investors: Depreciation is non-cash, so a rental often shows a tax loss while cash-flowing — sheltering income. Rental losses are passive: they offset passive income freely, and up to $25,000/yr can offset ordinary (W-2) income if you actively participate and your MAGI is under $100k (phasing out to $0 by $150k); unused losses carry forward. On sale, claimed depreciation is recaptured at up to 25%, and gains may owe capital-gains tax (a 1031 exchange can defer both). Figures are a year-1 estimate at your 24.0% rate — not tax advice; consult a CPA.
Schools (NCES district)
- District
- Eagle Point SD 9
- NCES district ID
- 4104500
- Math proficiency
- 26% ▬ 0.00%
- Reading proficiency
- 45% ▬ 0.00%
- Median HH income
- $47,834
- Composite
- 33.13/100
- National rank
- #10630
- State rank
- #134 of 183 in OR
Livability — White City
- Score
- 67/100
- State rank
- #182
- US rank
- #11152
Category grades
Schools grade is shown separately in the Schools card above.
Census & demographics
- Census place
- White City, OR
- Population (ZIP)
- 14,119
Population outlook (Jackson County) Hauer SSP2
- Today (2025)
- 234,433 people
- By 2030
- 243,834 · +4.0%
- By 2040
- 259,717 · +10.8%
- By 2050
- 273,269 · +16.6%
- By 2075
- 300,624 · +28.2%
- By 2100
- 305,256 · +30.2%
Race, ethnicity, and origin ACS 2023
- Neighborhood character
- Majority White (58%)
- Race & ethnicity
- White 58% Hispanic / Latino 35% Two or more races 11% Asian 1%
- Hispanic origin (detail)
- Mexican 34%
- Common ancestry
- Slovak 4% Italian 3% Portuguese 2%
- Foreign-born
- 11% · Canada
- Languages at home
- 77% English-only · Spanish 22% Tagalog/Filipino 1%
Political lean MEDSL · Jackson
- 2024 margin
- Lean R (+6.4) · D 45.5% · R 51.9% · Other 2.6%
- 2008→2024 swing
- -6.5pp toward R · 2008: 0.1pp · 2024: -6.4pp
- All cycles
- 2024: R+6.4 2020: R+3.5 2016: R+9.2 2012: R+5.0 2008: D+0.1
Not yet ingested
- Civics
- —
Market trends
- HPI YoY
- ▼ -106.87%
- Current HPI
- 268.6998
- Rent YoY
- —
- Metro
- —
- State GDP YoY
- ▲ 2.05%
- F500 in state
- 2
Industry mix (Fortune 500 HQ in OR)
| Industry | F500 HQs | Revenue |
|---|---|---|
| Consumer Goods | 1 | $51B |
|
||
Price history
1 event — show timeline
- 2026-01-05 Listed $85,000 MLSCO
Property tax history
-0.4%/yrLatest (2022): $189 · +7.0% YoY. Source: county tax records.
Cash-flow waterfall
monthlySold comps — $/sqft
last 12 mo · ≤1 miLoading sold comps…