 Fourplex
619 Sandy Ln · Morganfield, KY
Flood risk 1/10 · Minimal
- FEMA flood zone
- X (unshaded)
- Chance of flooding over 30 yrs
- 0.0%
- Est. flood insurance / yr
- $507 – $1,088
Fire risk 1/10 · Minimal
- Est. fire insurance / yr
- $839 – $1,559
Heat risk 5/10 · Moderate
- Hot days now (above 107°F)
- 7 days/yr
- Hot days in 30 yrs
- 20 days/yr
Wind risk 3/10 · Minor
- Chance of severe wind over 30 yrs
- 6.0%
Air-quality risk 2/10 · Minimal
- Unhealthy air days now
- 0 days/yr
- Unhealthy air days in 30 yrs
- 2 days/yr
Risk factors via First Street. Map © Google.
Why this score? — see what drove the D- grade
The composite is a weighted blend of 9 inputs, each scored 0–100. Each bar is that input's sub-score; the figure is the points it added to the 100-point composite (weight × sub-score).
- Cash flow +10.1/30.0
- ARV discount +7.5/15.0
- Appreciation +4.2/10.0
- Livability +3.2/5.0
- 1% rule +3.0/10.0
- DSCR +2.9/10.0
- Rent growth +2.5/5.0
- Schools +2.2/10.0
- Condition / age +2.2/5.0
$374,900
🖨 Deal sheet (PDF) 📄 Offer letter ✓ Due diligence
Multi-family units
County records classify this as Multi-Family (2-4 Unit). Listing-text estimate: 4 units. confirmed
Listing remarks MLS
This investment opportunity is a rare find!!! There are 4 mobile homes with an additional lot already prepared with poured concrete for additional mobile home. This property is also certified as a mobile home park with the state.
Key facts
- Additional lot
- Poured concrete
- Built 1991
Tags
Neighborhood map
What this means for you Summary
Snapshot
- This is a 4 × 2-bed/1-bath units multifamily listed at $375k. Condition is rated fair.
Deal economics
- At list price, monthly cash flow is $-219 ($-3k/yr) — negative. Per door: $-55/mo.
- To cash-flow at today's rent, offer at most $343k (8.5% below list).
- To meet the 1% rule (rent ≥ 1% of price), the offer needs to be $300k (19.9% below list).
- Recommended offer: $300k (19.9% below list) — sets the bar for 1% rule.
Location & tenants
- Location reads 63/100 on livability (#336 in KY) — a middle-class / working-renter tenant base. Strengths: crime A+, cost of living A+, housing A+; Watch: amenities F, commute F, employment D-.
- Union County (rural): math 20% / reading 33% proficiency, ranked #134 of 165 in KY (top 81%) — low school quality limits family demand, transient renter base, plan for 1-2y turnover.
- Zoned schools: Morganfield Elementary School (math 22% / reading 17%, grade F, #572 of 676 statewide, top 88%, 307 students, 71% FRL); Union County Middle School (math 15% / reading 36%, grade F, #181 of 217 statewide, top 84%, 437 students, 58% FRL); Union County High School (math 22% / reading 42%, grade F, #97 of 254 statewide, top 46%, 630 students, 50% FRL).
- Market conditions: 24 active listings in the ZIP.
Forward outlook
- Local home prices are declining (-1.6%/yr); year-one equity from $3k of loan paydown is wiped out by about $6k of value loss. Plan a longer hold.
- Union County population projected at -18% by 2050 — secular population decline; favor cash flow + early exit over multi-decade hold.
Negotiation context
- It's been on market 229 days — a 12% lower offer ($330k) is reasonable based on typical stale-listing flexibility.
Risks & watch-outs
- Climate carrying-cost: extreme-heat days projected 7→20/yr by 2055 (HVAC capex compounding) — expect insurance premiums to compound above CPI over the hold.
Questions for the listing agent
- What do current leases actually rent for vs. the listed asking? Can we see a recent rent roll and the last 12 months of T-12 income?
- It's been on market 229 days. Have you received any prior offers? Is the seller open to a 20% concession, seller financing, or rate buy-down credit?
- Can we see the unit-by-unit rent roll, current vacancy, and any below-market leases? What's the average tenancy length?
- What capital expenditures (roof, boiler, parking lot, exteriors) have been made in the last 5 years, and what's planned in the next 2?
- Have any recent inspections been done? Can we get a copy of the seller's disclosures and any deferred-maintenance estimates?
- Why hasn't it sold? Are there any deal-killer items the seller is aware of (foundation, flood, title, zoning, code violations)?
- Is there a deadline driving the sale (1031 exchange, divorce, estate, relocation)? That informs how much negotiation room exists.
- Schools are F-rated, which usually means shorter tenancies and higher turnover. Who's the typical renter profile here, and what's been the actual vacancy rate?
- The area grade is low — what's the realistic commute time and amenity access for the typical tenant pool here? Any planned neighborhood developments (good or bad) we should know about?
- What's the average days-on-market for RENTAL listings here right now (not sales)? A rising rental-DOM trend means longer vacancies and softer asking-rent achievability than the comps imply.
- What's the recent tenant-quality profile in this submarket — average credit score on applications, eviction rate, late-payment / NSF rate, and stable-employment percentage? A property-management company in the area should have these aggregated.
- How much new apartment / multifamily construction is in the pipeline within 1–3 miles? Heavy new supply (>2% of stock underway) typically softens rents 12–24 months out; light construction supports rent growth.
Investment metrics
- 1% rule
- 0.80% ✗
- Cap rate
- 5.59%
- Cash-on-cash
- -2.51%
- DSCR
- 0.89
- GRM
- 10.4
CMA / ARV
No comps found within radius.
Projected returns pro-forma
-1.56% appreciation · 3.0% rent growth · sell at horizon
- IRR
- -12.0%
- Equity multiple
- 0.51×
- Total profit
- $-51,482
- Equity at exit
- $80,567
- IRR
- -4.7%
- Equity multiple
- 0.60×
- Total profit
- $-41,470
- Equity at exit
- $76,404
Cash invested: $104,972 (down + closing). Projections, not guarantees.
Landlord ↔ Tenant lean methodology
- Overall (STATE)
- 83 Strongly Landlord-Friendly
- State Kentucky
- 83 Strongly Landlord-Friendly · R+16
- County
- — inherits STATE
- City
- — inherits STATE
ZIP-level market 42437
- Home prices YoY
- -0.7%
- Active inventory
- 24
- Price-to-rent
- 41.6×
Monthly cashflow live
- Estimated rent
- $3,002 medium interval (Pro) →
- Mortgage (P&I)
- −$1,966
- Tax est. 1.5%
- −$469 /mo · $5,624/yr
- Insurance
- −$156
- HOA
- −$0
- Vacancy / Maint / Mgmt
- −$630
- Net cashflow
- $-219
Break-even live
Sensitivity live
| Price | -10% $40 | -5% $-90 | +0% $-219 | +5% $-349 | +10% $-478 |
|---|---|---|---|---|---|
| Rent | -10% $-456 | -5% $-338 | +0% $-219 | +5% $-101 | +10% $18 |
| Rate | -1.0pp $-30 | -0.5pp $-124 | base $-219 | +0.5pp $-316 | +1.0pp $-415 |
4-unit breakdown (identical units grouped — click to expand)
| Units | Beds | Baths | Est. rent |
|---|---|---|---|
| 4× units | 2 | 1 | $3,000 |
| #1 | 2 | 1 | $750 |
| #2 | 2 | 1 | $750 |
| #3 | 2 | 1 | $750 |
| #4 | 2 | 1 | $750 |
| Total (4 units) | $3,002 | ||
UW: 25.0% down · 7.5% · 30yr · 1.5% tax · 5.0% vac · 8.0% maint · 8.0% mgmt
Financing live
Cash to close
- Down payment
- $93,725
- Closing costs
- $11,247
- Reserves months
- —
- Total cash needed
- —
Loan-product check · same deal, 3 products live
Conventional
25% down · 7.5% · 30yr
- Down + closing
- —
- Monthly P&I
- —
- Monthly cashflow
- —
- DSCR
- —
- Eligible?
- —
Personal DTI + credit; lowest rate.
DSCR
20% down · 8.5% · 30yr
- Down + closing
- —
- Monthly P&I
- —
- Monthly cashflow
- —
- DSCR
- —
- Eligible?
- —
No personal income docs; deal must DSCR.
Hard money
10% down · 12.0% · 12mo
- Down + closing
- —
- Monthly P&I
- —
- Monthly cashflow
- —
- DSCR
- —
- Eligible?
- —
Short-term bridge; refi at stabilization.
Listing history 19 events
-
2026-06-21days on market $374,900 Active 229 DOM
-
2026-06-21days on market $374,900 Active 228 DOM
-
2026-06-18days on market $374,900 Active 226 DOM
-
2026-06-17days on market $374,900 Active 225 DOM
-
2026-06-16days on market $374,900 Active 224 DOM
-
2026-06-15days on market $374,900 Active 223 DOM
-
2026-06-13days on market $374,900 Active 221 DOM
-
2026-06-12days on market $374,900 Active 220 DOM
-
2026-06-09days on market $374,900 Active 217 DOM
-
2026-06-08days on market $374,900 Active 216 DOM
-
2026-06-07days on market $374,900 Active 215 DOM
-
2026-06-07days on market $374,900 Active 214 DOM
-
2026-06-04days on market $374,900 Active 211 DOM
-
2026-06-02days on market $374,900 Active 210 DOM
-
2026-06-01days on market $374,900 Active 209 DOM
-
2026-05-31days on market $374,900 Active 208 DOM
-
2026-05-31days on market $374,900 Active 207 DOM
-
2026-04-02price $374,900 229-char remark
Show marketing remark (229 chars)
This investment opportunity is a rare find!!! There are 4 mobile homes with an additional lot already prepared with poured concrete for additional mobile home. This property is also certified as a mobile home park with the state.
-
2025-11-04$399,900 Active 229-char remark
Show marketing remark (229 chars)
This investment opportunity is a rare find!!! There are 4 mobile homes with an additional lot already prepared with poured concrete for additional mobile home. This property is also certified as a mobile home park with the state.
ⓘ Source: listings_history table (triggers on properties + properties_extension) + one-shot
backfill from property_details.listing_events for pre-trigger history.
Climate risk First Street
- Flood 1/10 Low FEMA zone X (unshaded) · 0% chance over 30 yrs
- Wildfire 1/10 Low
- Heat 5/10 Major 7 d/yr ≥107°F today · 20 d/yr by 30 yrs out
- Wind 3/10 Moderate 6% chance of damaging wind over 30 yrs
- Air quality 2/10 Low 0 unhealthy d/yr today · 2 by 30 yrs out
Nearby sold comps map
Loading sold comps map…
Walkable amenities ~0.75 mi
Loading nearby amenities…
Taxation est. · year 1
- Rental income
- $36,024
- − Mortgage interest
- −$21,000
- − Property taxes
- −$5,624
- − Insurance
- −$1,874
- − Repairs & maintenance
- −$2,882
- − Management
- −$2,882
- − Depreciation
- −$10,906
- Taxable loss
- −$9,144
- Est. tax savings @ 24.0%
- +$2,195
- After-tax cash flow
- $-437/yr
For passive investors: Depreciation is non-cash, so a rental often shows a tax loss while cash-flowing — sheltering income. Rental losses are passive: they offset passive income freely, and up to $25,000/yr can offset ordinary (W-2) income if you actively participate and your MAGI is under $100k (phasing out to $0 by $150k); unused losses carry forward. On sale, claimed depreciation is recaptured at up to 25%, and gains may owe capital-gains tax (a 1031 exchange can defer both). Figures are a year-1 estimate at your 24.0% rate — not tax advice; consult a CPA.
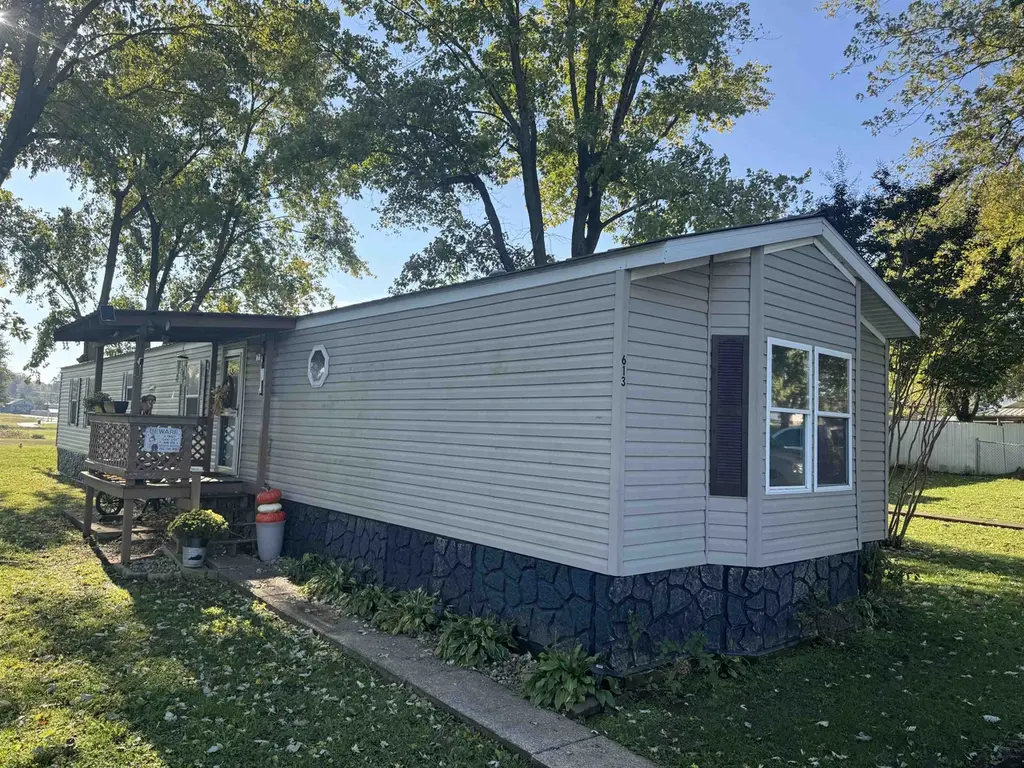
Condition & rehab AI · 5 photos
This multi-family property presents as a moderate rehab opportunity with average condition. Painting and landscaping would significantly enhance its curb appeal and value.
Repairs flagged
- Minor Painting — Siding and exterior walls show signs of weathering
- Minor Landscaping — Overgrown vegetation needs trimming
Value-add opportunities
- Both Painting the exterior — Enhances curb appeal and property value
- Both Landscaping — Improves curb appeal and property value
Renovation cost estimate screening
| Repair item | Severity | Est. cost |
|---|---|---|
| Painting · Siding and exterior walls show signs of weathering | Minor | $500–3,000 |
| Landscaping · Overgrown vegetation needs trimming | Minor | $500–3,000 |
| Total estimated repair cost · 2 items | $1,000–6,000 |
Value-add ROI direction
- Both Painting the exterior — Enhances curb appeal and property value ↑
- Both Landscaping — Improves curb appeal and property value ↑
ⓘ Cost ranges are severity-bucket heuristics (US national rule-of-thumb). Get contractor quotes + a written scope before underwriting a rehab budget.
Schools (NCES district)
- District
- Union County
- NCES district ID
- 2105640
- Math proficiency
- 20% ▼ -20.00%
- Reading proficiency
- 33% ▼ -20.00%
- Median HH income
- $39,776
- Composite
- 22.27/100
- National rank
- #8139
- State rank
- #134 of 165 in KY
Livability — Morganfield
- Score
- 63/100
- State rank
- #336
- US rank
- #15964
Category grades
Schools grade is shown separately in the Schools card above.
Census & demographics
- Census place
- Morganfield, KY
- Population (ZIP)
- 7,250
Population outlook (Union County) Hauer SSP2
- Today (2025)
- 15,038 people
- By 2030
- 14,681 · -2.4%
- By 2040
- 13,607 · -9.5%
- By 2050
- 12,406 · -17.5%
- By 2075
- 9,720 · -35.4%
- By 2100
- 7,841 · -47.9%
Race, ethnicity, and origin ACS 2023
- Neighborhood character
- Predominantly White (84%)
- Race & ethnicity
- White 84% Black 10% Two or more races 3% Hispanic / Latino 2%
- Common ancestry
- Italian 7% Lithuanian 2% Slovak 1%
- Foreign-born
- 1% · Canada
- Languages at home
- 98% English-only · Spanish 1% Other Asian/Pacific 1%
Political lean MEDSL · Union
- 2024 margin
- Solid R (+58.3) · D 20.2% · R 78.5% · Other 1.2%
- 2008→2024 swing
- -53.1pp toward R · 2008: -5.2pp · 2024: -58.3pp
- All cycles
- 2024: R+58.3 2020: R+52.2 2016: R+54.3 2012: R+33.6 2008: R+5.2
Not yet ingested
- Civics
- —
Market trends
- HPI YoY
- ▼ -1.56%
- Current HPI
- 222.4762
- Rent YoY
- —
- Metro
- —
- State GDP YoY
- ▲ 1.81%
- F500 in state
- 4
Industry mix (Fortune 500 HQ in KY)
| Industry | F500 HQs | Revenue |
|---|---|---|
| Healthcare | 1 | $118B |
|
||
| Food / Beverage | 1 | $7B |
|
||
Price history
-6.3% since first listed2 events — show timeline
- 2026-04-02 Price Changed $374,900 GORAMLS
- 2025-11-04 Listed $399,900 GORAMLS
Cash-flow waterfall
monthlySold comps — $/sqft
last 12 mo · ≤1 miLoading sold comps…