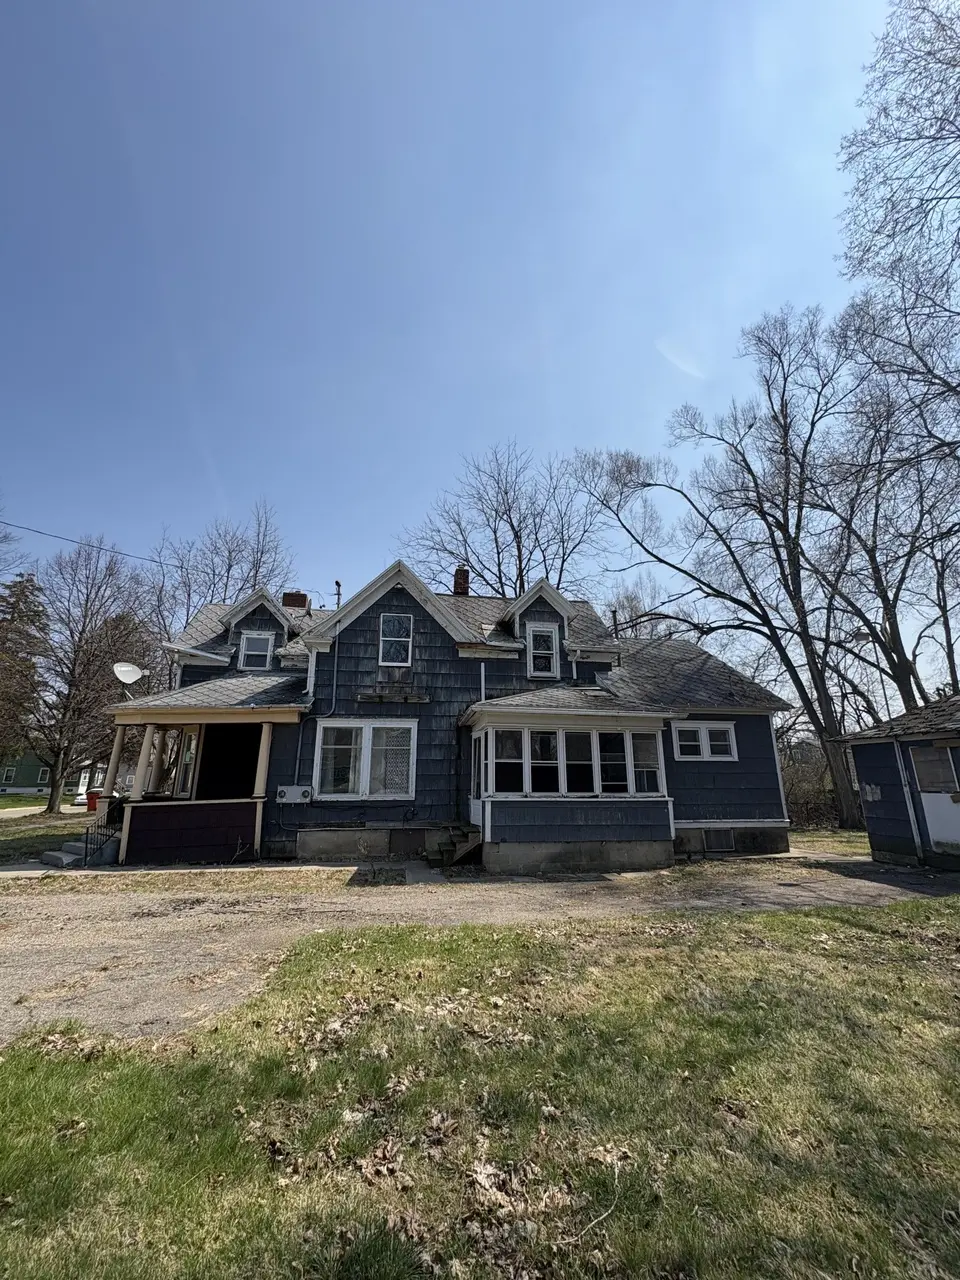
109 Wall St · Jackson, MI
Flood risk 1/10 · Minimal
- FEMA flood zone
- X (unshaded)
- Chance of flooding over 30 yrs
- 0.0%
- Est. flood insurance / yr
- $473 – $860
Fire risk 1/10 · Minimal
- Est. fire insurance / yr
- $784 – $1,456
Heat risk 2/10 · Minimal
- Hot days now (above 98°F)
- 7 days/yr
- Hot days in 30 yrs
- 14 days/yr
Wind risk 2/10 · Minimal
- Chance of severe wind over 30 yrs
- —
Air-quality risk 2/10 · Minimal
- Unhealthy air days now
- 1 days/yr
- Unhealthy air days in 30 yrs
- 1 days/yr
Risk factors via First Street. Map © Google.
Why this score? — see what drove the B- grade
The composite is a weighted blend of 9 inputs, each scored 0–100. Each bar is that input's sub-score; the figure is the points it added to the 100-point composite (weight × sub-score).
- Cash flow +30.0/30.0
- 1% rule +10.0/10.0
- DSCR +10.0/10.0
- ARV discount +7.5/15.0
- Rent growth +4.4/5.0
- Livability +3.7/5.0
- Condition / age +2.5/5.0
- Schools +1.8/10.0
- Appreciation +0.0/10.0
$44,900
🖨 Deal sheet 📄 Offer letter ✓ Due diligence
Listing remarks MLS
Calling all investors! This home has tons of potential and is ready for some TLC! Prime location, minutes to downtown Jackson, Henry Ford Hospital, Campus, andso much more. This home is being sold AS-IS and a licensed real estate agent must be present at all showings.
Key facts
- Henry ford hospital
- Prime location
- 8,276 sq ft lot
Tags
Neighborhood map
What this means for you Summary
Snapshot
- This is a 4-bed/2.0-bath single-family listed at $45k.
Deal economics
- At list price, monthly cash flow is $1k ($12k/yr) — positive.
- The deal already cash-flows at list — no discount required.
- Meets the 1% rule at list price ($2k rent vs $45k).
- Recommended offer: $42k (6.0% below list) — sets the bar for market timing.
- Cap rate 33.9% vs local median 5.4% in Jackson — top-decile yield for the area; either an underpriced asset or a hidden risk that comps aren't pricing in. Stress-test before assuming the spread holds.
Location & tenants
- Location reads 74/100 on livability (#197 in MI, #4,970 nationally) — a middle-class / working-renter tenant base. Strengths: cost of living A+, housing A+, health & safety A+; Watch: schools D, crime F, employment F.
- Jackson Public Schools (urban): math 15% / reading 28% proficiency, ranked #458 of 540 in MI (top 85%) — low school quality limits family demand, transient renter base, plan for 1-2y turnover; 63% free/reduced lunch — lower-income household profile, screen leases tightly.
- Market conditions: Rents rising fast (+7.5%/yr); 164 active listings in the ZIP; 317 units permitted in Jackson County in 2024 (103 in 5+ unit buildings).
- This rent runs 36% of the median local income ($56k/yr) — at the standard rent-burdened threshold; future hikes will face affordability resistance.
Forward outlook
- Local home prices are declining (-3.0%/yr); year-one equity from $310 of loan paydown is wiped out by about $1k of value loss. Plan a longer hold.
- Jackson County population projected at -13% by 2050 — secular population decline; favor cash flow + early exit over multi-decade hold.
- At projected returns (-3.0% appreciation + 7.5% rent growth), your $13k cash investment doubles in ~2 years — after that, you're playing with house money.
Negotiation context
- It's been on market 71 days — a 6% lower offer ($42k) is reasonable based on typical stale-listing flexibility.
- 3 sale attempts; this cycle's ask has dropped $10k (18%) from the opening price — seller is motivated, your offer sets the floor, not the list.
Risks & watch-outs
- Watch-outs: built in 1920 — expect roof / HVAC / electrical / plumbing capex.
Questions for the listing agent
- It's been on market 71 days. Have you received any prior offers? Is the seller open to a 6% concession, seller financing, or rate buy-down credit?
- Built in 1920 — when were the roof, HVAC, electrical panel, plumbing, and water heater last replaced?
- Why hasn't it sold? Are there any deal-killer items the seller is aware of (foundation, flood, title, zoning, code violations)?
- Is there a deadline driving the sale (1031 exchange, divorce, estate, relocation)? That informs how much negotiation room exists.
- Schools are D-rated, which usually means shorter tenancies and higher turnover. Who's the typical renter profile here, and what's been the actual vacancy rate?
- Crime grade is F in this area — have there been break-ins, vandalism, or insurance claims at this property in the last 3 years? What carrier currently insures it and at what premium?
- What's the average days-on-market for RENTAL listings here right now (not sales)? A rising rental-DOM trend means longer vacancies and softer asking-rent achievability than the comps imply.
- What's the recent tenant-quality profile in this submarket — average credit score on applications, eviction rate, late-payment / NSF rate, and stable-employment percentage? A property-management company in the area should have these aggregated.
- How much new for-sale + rental construction is in the pipeline within 1–3 miles? Heavy new supply typically softens prices + rents 12–24 months out; constrained supply supports both.
Investment metrics
- 1% rule
- 3.79% ✓
- Cap rate
- 33.91%
- Cash-on-cash
- 98.64%
- DSCR
- 5.39
- GRM
- 2.2
CMA / ARV
- ARV (median comp)
- $91,925
- List price
- $44,900
- Delta
- -51.16%
- Verdict
- UNDERPRICED
- Comps
- 20 within 1.0 mi
Show comp detail 12 sales within ~0.75 mi
| Address | Dist | Beds/Ba | Sqft | Sold | Price | $/sf | Match |
|---|---|---|---|---|---|---|---|
| 209 Damon St | 0.18mi | 3/2.0 (-1) | 1,740 (-0%) | 1mo | $190,000 | $109 | 85 |
| 1505 Carl Breeding Way | 0.16mi | 4/2.0 | 1,607 (-8%) | 2mo | $162,000 | $101 | 78 |
| 1215 Martin Luther King Jr Dr | 0.22mi | 3/1.5 (-1) | 1,726 (-1%) | 10mo | $65,000 | $38 | 72 |
| 181 W Prospect St | 0.35mi | 4/2.0 | 1,874 (+8%) | 3mo | $30,000 | $16 | 68 |
| 1616 First St | 0.64mi | 4/2.0 | 1,710 (-2%) | 2mo | $170,000 | $99 | 65 |
| 146 W Mansion St | 0.24mi | 3/2.0 (-1) | 1,608 (-8%) | 8mo | $146,000 | $91 | 64 |
| 1413 Carl Breeding Way | 0.15mi | 4/1.5 | 1,519 (-13%) | 8mo | $82,000 | $54 | 62 |
| 314 Mitchell St | 0.58mi | 4/2.0 | 1,589 (-9%) | 1mo | $65,501 | $41 | 57 |
| 1238 Greenwood Ave | 0.71mi | 4/1.0 | 1,700 (-2%) | 2mo | $115,000 | $68 | 57 |
| 139 W Mansion St | 0.24mi | 3/2.0 (-1) | 1,548 (-11%) | 11mo | $131,000 | $85 | 56 |
| 105 Mitchell St | 0.50mi | 4/2.0 | 1,999 (+15%) | 8mo | $168,500 | $84 | 46 |
| 2637 Bow St | 0.72mi | 3/2.0 (-1) | 1,892 (+8%) | 9mo | $197,500 | $104 | 40 |
Match score weights: distance 35% · size 25% · config 20% · recency 20%. Top-matched comps best support the ARV.
Projected returns pro-forma
-3.0% appreciation · 7.54% rent growth · sell at horizon
- IRR
- —
- Equity multiple
- 6.30×
- Total profit
- $66,693
- Equity at exit
- $6,695
- IRR
- —
- Equity multiple
- 15.28×
- Total profit
- $179,553
- Equity at exit
- $3,882
Cash invested: $12,572 (down + closing). Projections, not guarantees.
Landlord ↔ Tenant lean methodology
- Overall (STATE)
- 62 Landlord-Friendly
- State Michigan
- 62 Landlord-Friendly · EVEN
- County
- — inherits STATE
- City
- — inherits STATE
ZIP-level market 49203
- Home prices YoY
- -31.7%
- Rents YoY
- 7.5%
- Active inventory
- 164
- Price-to-rent
- 2.2×
Monthly cashflow live
- Estimated rent
- $1,701 medium interval (Pro) →
- Mortgage (P&I)
- −$235
- Tax est. 1.5%
- −$56 /mo · $674/yr
- Insurance
- −$19
- HOA
- −$0
- Vacancy / Maint / Mgmt
- −$357
- Net cashflow
- $1,033
Break-even live
UW: 25.0% down · 7.5% · 30yr · 1.5% tax · 5.0% vac · 8.0% maint · 8.0% mgmt
Financing live
Cash to close
- Down payment
- $11,225
- Closing costs
- $1,347
- Reserves months
- —
- Total cash needed
- —
Loan-product check · same deal, 3 products live
Conventional
25% down · 7.5% · 30yr
- Down + closing
- —
- Monthly P&I
- —
- Monthly cashflow
- —
- DSCR
- —
- Eligible?
- —
Personal DTI + credit; lowest rate.
DSCR
20% down · 8.5% · 30yr
- Down + closing
- —
- Monthly P&I
- —
- Monthly cashflow
- —
- DSCR
- —
- Eligible?
- —
No personal income docs; deal must DSCR.
Hard money
10% down · 12.0% · 12mo
- Down + closing
- —
- Monthly P&I
- —
- Monthly cashflow
- —
- DSCR
- —
- Eligible?
- —
Short-term bridge; refi at stabilization.
Listing history 22 events
-
2026-06-19days on market $44,900 Active 71 DOM
-
2026-06-18days on market $44,900 Active 70 DOM
-
2026-06-17days on market $44,900 Active 69 DOM
-
2026-06-16days on market $44,900 Active 68 DOM
-
2026-06-15days on market $44,900 Active 67 DOM
-
2026-06-14days on market $44,900 Active 65 DOM
-
2026-06-13days on market $44,900 Active 64 DOM
-
2026-06-10days on market $44,900 Active 62 DOM
-
2026-06-09days on market $44,900 Active 61 DOM
-
2026-06-08days on market $44,900 Active 60 DOM
-
2026-06-07days on market $44,900 Active 59 DOM
-
2026-06-03days on market $44,900 Active 55 DOM
-
2026-06-02days on market $44,900 Active 54 DOM
-
2026-06-01days on market $44,900 Active 53 DOM
-
2026-05-31days on market $44,900 Active 52 DOM
-
2026-05-30days on market $44,900 Active 51 DOM
-
2026-05-14price $44,900 268-char remark
Show marketing remark (268 chars)
Calling all investors! This home has tons of potential and is ready for some TLC! Prime location, minutes to downtown Jackson, Henry Ford Hospital, Campus, andso much more. This home is being sold AS-IS and a licensed real estate agent must be present at all showings.
-
2026-05-13price $44,900 268-char remark
Show marketing remark (268 chars)
Calling all investors! This home has tons of potential and is ready for some TLC! Prime location, minutes to downtown Jackson, Henry Ford Hospital, Campus, andso much more. This home is being sold AS-IS and a licensed real estate agent must be present at all showings.
-
2026-05-13price $44,900
Show marketing remark (268 chars)
Calling all investors! This home has tons of potential and is ready for some TLC! Prime location, minutes to downtown Jackson, Henry Ford Hospital, Campus, andso much more. This home is being sold AS-IS and a licensed real estate agent must be present at all showings.
-
2026-04-10$54,900 Active 268-char remark
Show marketing remark (268 chars)
Calling all investors! This home has tons of potential and is ready for some TLC! Prime location, minutes to downtown Jackson, Henry Ford Hospital, Campus, andso much more. This home is being sold AS-IS and a licensed real estate agent must be present at all showings.
-
2026-04-09$54,900 Active 268-char remark
Show marketing remark (268 chars)
Calling all investors! This home has tons of potential and is ready for some TLC! Prime location, minutes to downtown Jackson, Henry Ford Hospital, Campus, andso much more. This home is being sold AS-IS and a licensed real estate agent must be present at all showings.
-
2026-04-09$54,900 Active
Show marketing remark (268 chars)
Calling all investors! This home has tons of potential and is ready for some TLC! Prime location, minutes to downtown Jackson, Henry Ford Hospital, Campus, andso much more. This home is being sold AS-IS and a licensed real estate agent must be present at all showings.
ⓘ Source: listings_history table (triggers on properties + properties_extension) + one-shot
backfill from property_details.listing_events for pre-trigger history.
Climate risk First Street
- Flood 1/10 Low FEMA zone X (unshaded) · 0% chance over 30 yrs
- Wildfire 1/10 Low
- Heat 2/10 Low 7 d/yr ≥98°F today · 14 d/yr by 30 yrs out
- Wind 2/10 Low
- Air quality 2/10 Low 1 unhealthy d/yr today · 1 by 30 yrs out
Nearby sold comps map
Loading sold comps map…
Walkable amenities ~0.75 mi
Loading nearby amenities…
Taxation est. · year 1
- Rental income
- $20,411
- − Mortgage interest
- −$2,515
- − Property taxes
- −$674
- − Insurance
- −$224
- − Repairs & maintenance
- −$1,633
- − Management
- −$1,633
- − Depreciation
- −$1,306
- Taxable income
- $12,426
- Est. tax owed @ 24.0%
- −$2,982
- After-tax cash flow
- $9,419/yr
For passive investors: Depreciation is non-cash, so a rental often shows a tax loss while cash-flowing — sheltering income. Rental losses are passive: they offset passive income freely, and up to $25,000/yr can offset ordinary (W-2) income if you actively participate and your MAGI is under $100k (phasing out to $0 by $150k); unused losses carry forward. On sale, claimed depreciation is recaptured at up to 25%, and gains may owe capital-gains tax (a 1031 exchange can defer both). Figures are a year-1 estimate at your 24.0% rate — not tax advice; consult a CPA.
Schools (NCES district)
- District
- Jackson Public Schools
- NCES district ID
- 2619620
- Math proficiency
- 15% ▼ -6.00%
- Reading proficiency
- 28% ▼ -3.00%
- Median HH income
- $38,344
- Composite
- 17.99/100
- National rank
- #8986
- State rank
- #458 of 540 in MI
Livability — Jackson
- Score
- 74/100
- State rank
- #197
- US rank
- #4970
Category grades
Schools grade is shown separately in the Schools card above.
Census & demographics
- Census place
- Jackson, MI
- County
- Jackson County · 85,581 people
- City population
- 85,581
- Metro
- Jackson, MI
- Population (ZIP)
- 36,474
- Household income
- $56,201
- Rent vs Own
- Severe rent burden
- 1383.0
Population outlook (Jackson County) Hauer SSP2
- Today (2025)
- 156,365 people
- By 2030
- 153,123 · -2.1%
- By 2040
- 144,981 · -7.3%
- By 2050
- 135,671 · -13.2%
- By 2075
- 113,833 · -27.2%
- By 2100
- 86,592 · -44.6%
Race, ethnicity, and origin ACS 2023
- Neighborhood character
- Predominantly White (73%)
- Race & ethnicity
- White 73% Black 15% Two or more races 9% Hispanic / Latino 5%
- Common ancestry
- Romanian 6% Lithuanian 3% Slovak 2%
- Foreign-born
- 2% · Canada
- Languages at home
- 97% English-only · Spanish 1% Other Indo-European 1%
Political lean MEDSL · Jackson
- 2024 margin
- Strong R (+21.3) · D 38.6% · R 59.9% · Other 1.5%
- 2008→2024 swing
- -23.7pp toward R · 2008: 2.4pp · 2024: -21.3pp
- All cycles
- 2024: R+21.3 2020: R+19.0 2016: R+20.1 2012: R+5.8 2008: D+2.4
Not yet ingested
- Civics
- —
Market trends
- HPI YoY
- ▼ -98.09%
- Current HPI
- 211.5474
- Rent YoY
- ▲ 7.54%
- Metro
- Jackson, MI
- State GDP YoY
- ▲ 1.37%
- F500 in state
- 28
Industry mix (Fortune 500 HQ in MI)
| Industry | F500 HQs | Revenue |
|---|---|---|
| Automotive Parts | 3 | $48B |
|
||
| Automotive | 2 | $372B |
|
||
| Chemicals | 1 | $45B |
|
||
| Automotive Retail | 1 | $29B |
|
||
| Healthcare / Medical Devices | 1 | $23B |
|
||
| Automotive Technology | 1 | $20B |
|
||
Price history
-18.2% since first listed6 events — show timeline
- 2026-05-14 Price Changed $44,900 MiRealSource-MiMLS
- 2026-05-13 Price Changed $44,900 REALCOMP
- 2026-05-13 Price Changed $44,900 SW Michigan MLS
- 2026-04-10 Listed $54,900 REALCOMP
- 2026-04-09 Listed $54,900 SW Michigan MLS
- 2026-04-09 Listed $54,900 MiRealSource-MiMLS
Property tax history
+15.0%/yrLatest (2025): $3,829 · +160.9% YoY. Source: county tax records.
Cash-flow waterfall
monthlySold comps — $/sqft
last 12 mo · ≤1 miLoading sold comps…