918 E Green St Unit G111 · Franklinton, NC
Flood risk 1/10 · Minimal
- FEMA flood zone
- X (unshaded)
- Chance of flooding over 30 yrs
- 0.0%
- Est. flood insurance / yr
- $507 – $1,088
Fire risk 4/10 · Minor
- Est. fire insurance / yr
- $906 – $1,684
Heat risk 6/10 · Moderate
- Hot days now (above 106°F)
- 7 days/yr
- Hot days in 30 yrs
- 17 days/yr
Wind risk 6/10 · Moderate
- Chance of severe wind over 30 yrs
- 47.0%
Air-quality risk 2/10 · Minimal
- Unhealthy air days now
- 1 days/yr
- Unhealthy air days in 30 yrs
- 1 days/yr
Risk factors via First Street. Map © Google.
Why this score? — see what drove the D- grade
The composite is a weighted blend of 9 inputs, each scored 0–100. Each bar is that input's sub-score; the figure is the points it added to the 100-point composite (weight × sub-score).
- Appreciation +9.2/10.0
- ARV discount +7.5/15.0
- Cash flow +6.8/30.0
- Livability +3.1/5.0
- Schools +3.0/10.0
- 1% rule +2.7/10.0
- Rent growth +2.5/5.0
- Condition / age +2.5/5.0
- DSCR +1.0/10.0
$230,000
🖨 Deal sheet 📄 Offer letter ✓ Due diligence
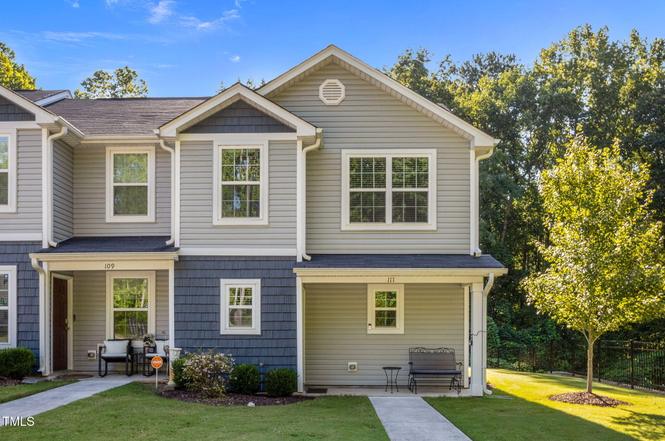
Listing remarks MLS
Boxwood In this beautiful townhome, a gorgeous kitchen includes granite countertops, full suite of appliances, recessed lighting & a spacious island. Luxury wood-look flooring flows from the kitchen to the dining area. A spacious family room has gorgeous natural light flowing in and plenty of space for gathering friends and family. A large master suite boasts an attached bath, large windows and a walk-in closet. Also found on the second level are two additional bedrooms and a convenient laundry room.
Key facts
- Spacious island
- Wood-look flooring
- Modern appliances
Tags
Property features AI
Finance
- Other: Living area approximately 1,509; Lot about 0.12 acres
- HOA & community: HOA (Crawford Townes HOA); Monthly association fee of $180; Association amenities: landscaping, grounds maintenance, management, trash (trash included in fee)
Exterior
- Parking: Assigned parking (2 spaces); No open parking
- Utilities: Public water; Public sewer; Electric service
- Home design: Townhouse; End unit with one common wall; Two levels; Unit G111
- Construction: Vinyl siding; Shingle roof; Slab foundation; Built as townhouse
- Exterior features: Patio; Porch; Public maintained road; Street lights in community
Interior
- Kitchen: Dishwasher; Electric oven; Range; Microwave; Refrigerator
- Bedrooms: 3 bedrooms
- Flooring: Carpet; Laminate
- Bathrooms: 2 full bathrooms; 1 half bathroom
- Heating & cooling: Heat pump; Hot water heating; Central air; Ceiling fans for cooling
- Interior features: Ceiling fans; Granite counters; Kitchen island; Kitchen/dining room combination; Recessed lighting; Sliding doors
- Laundry & utility: Washer; Dryer; Laundry room on upper level; Electric water heater
Neighborhood map
What this means for you Summary
Snapshot
- This is a 3-bed/2.5-bath townhouse listed at $230k.
Deal economics
- At list price, monthly cash flow is $-363 ($-4k/yr) — negative.
- To cash-flow at today's rent, offer at most $178k (22.8% below list).
- To meet the 1% rule (rent ≥ 1% of price), the offer needs to be $178k (22.6% below list).
- Recommended offer: $178k (22.8% below list) — sets the bar for cash-flow.
- Cap rate 4.4% vs local median 3.1% in Franklinton — top-decile yield for the area; either an underpriced asset or a hidden risk that comps aren't pricing in. Stress-test before assuming the spread holds.
Location & tenants
- Location reads 61/100 on livability (#491 in NC) — a middle-class / working-renter tenant base. Strengths: cost of living A+, housing A+; Watch: crime D, amenities F, commute F.
- Franklin County Schools (rural): math 34% / reading 37% proficiency, ranked #128 of 178 in NC (top 72%) — families likely to look elsewhere, expect single-tenant / working-renter base with shorter leases.
- Zoned schools: Franklinton Elementary (math 29% / reading 25%, grade F, #1,033 of 1,410 statewide, top 76%, 522 students, 81% FRL); Franklinton Middle (math 26% / reading 27%, grade F, #381 of 475 statewide, top 81%, 247 students, 78% FRL); Franklinton High (math 57% / reading 60%, grade C, #235 of 535 statewide, top 45%, 1,182 students, 48% FRL).
- Market conditions: 249 active listings in the ZIP; 948 units permitted in Franklin County in 2024 (0 in 5+ unit buildings).
Forward outlook
- In year one you build about $21k of equity ($2k loan paydown + $19k appreciation (8.4% local appreciation)).
- Franklin County population projected at +13% by 2050 — modest demand growth; plan on rents tracking national, not racing it.
- By year 2, paydown + projected appreciation supports a ~$34k cash-out refi (75% LTV) — recoverable capital for the next deal without selling this one.
Negotiation context
- It's been on market 296 days — a 12% lower offer ($202k) is reasonable based on typical stale-listing flexibility.
- 5 sale attempts since 7y ago; this cycle's ask has dropped $45k (16%) from the opening price — seller is motivated, your offer sets the floor, not the list.
- Current owner paid $189k; 22% above their basis — modest negotiation headroom, anchor on the comps not their cost.
Risks & watch-outs
- Climate carrying-cost: major wind risk, 47% chance of damaging wind over 30y; extreme-heat days projected 7→17/yr by 2055 (HVAC capex compounding) — expect insurance premiums to compound above CPI over the hold.
Questions for the listing agent
- What do current leases actually rent for vs. the listed asking? Can we see a recent rent roll and the last 12 months of T-12 income?
- It's been on market 296 days. Have you received any prior offers? Is the seller open to a 23% concession, seller financing, or rate buy-down credit?
- What does the HOA fee cover, when was the last increase, and are there any pending special assessments or reserve-fund shortfalls?
- Why hasn't it sold? Are there any deal-killer items the seller is aware of (foundation, flood, title, zoning, code violations)?
- Is there a deadline driving the sale (1031 exchange, divorce, estate, relocation)? That informs how much negotiation room exists.
- Schools are F-rated, which usually means shorter tenancies and higher turnover. Who's the typical renter profile here, and what's been the actual vacancy rate?
- Crime grade is D in this area — have there been break-ins, vandalism, or insurance claims at this property in the last 3 years? What carrier currently insures it and at what premium?
- The area grade is low — what's the realistic commute time and amenity access for the typical tenant pool here? Any planned neighborhood developments (good or bad) we should know about?
- What's the average days-on-market for RENTAL listings here right now (not sales)? A rising rental-DOM trend means longer vacancies and softer asking-rent achievability than the comps imply.
- What's the recent tenant-quality profile in this submarket — average credit score on applications, eviction rate, late-payment / NSF rate, and stable-employment percentage? A property-management company in the area should have these aggregated.
- How much new for-sale + rental construction is in the pipeline within 1–3 miles? Heavy new supply typically softens prices + rents 12–24 months out; constrained supply supports both.
Investment metrics
- 1% rule
- 0.77% ✗
- Cap rate
- 4.40%
- Cash-on-cash
- -6.76%
- DSCR
- 0.70
- GRM
- 10.8
CMA / ARV
No comps found within radius.
Projected returns pro-forma
8.42% appreciation · 3.0% rent growth · sell at horizon
- IRR
- 15.9%
- Equity multiple
- 2.21×
- Total profit
- $78,022
- Equity at exit
- $181,370
- IRR
- 15.4%
- Equity multiple
- 4.79×
- Total profit
- $244,221
- Equity at exit
- $366,536
Cash invested: $64,400 (down + closing). Projections, not guarantees.
Landlord ↔ Tenant lean methodology
- Overall (STATE)
- 85 Strongly Landlord-Friendly
- State North Carolina
- 85 Strongly Landlord-Friendly · R+3
- County
- — inherits STATE
- City
- — inherits STATE
ZIP-level market 27525
- Home prices YoY
- 3.0%
- Active inventory
- 249
- Price-to-rent
- 10.8×
Monthly cashflow live
- Estimated rent
- $1,781 medium interval (Pro) →
- Mortgage (P&I)
- −$1,206
- Tax est. 1.5%
- −$288 /mo · $3,450/yr
- Insurance
- −$96
- HOA
- −$180
- Vacancy / Maint / Mgmt
- −$374
- Net cashflow
- $-363
Break-even live
UW: 25.0% down · 7.5% · 30yr · 1.5% tax · 5.0% vac · 8.0% maint · 8.0% mgmt
Financing live
Cash to close
- Down payment
- $57,500
- Closing costs
- $6,900
- Reserves months
- —
- Total cash needed
- —
Loan-product check · same deal, 3 products live
Conventional
25% down · 7.5% · 30yr
- Down + closing
- —
- Monthly P&I
- —
- Monthly cashflow
- —
- DSCR
- —
- Eligible?
- —
Personal DTI + credit; lowest rate.
DSCR
20% down · 8.5% · 30yr
- Down + closing
- —
- Monthly P&I
- —
- Monthly cashflow
- —
- DSCR
- —
- Eligible?
- —
No personal income docs; deal must DSCR.
Hard money
10% down · 12.0% · 12mo
- Down + closing
- —
- Monthly P&I
- —
- Monthly cashflow
- —
- DSCR
- —
- Eligible?
- —
Short-term bridge; refi at stabilization.
HOA detail
- Monthly dues
- $180 · $2,160/yr
Listing history 16 events
-
2026-06-18days on market $230,000 Active 296 DOM
-
2026-06-17days on market $230,000 Active 295 DOM
-
2026-06-16days on market $230,000 Active 294 DOM
-
2026-06-15days on market $230,000 Active 293 DOM
-
2026-06-13days on market $230,000 Active 291 DOM
-
2026-06-12days on market $230,000 Active 290 DOM
-
2026-06-09days on market $230,000 Active 287 DOM
-
2026-06-08days on market $230,000 Active 286 DOM
-
2026-06-07days on market $230,000 Active 285 DOM
-
2026-06-07days on market $230,000 Active 284 DOM
-
2026-06-04days on market $230,000 Active 281 DOM
-
2026-06-02days on market $230,000 Active 280 DOM
-
2026-06-01price $230,000 Active 279 DOM
-
2026-06-01days on market $234,000 Active 279 DOM
-
2026-05-31remarks 693-char remark
-
2026-05-31$234,000 Active 278 DOM
ⓘ Source: listings_history table (triggers on properties + properties_extension) + one-shot
backfill from property_details.listing_events for pre-trigger history.
Climate risk First Street
- Flood 1/10 Low FEMA zone X (unshaded) · 0% chance over 30 yrs
- Wildfire 4/10 Moderate
- Heat 6/10 Major 7 d/yr ≥106°F today · 17 d/yr by 30 yrs out
- Wind 6/10 Major 47% chance of damaging wind over 30 yrs
- Air quality 2/10 Low 1 unhealthy d/yr today · 1 by 30 yrs out
Nearby sold comps map
Loading sold comps map…
Walkable amenities ~0.75 mi
Loading nearby amenities…
Taxation est. · year 1
- Rental income
- $21,370
- − Mortgage interest
- −$12,884
- − Property taxes
- −$3,450
- − Insurance
- −$1,150
- − Repairs & maintenance
- −$1,710
- − Management
- −$1,710
- − HOA
- −$2,160
- − Depreciation
- −$6,691
- Taxable loss
- −$8,384
- Est. tax savings @ 24.0%
- +$2,012
- After-tax cash flow
- $-2,340/yr
For passive investors: Depreciation is non-cash, so a rental often shows a tax loss while cash-flowing — sheltering income. Rental losses are passive: they offset passive income freely, and up to $25,000/yr can offset ordinary (W-2) income if you actively participate and your MAGI is under $100k (phasing out to $0 by $150k); unused losses carry forward. On sale, claimed depreciation is recaptured at up to 25%, and gains may owe capital-gains tax (a 1031 exchange can defer both). Figures are a year-1 estimate at your 24.0% rate — not tax advice; consult a CPA.
Schools (NCES district)
- District
- Franklin County Schools
- NCES district ID
- 3701530
- Math proficiency
- 34% ▬ 0.00%
- Reading proficiency
- 37% ▼ -4.00%
- Median HH income
- $44,630
- Composite
- 30.25/100
- National rank
- #6286
- State rank
- #128 of 178 in NC
Livability — Franklinton
- Score
- 61/100
- State rank
- #491
- US rank
- #18002
Category grades
Schools grade is shown separately in the Schools card above.
Census & demographics
- Census place
- Franklinton, NC
- County
- Franklin County · 64,885 people
- City population
- 17,110
- Metro
- Raleigh-Cary, NC
- Population (ZIP)
- 17,110
- Household income
- $73,036
- Rent vs Own
- Severe rent burden
- 446.0
Population outlook (Franklin County) Hauer SSP2
- Today (2025)
- 69,848 people
- By 2030
- 72,480 · +3.8%
- By 2040
- 76,682 · +9.8%
- By 2050
- 78,993 · +13.1%
- By 2075
- 82,888 · +18.7%
- By 2100
- 80,784 · +15.7%
Race, ethnicity, and origin ACS 2023
- Neighborhood character
- Predominantly White (66%)
- Race & ethnicity
- White 66% Black 24% Hispanic / Latino 6% Two or more races 5%
- Hispanic origin (detail)
- Mexican 3% Cuban 2%
- Common ancestry
- Slovak 3% Serbian 2% Italian 2%
- Foreign-born
- 3% · Canada
- Languages at home
- 94% English-only · Spanish 3% German/W. Germanic 1%
Political lean MEDSL · Franklin
- 2024 margin
- R (+13.6) · D 42.7% · R 56.3%
- 2008→2024 swing
- -12.9pp toward R · 2008: -0.7pp · 2024: -13.6pp
- All cycles
- 2024: R+13.6 2020: R+13.4 2016: R+11.7 2012: R+4.2 2008: R+0.7
Not yet ingested
- Civics
- —
Market trends
- HPI YoY
- ▲ 8.42%
- Current HPI
- 294.1531
- Rent YoY
- —
- Metro
- Raleigh-Cary, NC
- State GDP YoY
- ▲ 3.28%
- F500 in state
- 26
Industry mix (Fortune 500 HQ in NC)
| Industry | F500 HQs | Revenue |
|---|---|---|
| Financial Services | 2 | $213B |
|
||
| Retail | 2 | $95B |
|
||
| Industrial Conglomerate | 1 | $38B |
|
||
| Metals / Steel | 1 | $35B |
|
||
| Utilities | 1 | $30B |
|
||
| Industrial Machinery | 1 | $19B |
|
||
Price history
+24.5% since first listed17 events — show timeline
- 2026-04-20 Price Changed $234,000 TMLS
- 2026-02-03 Price Changed $245,000 TMLS
- 2025-12-19 Price Changed $249,000 TMLS
- 2025-11-17 Price Changed $259,000 TMLS
- 2025-10-21 Price Changed $267,000 TMLS
- 2025-09-19 Price Changed $269,000 TMLS
- 2025-08-26 Listed $275,000 TMLS
- 2020-09-30 Sold (MLS) $188,900 TMLS
- 2020-08-24 Pending — TMLS
- 2020-08-04 Relisted — TMLS
- 2020-07-13 Pending — TMLS
- 2020-07-04 Price Changed $188,900 TMLS
- 2020-06-30 Relisted — TMLS
- 2020-05-14 Pending — TMLS
- 2020-03-05 Relisted — TMLS
- 2020-01-17 Pending — TMLS
- 2019-11-01 Listed $187,900 TMLS
Cash-flow waterfall
monthlySold comps — $/sqft
last 12 mo · ≤1 miLoading sold comps…