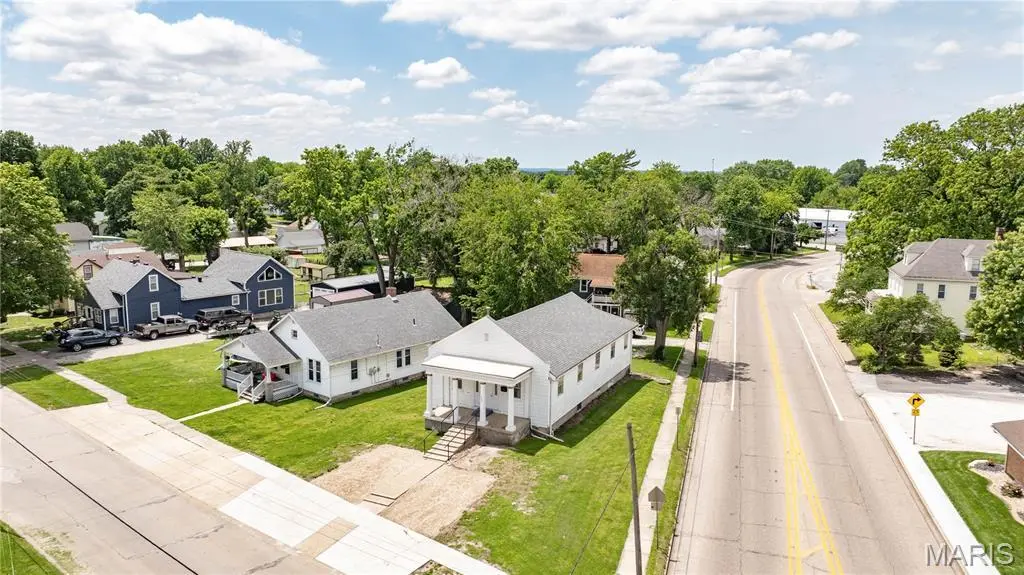
400 S Washington St · Jerseyville, IL
Flood risk 1/10 · Minimal
- FEMA flood zone
- X (unshaded)
- Chance of flooding over 30 yrs
- 0.0%
- Est. flood insurance / yr
- $507 – $1,088
Fire risk 1/10 · Minimal
- Est. fire insurance / yr
- $804 – $1,492
Heat risk 4/10 · Minor
- Hot days now (above 105°F)
- 7 days/yr
- Hot days in 30 yrs
- 20 days/yr
Wind risk 2/10 · Minimal
- Chance of severe wind over 30 yrs
- 1.0%
Air-quality risk 2/10 · Minimal
- Unhealthy air days now
- 0 days/yr
- Unhealthy air days in 30 yrs
- 1 days/yr
Risk factors via First Street. Map © Google.
Why this score? — see what drove the C- grade
The composite is a weighted blend of 9 inputs, each scored 0–100. Each bar is that input's sub-score; the figure is the points it added to the 100-point composite (weight × sub-score).
- Cash flow +15.0/30.0
- Appreciation +10.0/10.0
- ARV discount +7.5/15.0
- 1% rule +5.0/10.0
- DSCR +5.0/10.0
- Livability +3.6/5.0
- Rent growth +2.5/5.0
- Schools +2.5/10.0
- Condition / age +2.5/5.0
$1
🖨 Deal sheet 📄 Offer letter ✓ Due diligence
Listing remarks
This spacious residential property offers an abundance of flexible living space and is situated on a convenient corner lot location. Featuring multiple large gathering areas, bonus rooms, office spaces, and storage areas throughout, this property provides endless possibilities for a growing family, home-based business, hobby space, or multi-purpose living arrangement. The main level features a large 46’ x 27’ living and gathering area complete with a 15’ x 8’ raised stage area that could serve as an entertainment space, recreation area, or be customized to fit your needs. Additional main-floor features include multiple office/storage rooms, a half bath, and access to
Key facts
- Bonus rooms
- Storage areas
- Office spaces
Tags
Property features AI
Finance
- Financial info: No second mortgage reported
Exterior
- Parking: Open parking lot
- Utilities: Public water; Public sewer; Electric service (Ameren); Electricity available; Water available; Sewer available
- Home design: Single-family attached residence; One level
- Construction: Built with other construction materials
- Exterior features: Corner, level lot; City street frontage
Interior
- Bedrooms: 2 bedrooms (both on the main level)
- Bathrooms: 1 half bathroom (on the main level)
- Heating & cooling: Forced air heating; Central air conditioning (electric)
- Interior features: Forced air heating; Central air conditioning (electric)
Neighborhood map
What this means for you Summary
Snapshot
- This is a 2-bed/0.5-bath single-family listed at $1.
Deal economics
- At list price, monthly cash flow is $870 ($10k/yr) — positive.
- The deal already cash-flows at list — no discount required.
- Meets the 1% rule at list price ($1k rent vs $1).
- Cap rate 1043992.5% vs local median 4.6% in Jerseyville — top-decile yield for the area; either an underpriced asset or a hidden risk that comps aren't pricing in. Stress-test before assuming the spread holds.
Location & tenants
- Location reads 72/100 on livability (#327 in IL) — a middle-class / working-renter tenant base. Strengths: cost of living A+, housing A+, crime A; Watch: health & safety C-, amenities D+, commute F.
- Jersey CUSD 100 (town): math 25% / reading 32% proficiency, ranked #260 of 620 in IL (top 42%) — low school quality limits family demand, transient renter base, plan for 1-2y turnover.
- Market conditions: 90 active listings in the ZIP; 101 units permitted in Jersey County in 2024 (68 in 5+ unit buildings).
Forward outlook
- Jersey County population projected at -24% by 2050 — secular population decline; favor cash flow + early exit over multi-decade hold.
- At projected returns (10.0% appreciation + 3.0% rent growth), your $0 cash investment doubles in ~1 year — after that, you're playing with house money.
Negotiation context
- Only 10 days on market — expect competitive offers; lowballing is unlikely to land.
Risks & watch-outs
- Watch-outs: built in 1924 — expect roof / HVAC / electrical / plumbing capex.
Questions for the listing agent
- Built in 1924 — when were the roof, HVAC, electrical panel, plumbing, and water heater last replaced?
- Is there a deadline driving the sale (1031 exchange, divorce, estate, relocation)? That informs how much negotiation room exists.
- What's the average days-on-market for RENTAL listings here right now (not sales)? A rising rental-DOM trend means longer vacancies and softer asking-rent achievability than the comps imply.
- What's the recent tenant-quality profile in this submarket — average credit score on applications, eviction rate, late-payment / NSF rate, and stable-employment percentage? A property-management company in the area should have these aggregated.
- How much new for-sale + rental construction is in the pipeline within 1–3 miles? Heavy new supply typically softens prices + rents 12–24 months out; constrained supply supports both.
Investment metrics
- 1% rule
- 110126.00% ✓
- Cap rate
- 1043992.48%
- Cash-on-cash
- 3728522.10%
- DSCR
- 165899.25
- GRM
- 0.0
CMA / ARV
- ARV (on-the-fly)
- $248,124
- Comps found
- 3
Show comp detail 3 sales within ~0.75 mi
| Address | Dist | Beds/Ba | Sqft | Sold | Price | $/sf | Match |
|---|---|---|---|---|---|---|---|
| 105 E Mulberry St | 0.46mi | 2/2.0 | 2,865 (+7%) | 12mo | $245,000 | $86 | 50 |
| 612 Crosswinds Ct | 0.59mi | 3/2.5 (+1) | 2,448 (-8%) | 5mo | $240,000 | $98 | 42 |
| 502 Stryker Ave | 0.71mi | 3/3.0 (+1) | 2,363 (-11%) | 20mo | $218,900 | $93 | 16 |
Match score weights: distance 35% · size 25% · config 20% · recency 20%. Top-matched comps best support the ARV.
Projected returns pro-forma
10.0% appreciation · 3.0% rent growth · sell at horizon
- IRR
- —
- Equity multiple
- 197955.25×
- Total profit
- $55,427
- Equity at exit
- $1
- IRR
- —
- Equity multiple
- 427440.00×
- Total profit
- $119,683
- Equity at exit
- $2
Cash invested: $0 (down + closing). Projections, not guarantees.
Landlord ↔ Tenant lean methodology
- Overall (STATE)
- 43 Moderately Tenant-Leaning
- State Illinois
- 43 Moderately Tenant-Leaning · D+7
- County
- — inherits STATE
- City
- — inherits STATE
ZIP-level market 62052
- Home prices YoY
- 10.2%
- Active inventory
- 90
Monthly cashflow live
- Estimated rent
- $1,101 medium interval (Pro) →
- Mortgage (P&I)
- −$0
- Tax est. 1.5%
- −$0 /mo · $0/yr
- Insurance
- −$0
- HOA
- −$0
- Vacancy / Maint / Mgmt
- −$231
- Net cashflow
- $870
Break-even live
UW: 25.0% down · 7.5% · 30yr · 1.5% tax · 5.0% vac · 8.0% maint · 8.0% mgmt
Financing live
Cash to close
- Down payment
- $0
- Closing costs
- $0
- Reserves months
- —
- Total cash needed
- —
Loan-product check · same deal, 3 products live
Conventional
25% down · 7.5% · 30yr
- Down + closing
- —
- Monthly P&I
- —
- Monthly cashflow
- —
- DSCR
- —
- Eligible?
- —
Personal DTI + credit; lowest rate.
DSCR
20% down · 8.5% · 30yr
- Down + closing
- —
- Monthly P&I
- —
- Monthly cashflow
- —
- DSCR
- —
- Eligible?
- —
No personal income docs; deal must DSCR.
Hard money
10% down · 12.0% · 12mo
- Down + closing
- —
- Monthly P&I
- —
- Monthly cashflow
- —
- DSCR
- —
- Eligible?
- —
Short-term bridge; refi at stabilization.
Listing history 7 events
-
2026-06-18days on market $1 Active 10 DOM
-
2026-06-17days on market $1 Active 9 DOM
-
2026-06-16days on market $1 Active 8 DOM
-
2026-06-15days on market $1 Active 7 DOM
-
2026-06-13days on market $1 Active 5 DOM
-
2026-06-08remarks 675-char remark
-
2026-06-08$1 Active 1 DOM
ⓘ Source: listings_history table (triggers on properties + properties_extension) + one-shot
backfill from property_details.listing_events for pre-trigger history.
Climate risk First Street
- Flood 1/10 Low FEMA zone X (unshaded) · 0% chance over 30 yrs
- Wildfire 1/10 Low
- Heat 4/10 Moderate 7 d/yr ≥105°F today · 20 d/yr by 30 yrs out
- Wind 2/10 Low 100% chance of damaging wind over 30 yrs
- Air quality 2/10 Low 0 unhealthy d/yr today · 1 by 30 yrs out
Nearby sold comps map
Loading sold comps map…
Walkable amenities ~0.75 mi
Loading nearby amenities…
Taxation est. · year 1
- Rental income
- $13,215
- − Mortgage interest
- −$0
- − Property taxes
- −$0
- − Insurance
- −$0
- − Repairs & maintenance
- −$1,057
- − Management
- −$1,057
- − Depreciation
- −$0
- Taxable income
- $11,101
- Est. tax owed @ 24.0%
- −$2,664
- After-tax cash flow
- $7,776/yr
For passive investors: Depreciation is non-cash, so a rental often shows a tax loss while cash-flowing — sheltering income. Rental losses are passive: they offset passive income freely, and up to $25,000/yr can offset ordinary (W-2) income if you actively participate and your MAGI is under $100k (phasing out to $0 by $150k); unused losses carry forward. On sale, claimed depreciation is recaptured at up to 25%, and gains may owe capital-gains tax (a 1031 exchange can defer both). Figures are a year-1 estimate at your 24.0% rate — not tax advice; consult a CPA.
Schools (NCES district)
- District
- Jersey CUSD 100
- NCES district ID
- 1720430
- Math proficiency
- 25% ▼ -10.00%
- Reading proficiency
- 32% ▼ -14.00%
- Median HH income
- $52,066
- Composite
- 25.13/100
- National rank
- #7522
- State rank
- #260 of 620 in IL
Livability — Jerseyville
- Score
- 72/100
- State rank
- #327
- US rank
- #6498
Category grades
Schools grade is shown separately in the Schools card above.
Census & demographics
- Census place
- Jerseyville, IL
- City population
- 12,483
- Population (ZIP)
- 12,483
Population outlook (Jersey County) Hauer SSP2
- Today (2025)
- 21,031 people
- By 2030
- 20,138 · -4.2%
- By 2040
- 18,077 · -14.0%
- By 2050
- 15,882 · -24.5%
- By 2075
- 11,718 · -44.3%
- By 2100
- 8,546 · -59.4%
Race, ethnicity, and origin ACS 2023
- Neighborhood character
- Predominantly White (96%)
- Race & ethnicity
- White 96% Two or more races 4% Hispanic / Latino 2%
- Common ancestry
- Slovak 2% Italian 1% Romanian 1%
- Foreign-born
- 1% · Canada
- Languages at home
- 99% English-only · Spanish 1%
Political lean MEDSL · Jersey
- 2024 margin
- Solid R (+50.2) · D 24.1% · R 74.3% · Other 1.6%
- 2008→2024 swing
- -47.5pp toward R · 2008: -2.7pp · 2024: -50.2pp
- All cycles
- 2024: R+50.2 2020: R+48.1 2016: R+46.4 2012: R+23.9 2008: R+2.7
Not yet ingested
- Civics
- —
Market trends
- HPI YoY
- ▲ 23.63%
- Current HPI
- 255.48
- Rent YoY
- —
- Metro
- —
- State GDP YoY
- ▲ 1.59%
- F500 in state
- 60
Industry mix (Fortune 500 HQ in IL)
| Industry | F500 HQs | Revenue |
|---|---|---|
| Insurance | 4 | $201B |
|
||
| Consumer Goods | 4 | $87B |
|
||
| Industrial Machinery | 3 | $64B |
|
||
| Healthcare | 2 | $55B |
|
||
| Retail / Pharmacy | 1 | $148B |
|
||
| Agriculture / Food | 1 | $86B |
|
||
Cash-flow waterfall
monthlySold comps — $/sqft
last 12 mo · ≤1 miLoading sold comps…