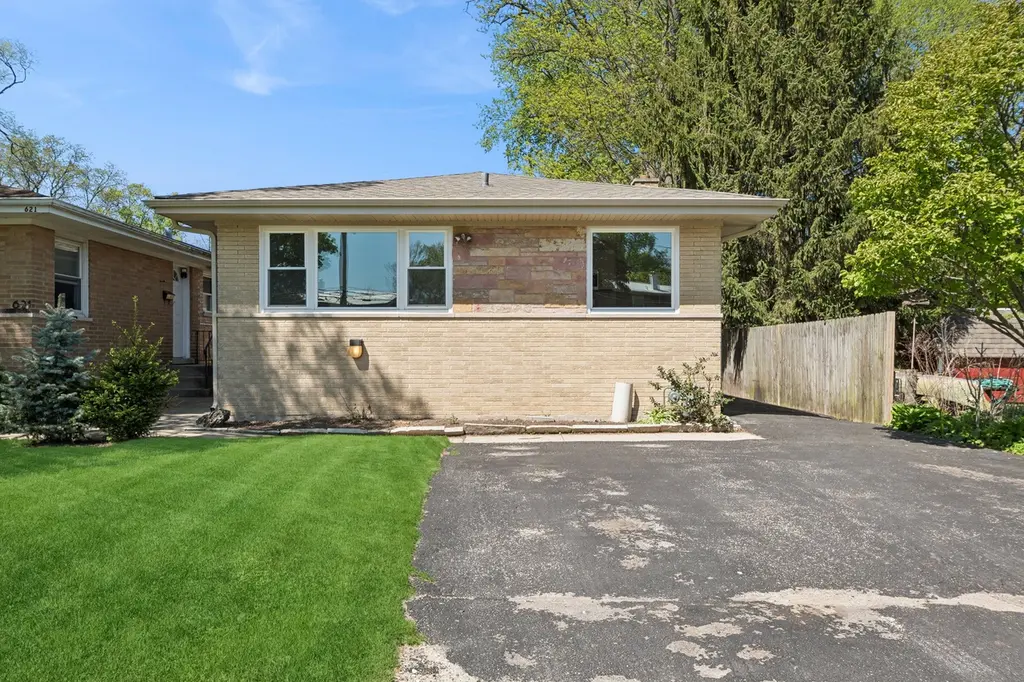
625 Hibbard Rd · Wilmette, IL
Flood risk 5/10 · Moderate
- FEMA flood zone
- X (unshaded)
- Chance of flooding over 30 yrs
- 0.24%
- Est. flood insurance / yr
- $473 – $860
Fire risk 1/10 · Minimal
- Est. fire insurance / yr
- $804 – $1,492
Heat risk 2/10 · Minimal
- Hot days now (above 98°F)
- 7 days/yr
- Hot days in 30 yrs
- 14 days/yr
Wind risk 2/10 · Minimal
- Chance of severe wind over 30 yrs
- 0.0%
Air-quality risk 4/10 · Minor
- Unhealthy air days now
- 5 days/yr
- Unhealthy air days in 30 yrs
- 5 days/yr
Risk factors via First Street. Map © Google.
Why this score? — see what drove the D+ grade
The composite is a weighted blend of 9 inputs, each scored 0–100. Each bar is that input's sub-score; the figure is the points it added to the 100-point composite (weight × sub-score).
- Cash flow +18.1/30.0
- Schools +7.7/10.0
- DSCR +5.7/10.0
- 1% rule +4.5/10.0
- Livability +4.2/5.0
- Rent growth +2.5/5.0
- Condition / age +2.5/5.0
- ARV discount +2.0/15.0
- Appreciation +0.0/10.0
$465,000
🖨 Deal sheet 📄 Offer letter ✓ Due diligence
Listing remarks
Newly Gut Rehabbed and never been lived in Raised Ranch house with 3 Bedroom/1Full Bath and Large Unfinished Basement with the opportunity to add a bedroom, den and 2nd full bath. Detached Garage for Studio, Workspace or Office. Great opportunity to live in Wilmette. Close to Edens Expressway, Edens Plaza and Old Orchard Shopping Center.
Key facts
- Close to edens plaza
- 4,397 sq ft lot
- 4 parking spots
Tags
Property features AI
Finance
- Other: Possession at closing or immediate; Earnest money held
- HOA & community: No master association fee required
Exterior
- Parking: Parking for 4 vehicles; Asphalt driveway
- Utilities: Public water; Public sewer; Electric service 400 amp or greater
- Home design: Detached single-family raised ranch; Fee simple ownership; Rehab completed in 2025; Estimated living area
- Construction: Brick construction; Built between 61-70 years ago; Property built before 1978; Rehab performed in 2025
- Exterior features: Lot dimensions approximately 37.5 x 117.24; Less than 0.25 acre lot; School bus service, commuter bus, and interstate access nearby
Interior
- Kitchen: Kitchen on main level, approximately 11 x 11
- Bedrooms: Three bedrooms (all on main level); Primary bedroom on main level, approximately 14 x 11; Second bedroom on main level, approximately 11 x 9; Third bedroom on main level, approximately 10 x 10
- Flooring: Hardwood flooring in living room, kitchen, and dining area
- Bathrooms: One full bathroom
- Heating & cooling: Natural gas heating; Central air conditioning
- Interior features: Six total rooms; Full unfinished basement
- Laundry & utility: Laundry room in basement, approximately 19 x 12
Neighborhood map
What this means for you Summary
Snapshot
- This is a 3-bed/1.0-bath single-family listed at $465k.
Deal economics
- At list price, monthly cash flow is $410 ($5k/yr) — positive.
- The deal already cash-flows at list — no discount required.
- To meet the 1% rule (rent ≥ 1% of price), the offer needs to be $441k (5.1% below list).
- Recommended offer: $441k (5.1% below list) — sets the bar for 1% rule.
- Cap rate 7.4% vs local median 2.0% in Wilmette — top-decile yield for the area; either an underpriced asset or a hidden risk that comps aren't pricing in. Stress-test before assuming the spread holds.
Location & tenants
- Location reads 83/100 on livability (#43 in IL, #892 nationally) — a professional / high-income tenant draw. Strengths: schools A+, crime A+, commute A+; Watch: cost of living F.
- New Trier Twp Hsd 203 (suburban): math 76% / reading 80% proficiency, ranked #2 of 620 in IL (top 0%) — strong family-tenant draw, lease renewals of 3-5y typical.
- Market conditions: 80 active listings in the ZIP; 6 comparable units currently listed for rent nearby; rentals leasing fast (median 5d on market — plan ~1-2 weeks tenant-placement turnaround); high-income renter base; 6,272 units permitted in Cook County in 2024 (4,658 in 5+ unit buildings).
Forward outlook
- Local home prices are declining (-3.0%/yr); year-one equity from $3k of loan paydown is wiped out by about $14k of value loss. Plan a longer hold.
Negotiation context
- It's been on market 35 days — a 3% lower offer ($451k) is reasonable based on typical stale-listing flexibility.
- 2 sale attempts since 16y ago with the ask held roughly flat each time — persistent listings suggest the price (not the market) is what's stuck; bring a comps-based counter.
Risks & watch-outs
- Climate carrying-cost: moderate flood risk — expect insurance premiums to compound above CPI over the hold.
Questions for the listing agent
- It's been on market 35 days. Have you received any prior offers? Is the seller open to a 5% concession, seller financing, or rate buy-down credit?
- Built in 1960 — when were the roof, HVAC, electrical panel, plumbing, and water heater last replaced?
- Is there a deadline driving the sale (1031 exchange, divorce, estate, relocation)? That informs how much negotiation room exists.
- Schools are A-rated — typically a magnet for longer-tenancy family renters. What's the average tenant stay here, and is there a school-zone premium baked into asking?
- The area grade is low — what's the realistic commute time and amenity access for the typical tenant pool here? Any planned neighborhood developments (good or bad) we should know about?
- What's the average days-on-market for RENTAL listings here right now (not sales)? A rising rental-DOM trend means longer vacancies and softer asking-rent achievability than the comps imply.
- What's the recent tenant-quality profile in this submarket — average credit score on applications, eviction rate, late-payment / NSF rate, and stable-employment percentage? A property-management company in the area should have these aggregated.
- How much new for-sale + rental construction is in the pipeline within 1–3 miles? Heavy new supply typically softens prices + rents 12–24 months out; constrained supply supports both.
Investment metrics
- 1% rule
- 0.95% ✗
- Cap rate
- 7.35%
- Cash-on-cash
- 3.78%
- DSCR
- 1.17
- GRM
- 8.8
CMA / ARV
- ARV (on-the-fly)
- $414,000
- Comps found
- 2
Show comp detail 2 sales within ~0.75 mi
| Address | Dist | Beds/Ba | Sqft | Sold | Price | $/sf | Match |
|---|---|---|---|---|---|---|---|
| 10067 Lavergne Ave | 0.72mi | 3/1.0 | 1,025 (+2%) | 10mo | $400,000 | $390 | 54 |
| 29 Dale St | 0.75mi | 3/1.0 | 893 (-11%) | 8mo | $370,000 | $414 | 41 |
Match score weights: distance 35% · size 25% · config 20% · recency 20%. Top-matched comps best support the ARV.
Projected returns pro-forma
-3.0% appreciation · 3.0% rent growth · sell at horizon
- IRR
- -10.4%
- Equity multiple
- 0.62×
- Total profit
- $-49,277
- Equity at exit
- $69,333
- IRR
- -1.0%
- Equity multiple
- 0.93×
- Total profit
- $-9,384
- Equity at exit
- $40,205
Cash invested: $130,200 (down + closing). Projections, not guarantees.
Landlord ↔ Tenant lean methodology
- Overall (STATE)
- 43 Moderately Tenant-Leaning
- State Illinois
- 43 Moderately Tenant-Leaning · D+7
- County
- — inherits STATE
- City
- — inherits STATE
ZIP-level market 60091
- Active inventory
- 80
- Price-to-rent
- 8.8×
Monthly cashflow live
- Estimated rent
- $4,414 high interval (Pro) →
- Mortgage (P&I)
- −$2,439
- Tax from tax record
- −$445 /mo · $5,345/yr
- Insurance
- −$194
- HOA
- −$0
- Vacancy / Maint / Mgmt
- −$927
- Net cashflow
- $410
Break-even live
UW: 25.0% down · 7.5% · 30yr · 1.5% tax · 5.0% vac · 8.0% maint · 8.0% mgmt
Financing live
Cash to close
- Down payment
- $116,250
- Closing costs
- $13,950
- Reserves months
- —
- Total cash needed
- —
Loan-product check · same deal, 3 products live
Conventional
25% down · 7.5% · 30yr
- Down + closing
- —
- Monthly P&I
- —
- Monthly cashflow
- —
- DSCR
- —
- Eligible?
- —
Personal DTI + credit; lowest rate.
DSCR
20% down · 8.5% · 30yr
- Down + closing
- —
- Monthly P&I
- —
- Monthly cashflow
- —
- DSCR
- —
- Eligible?
- —
No personal income docs; deal must DSCR.
Hard money
10% down · 12.0% · 12mo
- Down + closing
- —
- Monthly P&I
- —
- Monthly cashflow
- —
- DSCR
- —
- Eligible?
- —
Short-term bridge; refi at stabilization.
Rent comps 6 comps
| Address | Beds | Baths | Sqft | Rent | $/sqft | DOM | Units | Dist |
|---|---|---|---|---|---|---|---|---|
| 3119 Lake Ave Unit E Wilmette, IL | 3.0 | 2.5 | 1458 | $4,147 | $2.84 | 24d | 1 | 0.26mi |
| 1229 26th St Wilmette, IL | 2.0 | 1.0 | 1250 | $4,650 | $3.72 | 3d | 1 | 0.97mi |
| 5424 Old Orchard Rd Skokie, IL | 1.0–4.0 | 1.0–3.5 | 1619 | $5,791 | $3.58 | 1d | 52 | 1.01mi |
| 9739 Woods Dr Skokie, IL | 1.0–3.0 | 1.0–3.0 | 1871 | $6,695 | $3.58 | 1d | 17 | 1.23mi |
| 1937 Wilmette Ave Wilmette, IL | 2.0 | 1.0 | 1350 | $2,500 | $1.85 | 24d | 1 | 1.43mi |
| 1937 Wilmette Ave Unit 2 Wilmette, IL | 2.0 | 1.0 | 1350 | $2,500 | $1.85 | 4d | 1 | 1.43mi |
Listing history 20 events
-
2026-06-18days on market $465,000 Active 35 DOM
-
2026-06-17days on market $465,000 Active 34 DOM
-
2026-06-16days on market $465,000 Active 33 DOM
-
2026-06-15days on market $465,000 Active 32 DOM
-
2026-06-13days on market $465,000 Active 30 DOM
-
2026-06-13days on market $465,000 Active 29 DOM
-
2026-06-09days on market $465,000 Active 26 DOM
-
2026-06-08remarks 339-char remark
-
2026-06-08days on market $465,000 Active 25 DOM
-
2026-06-07days on market $465,000 Active 24 DOM
-
2026-06-04pricedays on market $465,000 Active 21 DOM
-
2026-06-03days on market $479,000 Active 20 DOM
-
2026-06-02days on market $479,000 Active 19 DOM
-
2026-06-01days on market $479,000 Active 18 DOM
-
2026-05-31days on market $479,000 Active 17 DOM
-
2026-05-12$479,000 Active
-
2010-06-17historical
-
2010-04-16price Price Change
-
2010-03-17New
-
2006-04-14soldstatus $405,000
ⓘ Source: listings_history table (triggers on properties + properties_extension) + one-shot
backfill from property_details.listing_events for pre-trigger history.
Tax reassessment forecast IL · Partial reset (capped growth)
- Current annual tax
- $5,345 · $445/mo
- Projected year-2 tax
- $7,950 · $663/mo
- Expected delta
- +$2,605/yr (+$217/mo · 48.7%)
ⓘ Screening estimate from a state-policy table — verify with the county assessor before closing.
Climate risk First Street
- Flood 5/10 Major FEMA zone X (unshaded) · 24% chance over 30 yrs
- Wildfire 1/10 Low
- Heat 2/10 Low 7 d/yr ≥98°F today · 14 d/yr by 30 yrs out
- Wind 2/10 Low 0% chance of damaging wind over 30 yrs
- Air quality 4/10 Moderate 5 unhealthy d/yr today · 5 by 30 yrs out
Nearby sold comps map
Loading sold comps map…
Walkable amenities ~0.75 mi
Loading nearby amenities…
Taxation est. · year 1
- Rental income
- $52,971
- − Mortgage interest
- −$26,047
- − Property taxes
- −$5,345
- − Insurance
- −$2,325
- − Repairs & maintenance
- −$4,238
- − Management
- −$4,238
- − Depreciation
- −$13,527
- Taxable loss
- −$2,748
- Est. tax savings @ 24.0%
- +$660
- After-tax cash flow
- $5,575/yr
For passive investors: Depreciation is non-cash, so a rental often shows a tax loss while cash-flowing — sheltering income. Rental losses are passive: they offset passive income freely, and up to $25,000/yr can offset ordinary (W-2) income if you actively participate and your MAGI is under $100k (phasing out to $0 by $150k); unused losses carry forward. On sale, claimed depreciation is recaptured at up to 25%, and gains may owe capital-gains tax (a 1031 exchange can defer both). Figures are a year-1 estimate at your 24.0% rate — not tax advice; consult a CPA.
Schools (NCES district)
- District
- New Trier Twp Hsd 203
- NCES district ID
- 1728200
- Math proficiency
- 76% ▼ -4.00%
- Reading proficiency
- 80% ▼ -1.00%
- Median HH income
- $164,521
- Composite
- 76.94/100
- National rank
- #103
- State rank
- #2 of 620 in IL
Livability — Wilmette
- Score
- 83/100
- State rank
- #43
- US rank
- #892
Category grades
Schools grade is shown separately in the Schools card above.
Census & demographics
- Census place
- Wilmette, IL
- County
- Cook County · 4,486,803 people
- City population
- 27,333
- Metro
- Chicago-Naperville-Elgin, IL-IN-WI
- Population (ZIP)
- 27,333
- Household income
- $189,909
- Rent vs Own
- Severe rent burden
- 317.0
Population outlook (Cook County) Hauer SSP2
- Today (2025)
- 5,347,519 people
- By 2030
- 5,357,703 · +0.2%
- By 2040
- 5,324,924 · -0.4%
- By 2050
- 5,230,762 · -2.2%
- By 2075
- 4,785,735 · -10.5%
- By 2100
- 4,188,836 · -21.7%
Race, ethnicity, and origin ACS 2023
- Neighborhood character
- Predominantly White (78%)
- Race & ethnicity
- White 78% Asian 12% Two or more races 5% Hispanic / Latino 5%
- Hispanic origin (detail)
- Mexican 2%
- Common ancestry
- Romanian 7% Scotch-Irish 4% Italian 3%
- Foreign-born
- 16% · China, Canada, South Korea
- Languages at home
- 80% English-only · Chinese 5% Russian/Polish/Slavic 3% Other Indo-European 3%
Political lean MEDSL · Cook
- 2024 margin
- Solid D (+42.0) · D 70.4% · R 28.4% · Other 1.2%
- 2008→2024 swing
- -11.4pp toward R · 2008: 53.4pp · 2024: 42.0pp
- All cycles
- 2024: D+42.0 2020: D+50.3 2016: D+53.0 2012: D+49.4 2008: D+53.4
Not yet ingested
- Civics
- —
Market trends
- HPI YoY
- ▼ -420.87%
- Current HPI
- 188.5259
- Rent YoY
- —
- Metro
- Chicago-Naperville-Elgin, IL-IN-WI
- State GDP YoY
- ▲ 1.59%
- F500 in state
- 60
Industry mix (Fortune 500 HQ in IL)
| Industry | F500 HQs | Revenue |
|---|---|---|
| Insurance | 4 | $201B |
|
||
| Consumer Goods | 4 | $87B |
|
||
| Industrial Machinery | 3 | $64B |
|
||
| Healthcare | 2 | $55B |
|
||
| Retail / Pharmacy | 1 | $148B |
|
||
| Agriculture / Food | 1 | $86B |
|
||
Price history
+18.3% since first listed5 events — show timeline
- 2026-05-12 Listed $479,000 MRED as Distributed by MLS Grid
- 2010-06-17 Listing Removed — MRED as Distributed by MLS Grid
- 2010-04-16 Price Changed — MRED as Distributed by MLS Grid
- 2010-03-17 Listed — MRED as Distributed by MLS Grid
- 2006-04-14 Sold (Public Records) $405,000 Public Records
Property tax history
+1.4%/yrLatest (2023): $5,345 · -2.2% YoY. Source: county tax records.
Cash-flow waterfall
monthlySold comps — $/sqft
last 12 mo · ≤1 miLoading sold comps…