5570 NW 61st St #930 · Coconut Creek, FL
Flood risk 1/10 · Minimal
- FEMA flood zone
- X (shaded)
- Chance of flooding over 30 yrs
- 0.0%
- Est. flood insurance / yr
- $507 – $1,088
Fire risk 1/10 · Minimal
- Est. fire insurance / yr
- $947 – $1,759
Heat risk 9/10 · Severe
- Hot days now (above 107°F)
- 7 days/yr
- Hot days in 30 yrs
- 27 days/yr
Wind risk 10/10 · Severe
- Chance of severe wind over 30 yrs
- 99.0%
Air-quality risk 3/10 · Minor
- Unhealthy air days now
- 2 days/yr
- Unhealthy air days in 30 yrs
- 3 days/yr
Risk factors via First Street. Map © Google.
Why this score? — see what drove the D- grade
The composite is a weighted blend of 9 inputs, each scored 0–100. Each bar is that input's sub-score; the figure is the points it added to the 100-point composite (weight × sub-score).
- ARV discount +7.5/15.0
- Cash flow +6.7/30.0
- 1% rule +5.6/10.0
- Appreciation +4.6/10.0
- Livability +4.2/5.0
- Schools +4.1/10.0
- Rent growth +2.9/5.0
- Condition / age +2.5/5.0
- DSCR +0.9/10.0
$186,900
🖨 Deal sheet 📄 Offer letter ✓ Due diligence
Listing remarks
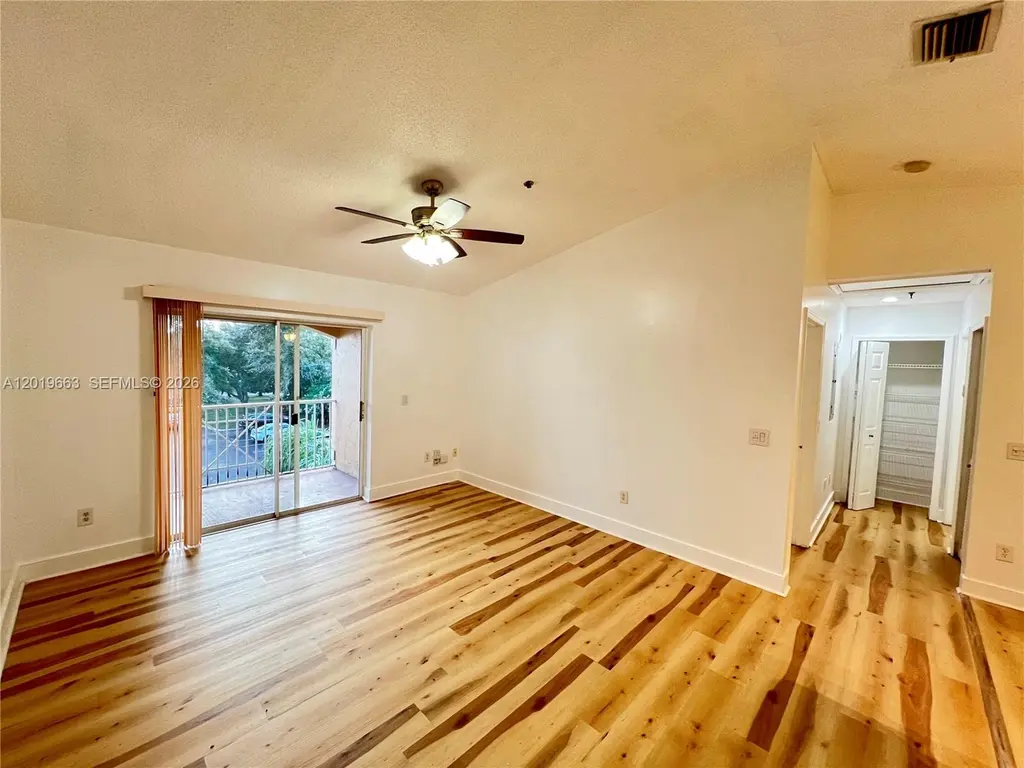
Don't miss this one. Remodeled 1BR/1BA in one of Coconut Creek's most sought-after gated communities. Spacious 846 sq ft unit at Club Caribe features a completely updated kitchen, in-unit washer/dryer, brand-new floors, new AC, and a private balcony flooded with natural light. Move-in ready and turnkey, this is the kind of property that checks every box before you even walk through the door. Perfect for an investor, the first-time buyer building equity, or the snowbird who wants a South Florida retreat that pays for itself. The gated community offers resort-style amenities: a pool, hot tub, tennis court, an updated gym, and a children's playground, all in a pet-friendly community. Located m
Key facts
- Gated community
- Private balcony
- Remodeled kitchen
Tags
Property features AI
Finance
- Financial info: Pets allowed with possible restrictions (conditional)
- HOA & community: Monthly association fee of $477; Association covers amenities, common areas, grounds maintenance, structure maintenance, pool(s), reserve fund, roof, sewer, trash and water; Community amenities include clubhouse, fitness center, playground, pool and elevators
Exterior
- Parking: Guest parking; One assigned space
- Security: Security guard
- Utilities: Water included in association; Sewer included in association; Trash included in association; Power available
- Home design: Attached property; 3-story building; Entry on third floor; Updated/remodeled
- Construction: Block construction; Resale
- Exterior features: Balcony (open); Exterior lighting; Association pool
Interior
- Kitchen: Electric range; Microwave; Dishwasher; Refrigerator
- Flooring: Hardwood; Wood
- Bathrooms: One full bathroom
- Heating & cooling: Central heating; Central air conditioning
- Interior features: Third-floor entry; Hardwood / wood flooring
- Laundry & utility: Washer; Dryer; Electric water heater
Neighborhood map
What this means for you Summary
Snapshot
- This is a 1-bed/1.0-bath condo listed at $187k.
Deal economics
- At list price, monthly cash flow is $-301 ($-4k/yr) — negative.
- To cash-flow at today's rent, offer at most $134k (28.4% below list).
- Meets the 1% rule at list price ($2k rent vs $187k).
- Recommended offer: $134k (28.4% below list) — sets the bar for cash-flow.
Location & tenants
- Location reads 85/100 on livability (#30 in FL, #617 nationally) — a professional / high-income tenant draw. Strengths: commute A+, housing A+, health & safety A+; Watch: amenities F.
- Broward (suburban): math 42% / reading 53% proficiency, ranked #46 of 73 in FL (top 63%) — families likely to look elsewhere, expect single-tenant / working-renter base with shorter leases.
- Market conditions: Rents rising (+1.6%/yr); 150 active listings in the ZIP; 25 comparable units currently listed for rent nearby; rentals at typical pace (median 19d on market — plan ~3-4 weeks tenant-placement turnaround); solid renter incomes; 2,111 units permitted in Broward County in 2024 (1,265 in 5+ unit buildings).
Forward outlook
- Local home prices are declining (-0.8%/yr); year-one equity from $1k of loan paydown is wiped out by about $1k of value loss. Plan a longer hold.
- Broward County population projected at +34% by 2050 — long-run rental-demand tailwind backs the buy-and-hold thesis.
Negotiation context
- It's been on market 34 days — a 3% lower offer ($181k) is reasonable based on typical stale-listing flexibility.
- 4 sale attempts since 3y ago with the ask held roughly flat each time — persistent listings suggest the price (not the market) is what's stuck; bring a comps-based counter.
Risks & watch-outs
- Watch-outs: HOA is 24% of rent.
- Climate carrying-cost: severe wind risk, 99% chance of damaging wind over 30y; extreme-heat days projected 7→27/yr by 2055 (HVAC capex compounding) — expect insurance premiums to compound above CPI over the hold.
Questions for the listing agent
- What do current leases actually rent for vs. the listed asking? Can we see a recent rent roll and the last 12 months of T-12 income?
- It's been on market 34 days. Have you received any prior offers? Is the seller open to a 28% concession, seller financing, or rate buy-down credit?
- What does the HOA fee cover, when was the last increase, and are there any pending special assessments or reserve-fund shortfalls?
- Any open or pending special assessments — roof, HVAC, plumbing, elevator, façade? What's the per-unit balance and payoff schedule, and is the seller paying it off at close or rolling it to the buyer?
- Is there a deadline driving the sale (1031 exchange, divorce, estate, relocation)? That informs how much negotiation room exists.
- Schools are B-rated — typically a magnet for longer-tenancy family renters. What's the average tenant stay here, and is there a school-zone premium baked into asking?
- The area grade is low — what's the realistic commute time and amenity access for the typical tenant pool here? Any planned neighborhood developments (good or bad) we should know about?
- What's the average days-on-market for RENTAL listings here right now (not sales)? A rising rental-DOM trend means longer vacancies and softer asking-rent achievability than the comps imply.
- What's the recent tenant-quality profile in this submarket — average credit score on applications, eviction rate, late-payment / NSF rate, and stable-employment percentage? A property-management company in the area should have these aggregated.
- How much new apartment / multifamily construction is in the pipeline within 1–3 miles? Heavy new supply (>2% of stock underway) typically softens rents 12–24 months out; light construction supports rent growth.
Investment metrics
- 1% rule
- 1.06% ✓
- Cap rate
- 4.36%
- Cash-on-cash
- -6.89%
- DSCR
- 0.69
- GRM
- 7.9
CMA / ARV
No comps found within radius.
Projected returns pro-forma
-0.77% appreciation · 1.64% rent growth · sell at horizon
- IRR
- -14.9%
- Equity multiple
- 0.36×
- Total profit
- $-33,566
- Equity at exit
- $47,177
- IRR
- -9.8%
- Equity multiple
- 0.13×
- Total profit
- $-45,741
- Equity at exit
- $51,318
Cash invested: $52,332 (down + closing). Projections, not guarantees.
Landlord ↔ Tenant lean methodology
- Overall (STATE)
- 87 Strongly Landlord-Friendly
- State Florida
- 87 Strongly Landlord-Friendly · R+3
- County
- — inherits STATE
- City
- — inherits STATE
ZIP-level market 33073
- Home prices YoY
- -0.2%
- Rents YoY
- 1.6%
- Active inventory
- 150
- Price-to-rent
- 7.9×
Monthly cashflow live
- Estimated rent
- $1,975 high interval (Pro) →
- Mortgage (P&I)
- −$980
- Tax from tax record
- −$326 /mo · $3,907/yr
- Insurance
- −$78
- HOA
- −$477
- Vacancy / Maint / Mgmt
- −$415
- Net cashflow
- $-301
Break-even live
UW: 25.0% down · 7.5% · 30yr · 1.5% tax · 5.0% vac · 8.0% maint · 8.0% mgmt
Financing live
Cash to close
- Down payment
- $46,725
- Closing costs
- $5,607
- Reserves months
- —
- Total cash needed
- —
Loan-product check · same deal, 3 products live
Conventional
25% down · 7.5% · 30yr
- Down + closing
- —
- Monthly P&I
- —
- Monthly cashflow
- —
- DSCR
- —
- Eligible?
- —
Personal DTI + credit; lowest rate.
DSCR
20% down · 8.5% · 30yr
- Down + closing
- —
- Monthly P&I
- —
- Monthly cashflow
- —
- DSCR
- —
- Eligible?
- —
No personal income docs; deal must DSCR.
Hard money
10% down · 12.0% · 12mo
- Down + closing
- —
- Monthly P&I
- —
- Monthly cashflow
- —
- DSCR
- —
- Eligible?
- —
Short-term bridge; refi at stabilization.
Rent comps 25 comps
| Address | Beds | Baths | Sqft | Rent | $/sqft | DOM | Units | Dist |
|---|---|---|---|---|---|---|---|---|
| 5570 NW 61st St #902 Coconut Creek, FL | 2.0 | 1.0 | 1015 | $1,900 | $1.87 | 20d | 1 | 0.03mi |
| 5580 NW 61st St #627 Coconut Creek, FL | 1.0 | 1.0 | 846 | $1,700 | $2.01 | 20d | 1 | 0.06mi |
| 5590 NW 61st St #832 Coconut Creek, FL | 1.0 | 1.0 | 846 | $1,700 | $2.01 | 20d | 1 | 0.07mi |
| 5620 NW 61st St #1201 Coconut Creek, FL | 2.0 | 1.0 | 1015 | $2,200 | $2.17 | 24d | 1 | 0.10mi |
| 5500 NW 61st St Unit 04 402 Coconut Creek, FL | 2.0 | 1.0 | 1015 | $2,075 | $2.04 | 20d | 1 | 0.13mi |
| 5500 NW 61st St Unit 13 Coconut Creek, FL | 2.0 | 1.0 | 1015 | $2,075 | $2.04 | 3d | 1 | 0.13mi |
| 6112 N State Road 7 Coconut Creek, FL | 1.0–3.0 | 1.0–2.0 | 1164 | $2,195 | $1.89 | 3d | 34 | 0.27mi |
| 5400 NW 55th Blvd Coconut Creek, FL | 1.0 | 1.0 | 1057 | $2,120 | $2.01 | 4d | 1 | 0.40mi |
| 5400 NW 55th Blvd Coconut Creek, FL | 1.0 | 1.0 | 1057 | $2,102 | $1.99 | 22d | 1 | 0.40mi |
| 5400 Lyons Rd Coconut Creek, FL | 1.0–3.0 | 1.0–2.0 | 1072 | $1,758 | $1.64 | 2d | 47 | 0.83mi |
| 4840 N State Road 7 #6101 Coconut Creek, FL | 1.0 | 1.0 | 703 | $1,700 | $2.42 | 24d | 1 | 0.84mi |
| 4836 N State Road 7 #5207 Coconut Creek, FL | 1.0 | 1.0 | 703 | $1,800 | $2.56 | 24d | 1 | 0.87mi |
| 4856 N State Road 7 Coconut Creek, FL | 2.0 | 2.5 | 967 | $2,250 | $2.33 | 24d | 1 | 0.88mi |
| 4856 N State Road 7 #1303 Coconut Creek, FL | 2.0 | 2.0 | 967 | $2,295 | $2.37 | 24d | 1 | 0.91mi |
| 4856 N State Road 7 #1207 Coconut Creek, FL | 2.0 | 2.0 | 967 | $2,350 | $2.43 | 24d | 1 | 0.91mi |
| 5851 Holmberg Rd Parkland, FL | 1.0–3.0 | 1.0–2.5 | 1255 | $2,042 | $1.63 | 3d | 32 | 0.91mi |
| 4828 N State Road 7 #8205 Coconut Creek, FL | 2.0 | 2.0 | 967 | $2,250 | $2.33 | 24d | 1 | 0.94mi |
| 4828 N State Road 7 #8306 Coconut Creek, FL | 2.0 | 2.0 | 967 | $2,200 | $2.28 | 5d | 1 | 0.94mi |
| 4808 N State Road 7 #13201 Coconut Creek, FL | 1.0 | 1.0 | 684 | $1,700 | $2.49 | 16d | 1 | 0.96mi |
| 4812 N State Road 7 #12202 Coconut Creek, FL | 1.0 | 1.0 | 703 | $1,700 | $2.42 | 7d | 1 | 0.98mi |
| 5401 Wiles Rd Coconut Creek, FL | 1.0–3.0 | 1.0–2.0 | 1078 | $2,200 | $2.04 | 2d | 1 | 1.07mi |
| 5001 Wiles Rd #105 Coconut Creek, FL | 1.0 | 1.0 | 778 | $1,800 | $2.31 | 18d | 1 | 1.11mi |
| 5201 W Hillsboro Blvd Coconut Creek, FL | 1.0–3.0 | 1.0–2.0 | 1072 | $2,029 | $1.89 | 1d | 28 | 1.16mi |
| 6150 Wiles Rd Coral Springs, FL | 1.0–3.0 | 1.0–2.0 | 1115 | $1,960 | $1.76 | 2d | 16 | 1.32mi |
| 5800 NW 74th Pl Coconut Creek, FL | 1.0–2.0 | 1.0–2.0 | 1115 | $1,955 | $1.75 | 2d | 17 | 1.45mi |
HOA detail condo
- Monthly dues
- $477 · $5,724/yr
- Likely covers
- poolgymsecurity
- Assessments
- None detected in remarks — confirm with the listing agent.
Listing history 26 events
-
2026-06-18days on market $186,900 Active 34 DOM
-
2026-06-17days on market $186,900 Active 33 DOM
-
2026-06-16days on market $186,900 Active 32 DOM
-
2026-06-15days on market $186,900 Active 31 DOM
-
2026-06-13days on market $186,900 Active 29 DOM
-
2026-06-09days on market $186,900 Active 25 DOM
-
2026-06-08days on market $186,900 Active 24 DOM
-
2026-06-07days on market $186,900 Active 23 DOM
-
2026-06-04days on market $186,900 Active 20 DOM
-
2026-06-03days on market $186,900 Active 19 DOM
-
2026-06-02days on market $186,900 Active 18 DOM
-
2026-06-01days on market $186,900 Active 17 DOM
-
2026-05-31days on market $186,900 Active 16 DOM
-
2026-05-15historical
-
2026-05-15$186,900 Active
-
2026-05-14price $186,900
-
2026-04-27price $189,900
-
2026-04-10price $199,900
-
2026-03-26$204,900 Active
-
2024-03-29historical $1,750
-
2024-03-13$1,750
-
2024-03-09historical $1,750
-
2024-02-14price $1,750
-
2024-01-18price $1,845
-
2024-01-11price $1,895
-
2023-12-31$1,995
ⓘ Source: listings_history table (triggers on properties + properties_extension) + one-shot
backfill from property_details.listing_events for pre-trigger history.
Tax reassessment forecast FL · Resets to sale price
- Current annual tax
- $3,907 · $326/mo
- Projected year-2 tax
- $3,907 · $326/mo
- Expected delta
- $0/yr ($0/mo · 0.0%)
ⓘ Screening estimate from a state-policy table — verify with the county assessor before closing.
Climate risk First Street
- Flood 1/10 Low FEMA zone X (shaded) · 0% chance over 30 yrs
- Wildfire 1/10 Low
- Heat 9/10 Extreme 7 d/yr ≥107°F today · 27 d/yr by 30 yrs out
- Wind 10/10 Extreme 99% chance of damaging wind over 30 yrs
- Air quality 3/10 Moderate 2 unhealthy d/yr today · 3 by 30 yrs out
Nearby sold comps map
Loading sold comps map…
Walkable amenities ~0.75 mi
Loading nearby amenities…
Taxation est. · year 1
- Rental income
- $23,696
- − Mortgage interest
- −$10,469
- − Property taxes
- −$3,907
- − Insurance
- −$934
- − Repairs & maintenance
- −$1,896
- − Management
- −$1,896
- − HOA
- −$5,724
- − Depreciation
- −$5,437
- Taxable loss
- −$6,567
- Est. tax savings @ 24.0%
- +$1,576
- After-tax cash flow
- $-2,031/yr
For passive investors: Depreciation is non-cash, so a rental often shows a tax loss while cash-flowing — sheltering income. Rental losses are passive: they offset passive income freely, and up to $25,000/yr can offset ordinary (W-2) income if you actively participate and your MAGI is under $100k (phasing out to $0 by $150k); unused losses carry forward. On sale, claimed depreciation is recaptured at up to 25%, and gains may owe capital-gains tax (a 1031 exchange can defer both). Figures are a year-1 estimate at your 24.0% rate — not tax advice; consult a CPA.
Schools (NCES district)
- District
- Broward
- NCES district ID
- 1200180
- Math proficiency
- 42% ▼ -18.00%
- Reading proficiency
- 53% ▼ -5.00%
- Median HH income
- $52,139
- Composite
- 40.88/100
- National rank
- #3621
- State rank
- #46 of 73 in FL
Livability — Coconut Creek
- Score
- 85/100
- State rank
- #30
- US rank
- #617
Category grades
Schools grade is shown separately in the Schools card above.
Census & demographics
- Census place
- Coconut Creek, FL
- County
- Broward County · 1,963,430 people
- City population
- 50,557
- Metro
- Miami-Fort Lauderdale-Pompano Beach, FL
- Population (ZIP)
- 33,838
- Household income
- $97,412
- Rent vs Own
- Severe rent burden
- 1109.0
Population outlook (Broward County) Hauer SSP2
- Today (2025)
- 2,207,033 people
- By 2030
- 2,360,704 · +7.0%
- By 2040
- 2,661,208 · +20.6%
- By 2050
- 2,946,698 · +33.5%
- By 2075
- 3,602,273 · +63.2%
- By 2100
- 3,970,984 · +79.9%
Race, ethnicity, and origin ACS 2023
- Neighborhood character
- Highly diverse neighborhood (Simpson 0.70)
- Race & ethnicity
- White 43% Hispanic / Latino 28% Two or more races 18% Black 17% Asian 3%
- Hispanic origin (detail)
- Mexican 2% Puerto Rican 4% Cuban 4% Dominican 2%
- Common ancestry
- Estonian 6% Hispanic 3% Romanian 2%
- Foreign-born
- 35% · Canada, Jamaica, China
- Languages at home
- 58% English-only · Spanish 23% Other Indo-European 11% French/Haitian/Cajun 4%
Political lean MEDSL · Broward
- 2024 margin
- D (+17.0) · D 58.0% · R 41.0%
- 2008→2024 swing
- -17.8pp toward R · 2008: 34.7pp · 2024: 17.0pp
- All cycles
- 2024: D+17.0 2020: D+29.8 2016: D+35.0 2012: D+34.9 2008: D+34.7
Not yet ingested
- Civics
- —
Market trends
- HPI YoY
- ▼ -0.77%
- Current HPI
- 337.0725
- Rent YoY
- ▲ 1.64%
- Metro
- Miami-Fort Lauderdale-Pompano Beach, FL
- State GDP YoY
- ▲ 3.28%
- F500 in state
- 36
Industry mix (Fortune 500 HQ in FL)
| Industry | F500 HQs | Revenue |
|---|---|---|
| Industrial Technology | 2 | $29B |
|
||
| Insurance | 2 | $17B |
|
||
| Retail | 1 | $60B |
|
||
| Technology Distribution | 1 | $58B |
|
||
| Homebuilding | 1 | $35B |
|
||
| Technology Manufacturing | 1 | $35B |
|
||
Price history
+9268.4% since first listed13 events — show timeline
- 2026-05-15 Listed $186,900 MARMLS
- 2026-05-15 Listing Removed — MARMLS
- 2026-05-14 Price Changed $186,900 MARMLS
- 2026-04-27 Price Changed $189,900 MARMLS
- 2026-04-10 Price Changed $199,900 MARMLS
- 2026-03-26 Listed $204,900 MARMLS
- 2024-03-29 Rental Removed $1,750 MARMLS
- 2024-03-13 Listed for Rent $1,750 MARMLS
- 2024-03-09 Rental Removed $1,750 MARMLS
- 2024-02-14 Price Changed $1,750 MARMLS
- 2024-01-18 Price Changed $1,845 MARMLS
- 2024-01-11 Price Changed $1,895 MARMLS
- 2023-12-31 Listed for Rent $1,995 MARMLS
Property tax history
+10.3%/yrLatest (2025): $3,907 · +1.3% YoY. Source: county tax records.
Cash-flow waterfall
monthlySold comps — $/sqft
last 12 mo · ≤1 miLoading sold comps…