 🏗️ New Construction
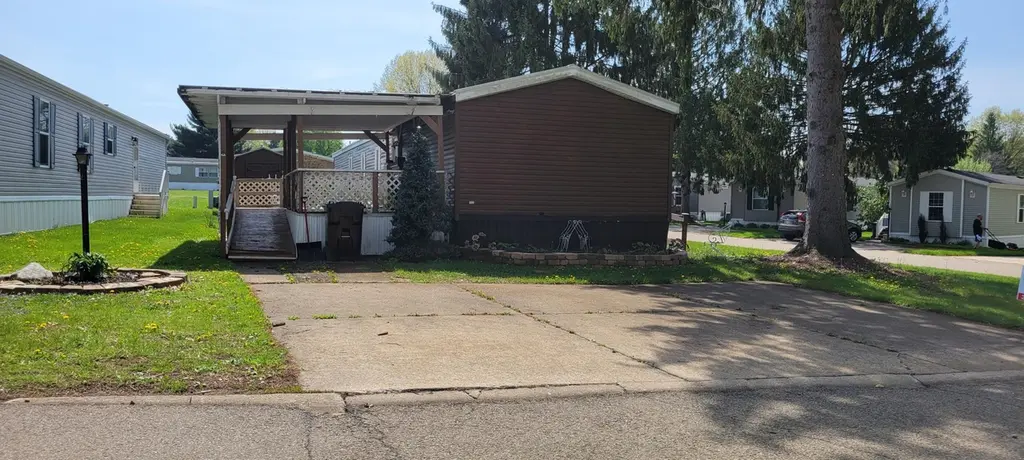
FAIRMONT Melrose Village Plan · Wooster, OH
Flood risk 1/10 · Minimal
- FEMA flood zone
- X (unshaded)
- Chance of flooding over 30 yrs
- 0.0%
- Est. flood insurance / yr
- $507 – $1,088
Fire risk 1/10 · Minimal
- Est. fire insurance / yr
- $713 – $1,323
Heat risk 3/10 · Minor
- Hot days now (above 98°F)
- 7 days/yr
- Hot days in 30 yrs
- 15 days/yr
Wind risk 2/10 · Minimal
- Chance of severe wind over 30 yrs
- —
Air-quality risk 2/10 · Minimal
- Unhealthy air days now
- 0 days/yr
- Unhealthy air days in 30 yrs
- 1 days/yr
Risk factors via First Street. Map © Google.
Why this score? — see what drove the B grade
The composite is a weighted blend of 9 inputs, each scored 0–100. Each bar is that input's sub-score; the figure is the points it added to the 100-point composite (weight × sub-score).
- Cash flow +30.0/30.0
- 1% rule +10.0/10.0
- DSCR +10.0/10.0
- ARV discount +7.5/15.0
- Rent growth +4.6/5.0
- Schools +4.4/10.0
- Livability +3.9/5.0
- Condition / age +2.2/5.0
- Appreciation +0.0/10.0
$48,500
🖨 Deal sheet 📄 Offer letter ✓ Due diligence
Listing remarks
Financing for this specific property is not available through the UMH Sales and Finance COP Financing program. This 3 bed/2 bath home is for sale. The home includes wood cabinets, new metal roof, new flooring and carpeting, furnace is 2 years old and been maintained. Please call our office to schedule a viewing of this home. Improvements 2023: New gas furnace, new upgraded windows and sills, new flooring and carpet. Improvements 2024: New Roof, new paint, and insulated pipes. Extras: Covered porch, heated/electric 8X10 shed, remodled master bath with walk-in shower, walk in closet, appliances side by side fridge, stove, old washer and dryer if wanted, and any furniture if wanted.
Key facts
- Covered porch
- New metal roof
- Insulated pipes
Tags
Neighborhood map
What this means for you Summary
Snapshot
- This is a 3-bed/2.0-bath manufactured listed at $48k. Condition is rated fair.
Deal economics
- At list price, monthly cash flow is $1k ($12k/yr) — positive.
- The deal already cash-flows at list — no discount required.
- Meets the 1% rule at list price ($2k rent vs $48k).
- Recommended offer: $47k (3.0% below list) — sets the bar for market timing.
- Cap rate 31.9% vs local median 3.2% in Wooster — top-decile yield for the area; either an underpriced asset or a hidden risk that comps aren't pricing in. Stress-test before assuming the spread holds.
Location & tenants
- Location reads 77/100 on livability (#195 in OH, #3,001 nationally) — a middle-class / working-renter tenant base. Strengths: cost of living A+, housing A+, health & safety A+; Watch: employment D+, amenities D-, commute F.
- Wooster City (town): math 47% / reading 57% proficiency, ranked #422 of 656 in OH (top 64%) — acceptable for families but not a draw, mixed tenant base, ~2y average lease.
- Market conditions: Rents rising fast (+8.4%/yr); 154 active listings in the ZIP; 2 comparable units currently listed for rent nearby; 284 units permitted in Wayne County in 2024 (42 in 5+ unit buildings).
Forward outlook
- Local home prices are declining (-3.0%/yr); year-one equity from $335 of loan paydown is wiped out by about $1k of value loss. Plan a longer hold.
- Wayne County population projected to shrink 6% by 2050 — rents likely to lag national; underwrite the cash flow, not the appreciation.
- At projected returns (-3.0% appreciation + 8.0% rent growth), your $14k cash investment doubles in ~2 years — after that, you're playing with house money.
Negotiation context
- It's been on market 52 days — a 3% lower offer ($47k) is reasonable based on typical stale-listing flexibility.
Questions for the listing agent
- It's been on market 52 days. Have you received any prior offers? Is the seller open to a 3% concession, seller financing, or rate buy-down credit?
- Have any recent inspections been done? Can we get a copy of the seller's disclosures and any deferred-maintenance estimates?
- Is there a deadline driving the sale (1031 exchange, divorce, estate, relocation)? That informs how much negotiation room exists.
- Schools are B-rated — typically a magnet for longer-tenancy family renters. What's the average tenant stay here, and is there a school-zone premium baked into asking?
- What's the average days-on-market for RENTAL listings here right now (not sales)? A rising rental-DOM trend means longer vacancies and softer asking-rent achievability than the comps imply.
- What's the recent tenant-quality profile in this submarket — average credit score on applications, eviction rate, late-payment / NSF rate, and stable-employment percentage? A property-management company in the area should have these aggregated.
- How much new for-sale + rental construction is in the pipeline within 1–3 miles? Heavy new supply typically softens prices + rents 12–24 months out; constrained supply supports both.
Investment metrics
- 1% rule
- 3.58% ✓
- Cap rate
- 31.93%
- Cash-on-cash
- 91.58%
- DSCR
- 5.07
- GRM
- 2.3
CMA / ARV
No comps found within radius.
Projected returns pro-forma
-3.0% appreciation · 8.0% rent growth · sell at horizon
- IRR
- 97.9%
- Equity multiple
- 5.96×
- Total profit
- $67,349
- Equity at exit
- $7,232
- IRR
- —
- Equity multiple
- 14.66×
- Total profit
- $185,505
- Equity at exit
- $4,193
Cash invested: $13,580 (down + closing). Projections, not guarantees.
Landlord ↔ Tenant lean methodology
- Overall (STATE)
- 73 Landlord-Friendly
- State Ohio
- 73 Landlord-Friendly · R+6
- County
- — inherits STATE
- City
- — inherits STATE
ZIP-level market 44691
- Rents YoY
- 8.4%
- Active inventory
- 154
- Price-to-rent
- 2.3×
Monthly cashflow live
- Estimated rent
- $1,736 medium interval (Pro) →
- Mortgage (P&I)
- −$254
- Tax est. 1.5%
- −$61 /mo · $728/yr
- Insurance
- −$20
- HOA
- −$0
- Vacancy / Maint / Mgmt
- −$365
- Net cashflow
- $1,036
Break-even live
UW: 25.0% down · 7.5% · 30yr · 1.5% tax · 5.0% vac · 8.0% maint · 8.0% mgmt
Financing live
Cash to close
- Down payment
- $12,125
- Closing costs
- $1,455
- Reserves months
- —
- Total cash needed
- —
Loan-product check · same deal, 3 products live
Conventional
25% down · 7.5% · 30yr
- Down + closing
- —
- Monthly P&I
- —
- Monthly cashflow
- —
- DSCR
- —
- Eligible?
- —
Personal DTI + credit; lowest rate.
DSCR
20% down · 8.5% · 30yr
- Down + closing
- —
- Monthly P&I
- —
- Monthly cashflow
- —
- DSCR
- —
- Eligible?
- —
No personal income docs; deal must DSCR.
Hard money
10% down · 12.0% · 12mo
- Down + closing
- —
- Monthly P&I
- —
- Monthly cashflow
- —
- DSCR
- —
- Eligible?
- —
Short-term bridge; refi at stabilization.
Rent comps 2 comps
| Address | Beds | Baths | Sqft | Rent | $/sqft | DOM | Units | Dist |
|---|---|---|---|---|---|---|---|---|
| 4715 Young Dr Wooster, OH | 2.0 | 2.0 | 1000 | $1,550 | $1.55 | 44d | 1 | 0.47mi |
| 3574 Melrose Dr Wooster, OH | 2.0 | 2.0 | 1161 | $1,720 | $1.48 | 2d | 3 | 0.77mi |
Listing history 14 events
-
2026-06-16days on market $48,500 Active 52 DOM
-
2026-06-15days on market $48,500 Active 51 DOM
-
2026-06-14days on market $48,500 Active 49 DOM
-
2026-06-12days on market $48,500 Active 48 DOM
-
2026-06-09days on market $48,500 Active 45 DOM
-
2026-06-08days on market $48,500 Active 44 DOM
-
2026-06-07days on market $48,500 Active 43 DOM
-
2026-06-05days on market $48,500 Active 40 DOM
-
2026-06-03days on market $48,500 Active 39 DOM
-
2026-06-02days on market $48,500 Active 38 DOM
-
2026-06-01days on market $48,500 Active 37 DOM
-
2026-05-31days on market $48,500 Active 36 DOM
-
2026-05-30days on market $48,500 Active 35 DOM
-
2026-04-25$48,500 Active 688-char remark
ⓘ Source: listings_history table (triggers on properties + properties_extension) + one-shot
backfill from property_details.listing_events for pre-trigger history.
Climate risk First Street
- Flood 1/10 Low FEMA zone X (unshaded) · 0% chance over 30 yrs
- Wildfire 1/10 Low
- Heat 3/10 Moderate 7 d/yr ≥98°F today · 15 d/yr by 30 yrs out
- Wind 2/10 Low
- Air quality 2/10 Low 0 unhealthy d/yr today · 1 by 30 yrs out
Nearby sold comps map
Loading sold comps map…
Walkable amenities ~0.75 mi
Loading nearby amenities…
Taxation est. · year 1
- Rental income
- $20,833
- − Mortgage interest
- −$2,717
- − Property taxes
- −$728
- − Insurance
- −$242
- − Repairs & maintenance
- −$1,667
- − Management
- −$1,667
- − Depreciation
- −$1,411
- Taxable income
- $12,402
- Est. tax owed @ 24.0%
- −$2,977
- After-tax cash flow
- $9,460/yr
For passive investors: Depreciation is non-cash, so a rental often shows a tax loss while cash-flowing — sheltering income. Rental losses are passive: they offset passive income freely, and up to $25,000/yr can offset ordinary (W-2) income if you actively participate and your MAGI is under $100k (phasing out to $0 by $150k); unused losses carry forward. On sale, claimed depreciation is recaptured at up to 25%, and gains may owe capital-gains tax (a 1031 exchange can defer both). Figures are a year-1 estimate at your 24.0% rate — not tax advice; consult a CPA.
Condition & rehab AI · 12 photos
This manufactured home requires moderate renovations, including painting, replacing appliances and fixtures, and landscaping, to improve its resale and rental value.
Repairs flagged
- Minor Kitchen cabinets — Worn but still functional
- Minor Kitchen appliances — Old and dated
- Minor Bathroom fixtures — Old and dated
- Minor Landscaping — Overgrown areas
Value-add opportunities
- Resale Paint interior walls — Fresh paint enhances curb appeal
- Resale Replace kitchen appliances — Modern appliances improve functionality
- Resale Replace bathroom fixtures — Modern fixtures enhance functionality and appeal
- Both Landscaping — Well-maintained landscaping improves curb appeal and enhances property value
Renovation cost estimate screening
| Repair item | Severity | Est. cost |
|---|---|---|
| Kitchen cabinets · Worn but still functional | Minor | $500–3,000 |
| Kitchen appliances · Old and dated | Minor | $500–3,000 |
| Bathroom fixtures · Old and dated | Minor | $500–3,000 |
| Landscaping · Overgrown areas | Minor | $500–3,000 |
| Total estimated repair cost · 4 items | $2,000–12,000 |
Value-add ROI direction
- Resale Paint interior walls — Fresh paint enhances curb appeal ↑
- Resale Replace kitchen appliances — Modern appliances improve functionality ↑
- Resale Replace bathroom fixtures — Modern fixtures enhance functionality and appeal ↑
- Both Landscaping — Well-maintained landscaping improves curb appeal and enhances property value ↑
ⓘ Cost ranges are severity-bucket heuristics (US national rule-of-thumb). Get contractor quotes + a written scope before underwriting a rehab budget.
Schools (NCES district)
- District
- Wooster City
- NCES district ID
- 3910032
- Math proficiency
- 47% ▼ -24.00%
- Reading proficiency
- 57% ▼ -11.00%
- Median HH income
- $43,805
- Composite
- 43.82/100
- National rank
- #2928
- State rank
- #422 of 656 in OH
Livability — Wooster
- Score
- 77/100
- State rank
- #195
- US rank
- #3001
Category grades
Schools grade is shown separately in the Schools card above.
Census & demographics
- Census place
- Wooster, OH
- County
- Wayne County · 44,344 people
- City population
- 44,344
- Metro
- Wooster, OH
- Population (ZIP)
- 44,344
- Household income
- $69,920
- Rent vs Own
- Severe rent burden
- 844.0
Population outlook (Wayne County) Hauer SSP2
- Today (2025)
- 116,616 people
- By 2030
- 116,214 · -0.3%
- By 2040
- 113,891 · -2.3%
- By 2050
- 109,009 · -6.5%
- By 2075
- 94,622 · -18.9%
- By 2100
- 70,577 · -39.5%
Race, ethnicity, and origin ACS 2023
- Neighborhood character
- Predominantly White (90%)
- Race & ethnicity
- White 90% Two or more races 5% Hispanic / Latino 2% Black 2% Asian 1%
- Common ancestry
- Romanian 3% Slovak 3% Lithuanian 2%
- Foreign-born
- 4% · Canada
- Languages at home
- 92% English-only · German/W. Germanic 3% Spanish 1% Other Indo-European 1%
Political lean MEDSL · Wayne
- 2024 margin
- Solid R (+39.3) · D 29.9% · R 69.2%
- 2008→2024 swing
- -24.6pp toward R · 2008: -14.6pp · 2024: -39.3pp
- All cycles
- 2024: R+39.3 2020: R+37.0 2016: R+34.9 2012: R+21.3 2008: R+14.6
Not yet ingested
- Civics
- —
Market trends
- HPI YoY
- ▼ -174.13%
- Current HPI
- 231.7627
- Rent YoY
- ▲ 8.42%
- Metro
- Wooster, OH
- State GDP YoY
- ▲ 1.98%
- F500 in state
- 48
Industry mix (Fortune 500 HQ in OH)
| Industry | F500 HQs | Revenue |
|---|---|---|
| Insurance | 3 | $145B |
|
||
| Industrial Machinery | 3 | $49B |
|
||
| Financial Services | 3 | $24B |
|
||
| Consumer Goods | 2 | $93B |
|
||
| Aerospace / Defense | 2 | $47B |
|
||
| Utilities | 2 | $33B |
|
||
Cash-flow waterfall
monthlySold comps — $/sqft
last 12 mo · ≤1 miLoading sold comps…