4 Northwest #4 · Sudbury, MA
Flood risk 4/10 · Minor
- FEMA flood zone
- X (shaded)
- Chance of flooding over 30 yrs
- 0.23%
- Est. flood insurance / yr
- $507 – $1,088
Fire risk 3/10 · Minor
- Est. fire insurance / yr
- $915 – $1,699
Heat risk 5/10 · Moderate
- Hot days now (above 97°F)
- 7 days/yr
- Hot days in 30 yrs
- 15 days/yr
Wind risk 6/10 · Moderate
- Chance of severe wind over 30 yrs
- 27.0%
Air-quality risk 2/10 · Minimal
- Unhealthy air days now
- 1 days/yr
- Unhealthy air days in 30 yrs
- 2 days/yr
Risk factors via First Street. Map © Google.
Why this score? — see what drove the C grade
The composite is a weighted blend of 9 inputs, each scored 0–100. Each bar is that input's sub-score; the figure is the points it added to the 100-point composite (weight × sub-score).
- Cash flow +20.5/30.0
- ARV discount +7.5/15.0
- Schools +7.0/10.0
- DSCR +6.5/10.0
- 1% rule +5.4/10.0
- Condition / age +4.0/5.0
- Rent growth +3.2/5.0
- Livability +2.5/5.0
- Appreciation +0.0/10.0
$265,000
🖨 Deal sheet 📄 Offer letter ✓ Due diligence
Listing remarks
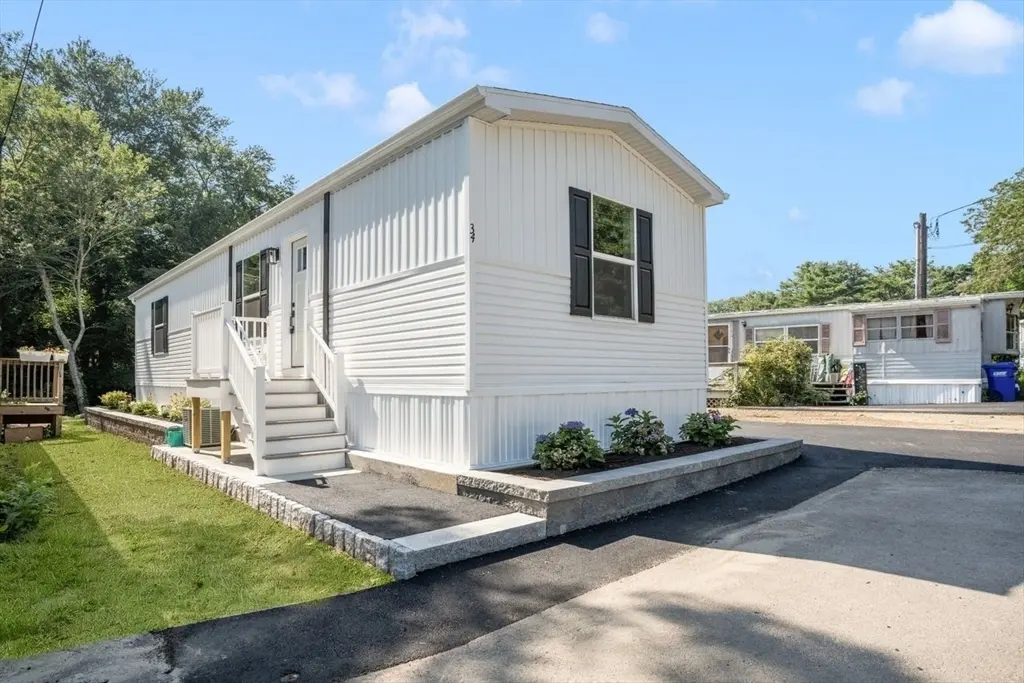
Located in a sought after 55+ community, this spacious single-wide home offers the perfect blend of comfort and convenience. Featuring 2 bedrooms, and 2 full bathrooms, this home is designed for easy living. The kitchen is fit for a chef and comes fully equipped. Step into an open layout concept, and an oversized living room with lots of natural light. The primary bedroom offers an en-suite bathroom with a walk-in shower. The second bedroom has easy access to the second full bath. Outside, you can relax on the large composite deck while enjoying the peaceful surroundings. Some floor plans may vary. The home is completely turn key with central air, a driveway for 2 vehicles, and a shed. Home
Key facts
- Energy star rated
- Open layout concept
- Large composite deck
Tags
Property features AI
Finance
- HOA & community: Has association; Located in a senior community; Nearby community features: public transportation, shopping, park, laundromat, bike path, highway access, public school access, T-Station
Exterior
- Parking: Paved driveway with 2 open parking spaces
- Utilities: Public water; Public sewer; 100 amp electric service
- Home design: Mobile home; Above-grade living area listed
- Construction: Shingle roof; Slab foundation; Year built (owner reported)
- Exterior features: Composite deck; Rain gutters
Interior
- Kitchen: Range; Dishwasher; Microwave; Refrigerator
- Bedrooms: Master bedroom approximately 11 x 14; Second bedroom approximately 7 x 14
- Bathrooms: 2 full bathrooms; Master bathroom included
- Heating & cooling: Forced air heating; Central air conditioning; Heating available
- Interior features: Total of 4 rooms
- Laundry & utility: Washer; Dryer
Neighborhood map
What this means for you Summary
Snapshot
- This is a 2-bed/2.0-bath manufactured listed at $265k. Condition is rated good.
Deal economics
- At list price, monthly cash flow is $351 ($4k/yr) — positive.
- The deal already cash-flows at list — no discount required.
- Meets the 1% rule at list price ($3k rent vs $265k).
- Recommended offer: $257k (3.0% below list) — sets the bar for market timing.
Location & tenants
- Location reads: area grade C — affects rentability + tenant quality, not the cash-flow math above.
- Sudbury (suburban): math 67% / reading 73% proficiency, ranked #12 of 302 in MA (top 4%) — strong family-tenant draw, lease renewals of 3-5y typical; only 4% free/reduced lunch — higher-income household profile.
- Market conditions: Rents rising (+2.9%/yr); 37 active listings in the ZIP; 2 comparable units currently listed for rent nearby; high-income renter base; 3,670 units permitted in Middlesex County in 2024 (2,611 in 5+ unit buildings).
Forward outlook
- Local home prices are declining (-3.0%/yr); year-one equity from $2k of loan paydown is wiped out by about $8k of value loss. Plan a longer hold.
- Middlesex County population projected at +20% by 2050 — long-run rental-demand tailwind backs the buy-and-hold thesis.
Negotiation context
- It's been on market 34 days — a 3% lower offer ($257k) is reasonable based on typical stale-listing flexibility.
Risks & watch-outs
- Climate carrying-cost: major wind risk, 27% chance of damaging wind over 30y; extreme-heat days projected 7→15/yr by 2055 (HVAC capex compounding) — expect insurance premiums to compound above CPI over the hold.
Questions for the listing agent
- It's been on market 34 days. Have you received any prior offers? Is the seller open to a 3% concession, seller financing, or rate buy-down credit?
- Is there a deadline driving the sale (1031 exchange, divorce, estate, relocation)? That informs how much negotiation room exists.
- What's the average days-on-market for RENTAL listings here right now (not sales)? A rising rental-DOM trend means longer vacancies and softer asking-rent achievability than the comps imply.
- What's the recent tenant-quality profile in this submarket — average credit score on applications, eviction rate, late-payment / NSF rate, and stable-employment percentage? A property-management company in the area should have these aggregated.
- How much new for-sale + rental construction is in the pipeline within 1–3 miles? Heavy new supply typically softens prices + rents 12–24 months out; constrained supply supports both.
Investment metrics
- 1% rule
- 1.04% ✓
- Cap rate
- 7.88%
- Cash-on-cash
- 5.68%
- DSCR
- 1.25
- GRM
- 8.0
CMA / ARV
- ARV (on-the-fly)
- $147,000
- Comps found
- 1
Show comp detail 1 sale within ~0.75 mi
| Address | Dist | Beds/Ba | Sqft | Sold | Price | $/sf | Match |
|---|---|---|---|---|---|---|---|
| 15 Quaboag Valley Co-op St #15 | 0.00mi | 2/2.0 | 924 (+10%) | 2mo | $162,000 | $175 | 82 |
Match score weights: distance 35% · size 25% · config 20% · recency 20%. Top-matched comps best support the ARV.
Projected returns pro-forma
-3.0% appreciation · 2.88% rent growth · sell at horizon
- IRR
- -7.6%
- Equity multiple
- 0.72×
- Total profit
- $-20,879
- Equity at exit
- $39,512
- IRR
- 1.8%
- Equity multiple
- 1.13×
- Total profit
- $9,408
- Equity at exit
- $22,912
Cash invested: $74,200 (down + closing). Projections, not guarantees.
Landlord ↔ Tenant lean methodology
- Overall (STATE)
- 20 Strongly Tenant-Friendly
- State Massachusetts
- 20 Strongly Tenant-Friendly · D+15
- County
- — inherits STATE
- City
- — inherits STATE
ZIP-level market 02760
- Rents YoY
- 2.9%
- Active inventory
- 37
- Price-to-rent
- 8.0×
Monthly cashflow live
- Estimated rent
- $2,762 medium interval (Pro) →
- Mortgage (P&I)
- −$1,390
- Tax est. 1.5%
- −$331 /mo · $3,975/yr
- Insurance
- −$110
- HOA
- −$0
- Vacancy / Maint / Mgmt
- −$580
- Net cashflow
- $351
Break-even live
UW: 25.0% down · 7.5% · 30yr · 1.5% tax · 5.0% vac · 8.0% maint · 8.0% mgmt
Financing live
Cash to close
- Down payment
- $66,250
- Closing costs
- $7,950
- Reserves months
- —
- Total cash needed
- —
Loan-product check · same deal, 3 products live
Conventional
25% down · 7.5% · 30yr
- Down + closing
- —
- Monthly P&I
- —
- Monthly cashflow
- —
- DSCR
- —
- Eligible?
- —
Personal DTI + credit; lowest rate.
DSCR
20% down · 8.5% · 30yr
- Down + closing
- —
- Monthly P&I
- —
- Monthly cashflow
- —
- DSCR
- —
- Eligible?
- —
No personal income docs; deal must DSCR.
Hard money
10% down · 12.0% · 12mo
- Down + closing
- —
- Monthly P&I
- —
- Monthly cashflow
- —
- DSCR
- —
- Eligible?
- —
Short-term bridge; refi at stabilization.
Rent comps 2 comps
| Address | Beds | Baths | Sqft | Rent | $/sqft | DOM | Units | Dist |
|---|---|---|---|---|---|---|---|---|
| 437 Cold Brook Dr Sudbury, MA | 1.0–2.0 | 1.0–2.0 | 919 | $3,715 | $4.04 | 1d | 8 | 0.82mi |
| 20A Hemlock St Concord, MA | 2.0 | 2.0 | 936 | $2,700 | $2.88 | 1d | 1 | 1.31mi |
Listing history 15 events
-
2026-06-18days on market $265,000 Active 34 DOM
-
2026-06-17days on market $265,000 Active 33 DOM
-
2026-06-16days on market $265,000 Active 32 DOM
-
2026-06-15days on market $265,000 Active 31 DOM
-
2026-06-13days on market $265,000 Active 29 DOM
-
2026-06-13days on market $265,000 Active 28 DOM
-
2026-06-09days on market $265,000 Active 25 DOM
-
2026-06-08days on market $265,000 Active 24 DOM
-
2026-06-07days on market $265,000 Active 23 DOM
-
2026-06-04days on market $265,000 Active 20 DOM
-
2026-06-03days on market $265,000 Active 19 DOM
-
2026-06-02days on market $265,000 Active 18 DOM
-
2026-06-01days on market $265,000 Active 17 DOM
-
2026-05-31days on market $265,000 Active 16 DOM
-
2026-05-15$265,000 New
ⓘ Source: listings_history table (triggers on properties + properties_extension) + one-shot
backfill from property_details.listing_events for pre-trigger history.
Climate risk First Street
- Flood 4/10 Moderate FEMA zone X (shaded) · 23% chance over 30 yrs
- Wildfire 3/10 Moderate
- Heat 5/10 Major 7 d/yr ≥97°F today · 15 d/yr by 30 yrs out
- Wind 6/10 Major 27% chance of damaging wind over 30 yrs
- Air quality 2/10 Low 1 unhealthy d/yr today · 2 by 30 yrs out
Nearby sold comps map
Loading sold comps map…
Walkable amenities ~0.75 mi
Loading nearby amenities…
Taxation est. · year 1
- Rental income
- $33,149
- − Mortgage interest
- −$14,844
- − Property taxes
- −$3,975
- − Insurance
- −$1,325
- − Repairs & maintenance
- −$2,652
- − Management
- −$2,652
- − Depreciation
- −$7,709
- Taxable loss
- −$8
- Est. tax savings @ 24.0%
- +$2
- After-tax cash flow
- $4,214/yr
For passive investors: Depreciation is non-cash, so a rental often shows a tax loss while cash-flowing — sheltering income. Rental losses are passive: they offset passive income freely, and up to $25,000/yr can offset ordinary (W-2) income if you actively participate and your MAGI is under $100k (phasing out to $0 by $150k); unused losses carry forward. On sale, claimed depreciation is recaptured at up to 25%, and gains may owe capital-gains tax (a 1031 exchange can defer both). Figures are a year-1 estimate at your 24.0% rate — not tax advice; consult a CPA.
Condition & rehab AI · 12 photos
This spacious single-wide home in a sought-after 55+ community is in good condition with modern updates and a well-maintained exterior. It offers a good return on investment with potential for further improvements to enhance its resale and rental value.
Value-add opportunities
- Both Paint the exterior siding — Fresh paint can enhance curb appeal and property value.
- Both Replace the composite deck — A new deck can improve the home's curb appeal and increase its rental value.
- Both Install new flooring in the bathrooms — New flooring can improve the appearance and functionality of the bathrooms.
- Both Upgrade the kitchen appliances — Modern appliances can make the kitchen more functional and appealing to potential buyers/renters.
Renovation cost estimate screening
Value-add ROI direction
- Both Paint the exterior siding — Fresh paint can enhance curb appeal and property value. ↑
- Both Replace the composite deck — A new deck can improve the home's curb appeal and increase its rental value. ↑
- Both Install new flooring in the bathrooms — New flooring can improve the appearance and functionality of the bathrooms. ↑
- Both Upgrade the kitchen appliances — Modern appliances can make the kitchen more functional and appealing to potential buyers/renters. ↑
ⓘ Cost ranges are severity-bucket heuristics (US national rule-of-thumb). Get contractor quotes + a written scope before underwriting a rehab budget.
Schools (NCES district)
- District
- Sudbury
- NCES district ID
- 2511340
- Math proficiency
- 67% ▼ -6.00%
- Reading proficiency
- 73% ▼ -3.00%
- Median HH income
- $162,050
- Composite
- 70.06/100
- National rank
- #278
- State rank
- #12 of 302 in MA
Livability — Sudbury
No livability data for this city. (Only ~50 U.S. cities are tracked.)
Census & demographics
- County
- Bristol County · 342,083 people
- Metro
- Providence-Warwick, RI-MA
- Population (ZIP)
- 29,177
- Household income
- $112,027
- Rent vs Own
- Severe rent burden
- 681.0
Population outlook (Middlesex County) Hauer SSP2
- Today (2025)
- 1,740,269 people
- By 2030
- 1,817,187 · +4.4%
- By 2040
- 1,963,195 · +12.8%
- By 2050
- 2,087,461 · +20.0%
- By 2075
- 2,344,036 · +34.7%
- By 2100
- 2,383,776 · +37.0%
Race, ethnicity, and origin ACS 2023
- Neighborhood character
- Predominantly White (84%)
- Race & ethnicity
- White 84% Asian 6% Two or more races 5% Hispanic / Latino 4% Black 2%
- Common ancestry
- Lithuanian 9% Romanian 6% Russian 5%
- Foreign-born
- 9% · Canada, China
- Languages at home
- 89% English-only · Other Indo-European 4% Spanish 3% Other Asian/Pacific 2%
Political lean MEDSL · Middlesex
- 2024 margin
- Solid D (+39.5) · D 68.5% · R 29.0% · Other 2.5%
- 2008→2024 swing
- +9.3pp toward D · 2008: 30.1pp · 2024: 39.5pp
- All cycles
- 2024: D+39.5 2020: D+45.2 2016: D+38.1 2012: D+26.9 2008: D+30.1
Not yet ingested
- Civics
- —
Market trends
- HPI YoY
- ▼ -575.93%
- Current HPI
- 302.0435
- Rent YoY
- ▲ 2.88%
- Metro
- Providence-Warwick, RI-MA
- State GDP YoY
- ▲ 2.28%
- F500 in state
- 38
Industry mix (Fortune 500 HQ in MA)
| Industry | F500 HQs | Revenue |
|---|---|---|
| Technology | 3 | $17B |
|
||
| Insurance | 2 | $84B |
|
||
| Retail | 2 | $76B |
|
||
| Life Sciences | 1 | $43B |
|
||
| Energy Technology | 1 | $31B |
|
||
| Aerospace / Defense | 1 | $18B |
|
||
Price history
1 event — show timeline
- 2026-05-15 Listed $265,000 MLS PIN
Cash-flow waterfall
monthlySold comps — $/sqft
last 12 mo · ≤1 miLoading sold comps…