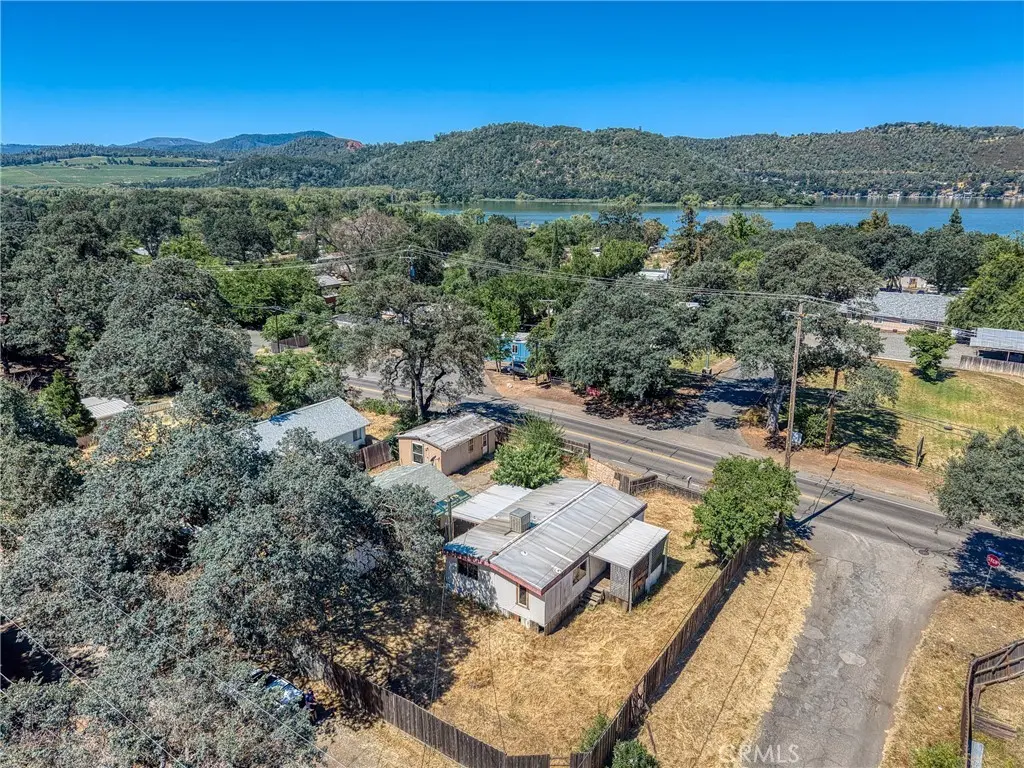
5542 Old Highway 53 · Clearlake, CA
Flood risk 1/10 · Minimal
- FEMA flood zone
- X (unshaded)
- Chance of flooding over 30 yrs
- 0.0%
- Est. flood insurance / yr
- $507 – $1,088
Fire risk 9/10 · Severe
- Est. fire insurance / yr
- $659 – $1,223
Heat risk 6/10 · Moderate
- Hot days now (above 100°F)
- 7 days/yr
- Hot days in 30 yrs
- 14 days/yr
Wind risk 1/10 · Minimal
- Chance of severe wind over 30 yrs
- —
Air-quality risk 10/10 · Severe
- Unhealthy air days now
- 32 days/yr
- Unhealthy air days in 30 yrs
- 33 days/yr
Risk factors via First Street. Map © Google.
Why this score? — see what drove the C grade
The composite is a weighted blend of 9 inputs, each scored 0–100. Each bar is that input's sub-score; the figure is the points it added to the 100-point composite (weight × sub-score).
- Cash flow +22.9/30.0
- ARV discount +15.0/15.0
- DSCR +7.4/10.0
- 1% rule +5.3/10.0
- Livability +3.1/5.0
- Rent growth +2.5/5.0
- Condition / age +2.5/5.0
- Schools +1.2/10.0
- Appreciation +0.0/10.0
$129,000
🖨 Deal sheet 📄 Offer letter ✓ Due diligence
Listing remarks
Great opportunity to have an affordable home in Clearlake close to Clearlake. Inside home is all laminated flooring with 2 bedroom / 2 bathroom , living room , dining area and kitchen. This all comes on a corner lot with a detached 2 car garage and small shed that appears to have been trying to be build as ADU. ADU or shed needs repairs. Property being sold as is.
Key facts
- 9,583 sq ft lot
- 2 garage spots
- Built 1976
Property features AI
Finance
- Financial info: Subject to special assessments
- HOA & community: Rural community with lake and fishing
Exterior
- Parking: 2 garage spaces; Additional parking space (2 total parking spaces)
- Utilities: Public sewer; District/public water; Electricity connected; Utilities: see remarks
- Home design: Single-story manufactured home; Entry on living room; No common walls
- Construction: No foundation specified
- Exterior features: Manufactured house; Deck/patio; Shed; Barbed wire and wood fencing; Corner lot, generally level; Lake on lot and community fishing opportunities; Has view
Interior
- Kitchen: Electric range; Dishwasher; Eating area
- Bedrooms: 2 main floor bedrooms
- Flooring: Laminated flooring
- Bathrooms: 2 full bathrooms; Bathtub
- Heating & cooling: Evaporative cooling
- Interior features: One level home; Living room entry; Main level has 2 bedrooms and 2 bathrooms; Fixer condition
- Laundry & utility: Inside laundry room; Washer included; Dryer included
Neighborhood map
What this means for you Summary
Snapshot
- This is a 2-bed/2.0-bath single-family listed at $129k.
Deal economics
- At list price, monthly cash flow is $227 ($3k/yr) — positive.
- The deal already cash-flows at list — no discount required.
- Meets the 1% rule at list price ($1k rent vs $129k).
- Cap rate 8.4% vs local median 3.8% in Clearlake — top-decile yield for the area; either an underpriced asset or a hidden risk that comps aren't pricing in. Stress-test before assuming the spread holds.
Location & tenants
- Location reads 61/100 on livability (#549 in CA) — a middle-class / working-renter tenant base. Strengths: housing A+, health & safety A+; Watch: schools F, crime F, amenities F.
- Konocti Unified (town): math 9% / reading 21% proficiency, ranked #494 of 517 in CA (top 96%) — low school quality limits family demand, transient renter base, plan for 1-2y turnover; 77% free/reduced lunch — lower-income household profile, screen leases tightly.
- Market conditions: 292 active listings in the ZIP; 5 comparable units currently listed for rent nearby; rentals at typical pace (median 21d on market — plan ~3-4 weeks tenant-placement turnaround); 107 units permitted in Lake County in 2024 (40 in 5+ unit buildings).
Forward outlook
- Local home prices are declining (-3.0%/yr); year-one equity from $892 of loan paydown is wiped out by about $4k of value loss. Plan a longer hold.
- Lake County population projected at -15% by 2050 — secular population decline; favor cash flow + early exit over multi-decade hold.
Negotiation context
- Only 6 days on market — expect competitive offers; lowballing is unlikely to land.
- 2 sale attempts since 3y ago with the ask held roughly flat each time — persistent listings suggest the price (not the market) is what's stuck; bring a comps-based counter.
- Current owner paid $59k; list at $129k implies a 119% gain — meaningful room to come down on a strong offer.
Risks & watch-outs
- Climate carrying-cost: severe wildfire risk; extreme-heat days projected 7→14/yr by 2055 (HVAC capex compounding) — expect insurance premiums to compound above CPI over the hold.
Questions for the listing agent
- Built in 1976 — when were the roof, HVAC, electrical panel, plumbing, and water heater last replaced?
- Is there a deadline driving the sale (1031 exchange, divorce, estate, relocation)? That informs how much negotiation room exists.
- Schools are F-rated, which usually means shorter tenancies and higher turnover. Who's the typical renter profile here, and what's been the actual vacancy rate?
- Crime grade is F in this area — have there been break-ins, vandalism, or insurance claims at this property in the last 3 years? What carrier currently insures it and at what premium?
- What's the average days-on-market for RENTAL listings here right now (not sales)? A rising rental-DOM trend means longer vacancies and softer asking-rent achievability than the comps imply.
- What's the recent tenant-quality profile in this submarket — average credit score on applications, eviction rate, late-payment / NSF rate, and stable-employment percentage? A property-management company in the area should have these aggregated.
- How much new for-sale + rental construction is in the pipeline within 1–3 miles? Heavy new supply typically softens prices + rents 12–24 months out; constrained supply supports both.
Investment metrics
- 1% rule
- 1.03% ✓
- Cap rate
- 8.40%
- Cash-on-cash
- 7.54%
- DSCR
- 1.34
- GRM
- 8.1
CMA / ARV
- ARV (on-the-fly)
- $249,600
- Comps found
- 12
Show comp detail 12 sales within ~0.75 mi
| Address | Dist | Beds/Ba | Sqft | Sold | Price | $/sf | Match |
|---|---|---|---|---|---|---|---|
| 5649 Crawford | 0.22mi | 3/2.0 (+1) | 1,299 (+8%) | 2mo | $280,000 | $216 | 70 |
| 15125 Konocti Vw Vw Vw | 0.23mi | 3/2.0 (+1) | 1,305 (+9%) | 1mo | $240,000 | $184 | 68 |
| 14965 Putnam Ln | 0.26mi | 1/1.5 (-1) | 1,241 (+3%) | 10mo | $108,500 | $87 | 67 |
| 14930 Clement Dr | 0.12mi | 3/1.0 (+1) | 1,100 (-8%) | 12mo | $180,000 | $164 | 61 |
| 15563 22nd Ave | 0.61mi | 3/2.0 (+1) | 1,232 (+3%) | 2mo | $267,000 | $217 | 60 |
| 6280 Ridgeview Dr | 0.44mi | 3/2.0 (+1) | 1,272 (+6%) | 19mo | $265,000 | $208 | 49 |
| 6800 Stonybrook Dr | 0.63mi | 3/2.0 (+1) | 1,264 (+5%) | 12mo | $235,000 | $186 | 47 |
| 6880 Meadowbrook Dr | 0.71mi | 3/2.0 (+1) | 1,284 (+7%) | 8mo | $320,000 | $249 | 44 |
| 6890 Meadowbrook | 0.72mi | 2/1.0 | 1,100 (-8%) | 7mo | $260,000 | $236 | 43 |
| 14576 Emory Ave | 0.74mi | 2/1.0 | 1,144 (-5%) | 15mo | $175,000 | $153 | 41 |
| 15597 34th | 0.58mi | 3/2.0 (+1) | 1,368 (+14%) | 6mo | $285,000 | $208 | 40 |
| 15740 29th Ave | 0.67mi | 3/2.0 (+1) | 1,341 (+12%) | 10mo | $273,000 | $204 | 36 |
Match score weights: distance 35% · size 25% · config 20% · recency 20%. Top-matched comps best support the ARV.
Projected returns pro-forma
-3.0% appreciation · 3.0% rent growth · sell at horizon
- IRR
- -4.8%
- Equity multiple
- 0.82×
- Total profit
- $-6,472
- Equity at exit
- $19,234
- IRR
- 4.9%
- Equity multiple
- 1.36×
- Total profit
- $12,890
- Equity at exit
- $11,154
Cash invested: $36,120 (down + closing). Projections, not guarantees.
Landlord ↔ Tenant lean methodology
- Overall (STATE)
- 18 Strongly Tenant-Friendly
- State California
- 18 Strongly Tenant-Friendly · D+13
- County
- — inherits STATE
- City
- — inherits STATE
ZIP-level market 95422
- Home prices YoY
- -33.4%
- Active inventory
- 292
- Price-to-rent
- 8.1×
Monthly cashflow live
- Estimated rent
- $1,332 high interval (Pro) →
- Mortgage (P&I)
- −$676
- Tax from tax record
- −$96 /mo · $1,146/yr
- Insurance
- −$54
- HOA
- −$0
- Vacancy / Maint / Mgmt
- −$280
- Net cashflow
- $227
Break-even live
UW: 25.0% down · 7.5% · 30yr · 1.5% tax · 5.0% vac · 8.0% maint · 8.0% mgmt
Financing live
Cash to close
- Down payment
- $32,250
- Closing costs
- $3,870
- Reserves months
- —
- Total cash needed
- —
Loan-product check · same deal, 3 products live
Conventional
25% down · 7.5% · 30yr
- Down + closing
- —
- Monthly P&I
- —
- Monthly cashflow
- —
- DSCR
- —
- Eligible?
- —
Personal DTI + credit; lowest rate.
DSCR
20% down · 8.5% · 30yr
- Down + closing
- —
- Monthly P&I
- —
- Monthly cashflow
- —
- DSCR
- —
- Eligible?
- —
No personal income docs; deal must DSCR.
Hard money
10% down · 12.0% · 12mo
- Down + closing
- —
- Monthly P&I
- —
- Monthly cashflow
- —
- DSCR
- —
- Eligible?
- —
Short-term bridge; refi at stabilization.
Rent comps 5 comps
| Address | Beds | Baths | Sqft | Rent | $/sqft | DOM | Units | Dist |
|---|---|---|---|---|---|---|---|---|
| 5935 Old Highway 53 Unit D Clearlake, CA | 2.0 | 2.0 | 700 | $1,000 | $1.43 | 21d | 1 | 0.25mi |
| 5935 Old Highway 53 Spc 32 MH (Park Owned) Clearlake, CA | 3.0 | 2.0 | 1300 | $1,400 | $1.08 | 21d | 1 | 0.26mi |
| 14984 Putnam Ln Clearlake, CA | 2.0 | 1.5 | 819 | $1,500 | $1.83 | 43d | 1 | 0.32mi |
| 14531 Emory Ave Clearlake, CA | 3.0 | 1.0 | 912 | $1,450 | $1.59 | 21d | 1 | 0.84mi |
| 14083 Lakeshore Dr Clearlake, CA | 2.0 | 2.0 | 1076 | $1,450 | $1.35 | 21d | 1 | 1.48mi |
Listing history 7 events
-
2026-06-19days on market $129,000 Active 6 DOM
-
2026-06-18days on market $129,000 Active 5 DOM
-
2026-06-17days on market $129,000 Active 4 DOM
-
2026-06-16days on market $129,000 Active 3 DOM
-
2026-06-15days on market $129,000 Active 2 DOM
-
2026-06-14remarks 366-char remark
-
2026-06-14$129,000 Active 1 DOM
ⓘ Source: listings_history table (triggers on properties + properties_extension) + one-shot
backfill from property_details.listing_events for pre-trigger history.
Tax reassessment forecast CA · Resets to sale price
- Current annual tax
- $1,146 · $96/mo
- Projected year-2 tax
- $1,146 · $96/mo
- Expected delta
- $0/yr ($0/mo · 0.0%)
ⓘ Screening estimate from a state-policy table — verify with the county assessor before closing.
Climate risk First Street
- Flood 1/10 Low FEMA zone X (unshaded) · 0% chance over 30 yrs
- Wildfire 9/10 Extreme
- Heat 6/10 Major 7 d/yr ≥100°F today · 14 d/yr by 30 yrs out
- Wind 1/10 Low
- Air quality 10/10 Extreme 32 unhealthy d/yr today · 33 by 30 yrs out
Nearby sold comps map
Loading sold comps map…
Walkable amenities ~0.75 mi
Loading nearby amenities…
Taxation est. · year 1
- Rental income
- $15,990
- − Mortgage interest
- −$7,226
- − Property taxes
- −$1,146
- − Insurance
- −$645
- − Repairs & maintenance
- −$1,279
- − Management
- −$1,279
- − Depreciation
- −$3,753
- Taxable income
- $661
- Est. tax owed @ 24.0%
- −$159
- After-tax cash flow
- $2,564/yr
For passive investors: Depreciation is non-cash, so a rental often shows a tax loss while cash-flowing — sheltering income. Rental losses are passive: they offset passive income freely, and up to $25,000/yr can offset ordinary (W-2) income if you actively participate and your MAGI is under $100k (phasing out to $0 by $150k); unused losses carry forward. On sale, claimed depreciation is recaptured at up to 25%, and gains may owe capital-gains tax (a 1031 exchange can defer both). Figures are a year-1 estimate at your 24.0% rate — not tax advice; consult a CPA.
Schools (NCES district)
- District
- Konocti Unified
- NCES district ID
- 0620070
- Math proficiency
- 9% ▼ -5.00%
- Reading proficiency
- 21% ▼ -6.00%
- Median HH income
- $30,026
- Composite
- 11.81/100
- National rank
- #9677
- State rank
- #494 of 517 in CA
Livability — Clearlake
- Score
- 61/100
- State rank
- #549
- US rank
- #18284
Category grades
Schools grade is shown separately in the Schools card above.
Census & demographics
- Census place
- Clearlake, CA
- Population (ZIP)
- 17,101
Population outlook (Lake County) Hauer SSP2
- Today (2025)
- 62,396 people
- By 2030
- 60,626 · -2.8%
- By 2040
- 56,453 · -9.5%
- By 2050
- 53,054 · -15.0%
- By 2075
- 47,663 · -23.6%
- By 2100
- 41,804 · -33.0%
Race, ethnicity, and origin ACS 2023
- Neighborhood character
- Diverse neighborhood (Simpson 0.59)
- Race & ethnicity
- White 56% Hispanic / Latino 30% Two or more races 15% Black 4% Native American 3% Asian 1%
- Hispanic origin (detail)
- Mexican 26%
- Common ancestry
- Lithuanian 3% Italian 1% Russian 1%
- Foreign-born
- 10% · Canada
- Languages at home
- 77% English-only · Spanish 22% Other Indo-European 1%
Political lean MEDSL · Lake
- 2024 margin
- Toss-up / Even · D 47.8% · R 49.2% · Other 3.0%
- 2008→2024 swing
- -20.6pp toward R · 2008: 19.3pp · 2024: -1.4pp
- All cycles
- 2024: R+1.4 2020: D+6.3 2016: D+3.7 2012: D+16.5 2008: D+19.3
Not yet ingested
- Civics
- —
Market trends
- HPI YoY
- ▼ -124.47%
- Current HPI
- 248.654
- Rent YoY
- —
- Metro
- —
- State GDP YoY
- ▲ 3.21%
- F500 in state
- 116
Industry mix (Fortune 500 HQ in CA)
| Industry | F500 HQs | Revenue |
|---|---|---|
| Technology | 27 | $1,492B |
|
||
| Financial Services | 3 | $174B |
|
||
| Retail | 3 | $44B |
|
||
| Insurance | 3 | $26B |
|
||
| Media / Entertainment | 2 | $115B |
|
||
| Pharmaceuticals / Biotech | 2 | $62B |
|
||
Price history
+473.3% since first listed6 events — show timeline
- 2026-06-13 Listed $129,000 CRMLS
- 2023-12-31 Listing Removed — CRMLS
- 2023-08-29 Listed $169,000 CRMLS
- 2002-10-08 Sold (Public Records) $59,000 Public Records
- 2002-06-27 Sold (Public Records) $45,000 Public Records
- 1993-10-12 Sold (Public Records) $22,500 Public Records
Property tax history
+1.9%/yrLatest (2025): $1,146 · -31.0% YoY. Source: county tax records.
Cash-flow waterfall
monthlySold comps — $/sqft
last 12 mo · ≤1 miLoading sold comps…