8221 SW 128th Loop · Marion Oaks, FL
Flood risk 1/10 · Minimal
- FEMA flood zone
- X (unshaded)
- Chance of flooding over 30 yrs
- 0.0%
- Est. flood insurance / yr
- $507 – $1,088
Fire risk 6/10 · Moderate
- Est. fire insurance / yr
- $947 – $1,759
Heat risk 8/10 · Major
- Hot days now (above 107°F)
- 7 days/yr
- Hot days in 30 yrs
- 22 days/yr
Wind risk 9/10 · Severe
- Chance of severe wind over 30 yrs
- 99.0%
Air-quality risk 2/10 · Minimal
- Unhealthy air days now
- 1 days/yr
- Unhealthy air days in 30 yrs
- 2 days/yr
Risk factors via First Street. Map © Google.
Why this score? — see what drove the F grade
The composite is a weighted blend of 9 inputs, each scored 0–100. Each bar is that input's sub-score; the figure is the points it added to the 100-point composite (weight × sub-score).
- Cash flow +8.9/30.0
- ARV discount +7.5/15.0
- Schools +3.6/10.0
- 1% rule +2.7/10.0
- DSCR +2.5/10.0
- Livability +2.5/5.0
- Condition / age +2.5/5.0
- Rent growth +2.3/5.0
- Appreciation +0.0/10.0
$249,990
🖨 Deal sheet 📄 Offer letter ✓ Due diligence
Listing remarks
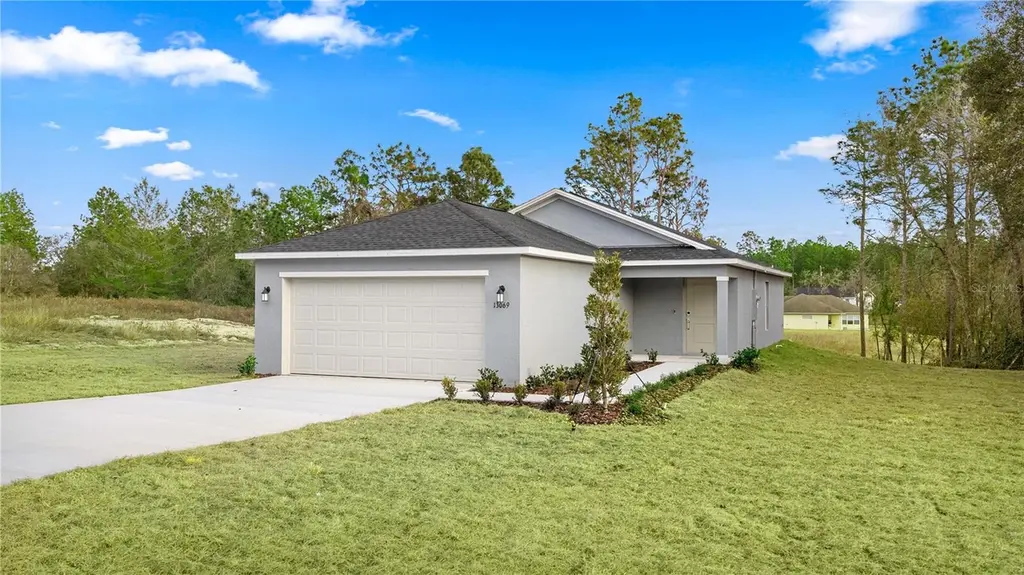
This new single-story home is a modern take on a classic design. Down the foyer is a spacious and open-plan family room which has direct access to the cozy dining room, well-equipped kitchen and attached patio, perfect for everyday living. In a private corner is the owner’s suite with a convenient adjoining bathroom, while on the opposite side of the home are three secondary bedrooms to offer restful retreats.
Key facts
- Adjoining bathroom
- Owner's suite
- Single-story home
Tags
Neighborhood map
What this means for you Summary
Snapshot
- This is a 3-bed/2.0-bath land listed at $250k.
Deal economics
- At list price, monthly cash flow is $-201 ($-2k/yr) — negative.
- To cash-flow at today's rent, offer at most $221k (11.6% below list).
- To meet the 1% rule (rent ≥ 1% of price), the offer needs to be $193k (22.7% below list).
- Recommended offer: $193k (22.7% below list) — sets the bar for 1% rule.
Location & tenants
- Location reads: area grade F — affects rentability + tenant quality, not the cash-flow math above.
- Marion (rural): math 42% / reading 43% proficiency, ranked #61 of 73 in FL (top 84%) — families likely to look elsewhere, expect single-tenant / working-renter base with shorter leases; 61% free/reduced lunch — lower-income household profile, screen leases tightly.
- Zoned schools: Marion Oaks Elementary School (math 38% / reading 39%, grade F, #1,575 of 2,144 statewide, top 74%, 939 students, 65% FRL); Dunnellon High School (math 30% / reading 32%, grade F, #429 of 667 statewide, top 65%, 1,350 students, 63% FRL) — zoned schools at 64% FRL track the district average.
- Market conditions: Rents soft (-0.7%/yr); 1355 active listings in the ZIP; 19 comparable units currently listed for rent nearby; rentals at typical pace (median 21d on market — plan ~3-4 weeks tenant-placement turnaround); 7,071 units permitted in Marion County in 2024 (534 in 5+ unit buildings).
- This rent runs 32% of the median local income ($72k/yr) — at the standard rent-burdened threshold; future hikes will face affordability resistance.
Forward outlook
- Local home prices are declining (-3.0%/yr); year-one equity from $2k of loan paydown is wiped out by about $8k of value loss. Plan a longer hold.
- Marion County population projected at +13% by 2050 — modest demand growth; plan on rents tracking national, not racing it.
Negotiation context
- It's been on market 34 days — a 3% lower offer ($242k) is reasonable based on typical stale-listing flexibility.
- Current owner paid $148k; list at $250k implies a 69% gain — meaningful room to come down on a strong offer.
Risks & watch-outs
- Climate carrying-cost: severe wind risk, 99% chance of damaging wind over 30y; major wildfire risk; extreme-heat days projected 7→22/yr by 2055 (HVAC capex compounding) — expect insurance premiums to compound above CPI over the hold.
Questions for the listing agent
- What do current leases actually rent for vs. the listed asking? Can we see a recent rent roll and the last 12 months of T-12 income?
- It's been on market 34 days. Have you received any prior offers? Is the seller open to a 23% concession, seller financing, or rate buy-down credit?
- Is there a deadline driving the sale (1031 exchange, divorce, estate, relocation)? That informs how much negotiation room exists.
- The area grade is low — what's the realistic commute time and amenity access for the typical tenant pool here? Any planned neighborhood developments (good or bad) we should know about?
- What's the average days-on-market for RENTAL listings here right now (not sales)? A rising rental-DOM trend means longer vacancies and softer asking-rent achievability than the comps imply.
- What's the recent tenant-quality profile in this submarket — average credit score on applications, eviction rate, late-payment / NSF rate, and stable-employment percentage? A property-management company in the area should have these aggregated.
- How much new for-sale + rental construction is in the pipeline within 1–3 miles? Heavy new supply typically softens prices + rents 12–24 months out; constrained supply supports both.
Investment metrics
- 1% rule
- 0.77% ✗
- Cap rate
- 5.33%
- Cash-on-cash
- -3.44%
- DSCR
- 0.85
- GRM
- 10.8
CMA / ARV
No comps found within radius.
Projected returns pro-forma
-3.0% appreciation · 0.0% rent growth · sell at horizon
- IRR
- -25.5%
- Equity multiple
- 0.16×
- Total profit
- $-58,921
- Equity at exit
- $37,274
- IRR
- -34.9%
- Equity multiple
- -0.28×
- Total profit
- $-89,532
- Equity at exit
- $21,615
Cash invested: $69,997 (down + closing). Projections, not guarantees.
Landlord ↔ Tenant lean methodology
- Overall (STATE)
- 87 Strongly Landlord-Friendly
- State Florida
- 87 Strongly Landlord-Friendly · R+3
- County
- — inherits STATE
- City
- — inherits STATE
ZIP-level market 34473
- Home prices YoY
- -16.8%
- Rents YoY
- -0.7%
- Active inventory
- 1355
- Price-to-rent
- 10.8×
Monthly cashflow live
- Estimated rent
- $1,933 high interval (Pro) →
- Mortgage (P&I)
- −$1,311
- Tax est. 1.5%
- −$312 /mo · $3,750/yr
- Insurance
- −$104
- HOA
- −$0
- Vacancy / Maint / Mgmt
- −$406
- Net cashflow
- $-201
Break-even live
UW: 25.0% down · 7.5% · 30yr · 1.5% tax · 5.0% vac · 8.0% maint · 8.0% mgmt
Financing live
Cash to close
- Down payment
- $62,498
- Closing costs
- $7,500
- Reserves months
- —
- Total cash needed
- —
Loan-product check · same deal, 3 products live
Conventional
25% down · 7.5% · 30yr
- Down + closing
- —
- Monthly P&I
- —
- Monthly cashflow
- —
- DSCR
- —
- Eligible?
- —
Personal DTI + credit; lowest rate.
DSCR
20% down · 8.5% · 30yr
- Down + closing
- —
- Monthly P&I
- —
- Monthly cashflow
- —
- DSCR
- —
- Eligible?
- —
No personal income docs; deal must DSCR.
Hard money
10% down · 12.0% · 12mo
- Down + closing
- —
- Monthly P&I
- —
- Monthly cashflow
- —
- DSCR
- —
- Eligible?
- —
Short-term bridge; refi at stabilization.
Rent comps 19 comps
| Address | Beds | Baths | Sqft | Rent | $/sqft | DOM | Units | Dist |
|---|---|---|---|---|---|---|---|---|
| 8181 SW 128th Loop Ocala, FL | 3.0 | 2.0 | 1402 | $1,745 | $1.24 | 13d | 1 | 0.08mi |
| 12847 SW 84th Terrace Rd Ocala, FL | 3.0 | 2.0 | 1393 | $1,850 | $1.33 | 21d | 1 | 0.15mi |
| 13033 SW 82nd Avenue Rd Ocala, FL | 3.0 | 2.0 | 1413 | $1,895 | $1.34 | 13d | 1 | 0.26mi |
| 13092 SW 84th Terrace Rd Ocala, FL | 4.0 | 2.0 | 1800 | $1,800 | $1.00 | 21d | 1 | 0.35mi |
| 8070 SW 131st Ln Ocala, FL | 3.0 | 2.0 | 1642 | $2,400 | $1.46 | 13d | 1 | 0.52mi |
| 8934 SW 135th Street Rd Ocala, FL | 4.0 | 2.5 | 1824 | $2,200 | $1.21 | 21d | 1 | 0.57mi |
| 8341 SW 135th Loop Ocala, FL | 3.0 | 2.0 | 1623 | $1,600 | $0.99 | 21d | 1 | 0.67mi |
| 13130 SW 78th Cir Ocala, FL | 4.0 | 2.0 | 1816 | $1,900 | $1.05 | 13d | 1 | 0.80mi |
| 8427 SW 136th St Ocala, FL | 3.0 | 2.0 | 1762 | $2,095 | $1.19 | 21d | 1 | 0.83mi |
| 13215 SW 77th Ave Ocala, FL | 3.0 | 2.0 | 1315 | $1,800 | $1.37 | 13d | 1 | 0.83mi |
| 8398 SW 138th Pl Ocala, FL | 3.0 | 2.0 | 1660 | $1,900 | $1.14 | 21d | 1 | 1.07mi |
| 8713 SW 138th St Ocala, FL | 3.0 | 2.0 | 1554 | $1,950 | $1.25 | 21d | 1 | 1.08mi |
| 7883 SW 138th Street Rd Ocala, FL | 4.0 | 3.0 | 1865 | $2,125 | $1.14 | 21d | 1 | 1.11mi |
| 8287 SW 116th St Ocala, FL | 2.0 | 2.0 | 1181 | $1,550 | $1.31 | 21d | 1 | 1.12mi |
| 769 Marion Oaks Pass Ocala, FL | 4.0 | 2.0 | 1696 | $1,950 | $1.15 | 13d | 1 | 1.22mi |
| 7867 SW 115th Loop Ocala, FL | 3.0 | 2.0 | 1462 | $1,600 | $1.09 | 21d | 1 | 1.34mi |
| 7146 SW 134th St Ocala, FL | 3.0 | 2.0 | 1733 | $1,600 | $0.92 | 21d | 1 | 1.43mi |
| 7060 SW 131st Loop Ocala, FL | 4.0 | 2.0 | 1787 | $1,899 | $1.06 | 13d | 1 | 1.43mi |
| 7052 SW 131st Loop Ocala, FL | 3.0 | 2.0 | 1718 | $1,550 | $0.90 | 21d | 1 | 1.49mi |
Listing history 5 events
-
2026-04-27status Pending
-
2026-04-22price $249,990
-
2026-03-24$255,990 Active
-
2026-02-19soldstatus $148,200
-
2025-05-02soldstatus $8,970,000
ⓘ Source: listings_history table (triggers on properties + properties_extension) + one-shot
backfill from property_details.listing_events for pre-trigger history.
Climate risk First Street
- Flood 1/10 Low FEMA zone X (unshaded) · 0% chance over 30 yrs
- Wildfire 6/10 Major
- Heat 8/10 Severe 7 d/yr ≥107°F today · 22 d/yr by 30 yrs out
- Wind 9/10 Extreme 99% chance of damaging wind over 30 yrs
- Air quality 2/10 Low 1 unhealthy d/yr today · 2 by 30 yrs out
Nearby sold comps map
Loading sold comps map…
Walkable amenities ~0.75 mi
Loading nearby amenities…
Taxation est. · year 1
- Rental income
- $23,195
- − Mortgage interest
- −$14,003
- − Property taxes
- −$3,750
- − Insurance
- −$1,250
- − Repairs & maintenance
- −$1,856
- − Management
- −$1,856
- − Depreciation
- −$7,272
- Taxable loss
- −$6,792
- Est. tax savings @ 24.0%
- +$1,630
- After-tax cash flow
- $-777/yr
For passive investors: Depreciation is non-cash, so a rental often shows a tax loss while cash-flowing — sheltering income. Rental losses are passive: they offset passive income freely, and up to $25,000/yr can offset ordinary (W-2) income if you actively participate and your MAGI is under $100k (phasing out to $0 by $150k); unused losses carry forward. On sale, claimed depreciation is recaptured at up to 25%, and gains may owe capital-gains tax (a 1031 exchange can defer both). Figures are a year-1 estimate at your 24.0% rate — not tax advice; consult a CPA.
Schools (NCES district)
- District
- Marion
- NCES district ID
- 1201260
- Math proficiency
- 42% ▼ -7.00%
- Reading proficiency
- 43% ▼ -4.00%
- Median HH income
- $40,015
- Composite
- 35.61/100
- National rank
- #4890
- State rank
- #61 of 73 in FL
Livability — Marion Oaks
No livability data for this city. (Only ~50 U.S. cities are tracked.)
Census & demographics
- Census place
- Marion Oaks, FL
- County
- Marion County · 315,796 people
- City population
- 25,030
- Metro
- Ocala, FL
- Population (ZIP)
- 26,813
- Household income
- $72,366
- Rent vs Own
- Severe rent burden
- 228.0
Population outlook (Marion County) Hauer SSP2
- Today (2025)
- 365,905 people
- By 2030
- 376,768 · +3.0%
- By 2040
- 396,555 · +8.4%
- By 2050
- 412,723 · +12.8%
- By 2075
- 446,090 · +21.9%
- By 2100
- 436,193 · +19.2%
Race, ethnicity, and origin ACS 2023
- Neighborhood character
- Diverse neighborhood (Simpson 0.69)
- Race & ethnicity
- White 34% Black 33% Hispanic / Latino 29% Two or more races 19% Asian 1%
- Hispanic origin (detail)
- Mexican 1% Puerto Rican 17% Cuban 3%
- Common ancestry
- Hispanic 3% Portuguese 2% Romanian 1%
- Foreign-born
- 17% · Canada, Jamaica
- Languages at home
- 67% English-only · Spanish 27% French/Haitian/Cajun 4% Other Indo-European 1%
Political lean MEDSL · Marion
- 2024 margin
- Solid R (+31.6) · D 33.8% · R 65.5%
- 2008→2024 swing
- -20.0pp toward R · 2008: -11.6pp · 2024: -31.6pp
- All cycles
- 2024: R+31.6 2020: R+25.9 2016: R+26.2 2012: R+16.2 2008: R+11.6
Not yet ingested
- Civics
- —
Market trends
- HPI YoY
- ▼ -45.25%
- Current HPI
- 224.3536
- Rent YoY
- ▼ -0.67%
- Metro
- Ocala, FL
- State GDP YoY
- ▲ 3.28%
- F500 in state
- 36
Industry mix (Fortune 500 HQ in FL)
| Industry | F500 HQs | Revenue |
|---|---|---|
| Industrial Technology | 2 | $29B |
|
||
| Insurance | 2 | $17B |
|
||
| Retail | 1 | $60B |
|
||
| Technology Distribution | 1 | $58B |
|
||
| Homebuilding | 1 | $35B |
|
||
| Technology Manufacturing | 1 | $35B |
|
||
Price history
-97.2% since first listed5 events — show timeline
- 2026-04-27 Pending — Stellar MLS as Distributed by MLS Grid
- 2026-04-22 Price Changed $249,990 Stellar MLS as Distributed by MLS Grid
- 2026-03-24 Listed $255,990 Stellar MLS as Distributed by MLS Grid
- 2026-02-19 Sold (Public Records) $148,200 Public Records
- 2025-05-02 Sold (Public Records) $8,970,000 Public Records
Property tax history
+7.2%/yrLatest (2025): $338 · +6.2% YoY. Source: county tax records.
Cash-flow waterfall
monthlySold comps — $/sqft
last 12 mo · ≤1 miLoading sold comps…