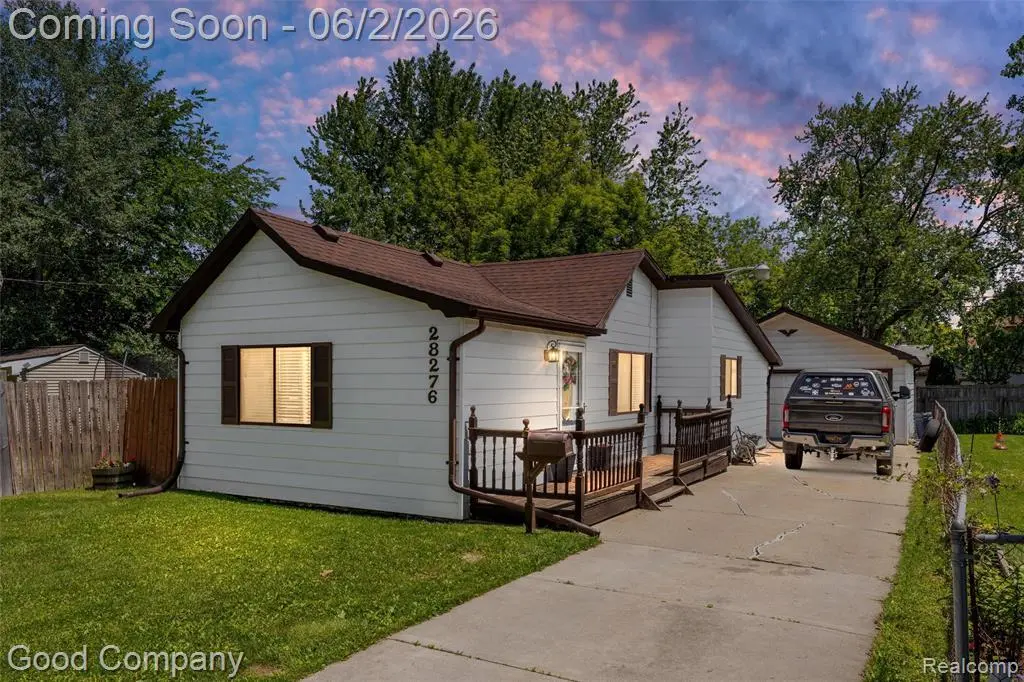
28276 Ginley St · Roseville, MI
Flood risk 1/10 · Minimal
- FEMA flood zone
- X (unshaded)
- Chance of flooding over 30 yrs
- 0.0%
- Est. flood insurance / yr
- $507 – $1,088
Fire risk 1/10 · Minimal
- Est. fire insurance / yr
- $784 – $1,456
Heat risk 3/10 · Minor
- Hot days now (above 96°F)
- 7 days/yr
- Hot days in 30 yrs
- 15 days/yr
Wind risk 1/10 · Minimal
- Chance of severe wind over 30 yrs
- —
Air-quality risk 4/10 · Minor
- Unhealthy air days now
- 4 days/yr
- Unhealthy air days in 30 yrs
- 5 days/yr
Risk factors via First Street. Map © Google.
Why this score? — see what drove the C grade
The composite is a weighted blend of 9 inputs, each scored 0–100. Each bar is that input's sub-score; the figure is the points it added to the 100-point composite (weight × sub-score).
- Cash flow +25.3/30.0
- DSCR +8.3/10.0
- ARV discount +7.0/15.0
- 1% rule +6.2/10.0
- Livability +3.6/5.0
- Rent growth +2.6/5.0
- Condition / age +2.5/5.0
- Schools +1.5/10.0
- Appreciation +0.0/10.0
$125,000
🖨 Deal sheet 📄 Offer letter ✓ Due diligence
Listing remarks
* * * All offers are due today Saturday, June 6,2026 at 3:00PM. * * * Open house! Saturday, June 6th from 12pm-2pm. Beautifully updated 2-bedroom, 1-bath ranch offering comfortable, move-in-ready living. The bright interior features fresh finishes and an inviting living room that flows into the updated eat-in kitchen with white cabinetry, stainless steel appliances, and modern flooring. Outside, enjoy a large deck perfect for entertaining, a large front yard and a detached 2-car garage with plenty of storage. Conveniently located near shopping, dining, and major roadways, this well-maintained home is ready for its next owner. Welcome home!
Key facts
- 5,663 sq ft lot
- 2 garage spots
- Built 1926
Property features AI
Exterior
- Parking: Detached 2-car garage
- Utilities: Public water; Natural gas; Forced air heating; Gas water heater
- Home design: One-story residential home; Built in 1926; Entry-level main living areas
- Construction: Aluminum and vinyl siding; Crawl foundation; Shallow lot (0.13 acres)
- Exterior features: Fenced yard; Paved street access; 39 feet frontage
Interior
- Kitchen: Kitchen on the entry level (approx. 11 x 10); Dishwasher; Disposal; Microwave; Range/Oven
- Bedrooms: Two bedrooms on the entry level (approx. 11 x 11 and 11 x 9)
- Bathrooms: One full bathroom on the entry level (approx. 6 x 5)
- Heating & cooling: Forced air heating; Natural gas fuel; Gas water heater
- Interior features: Five total rooms
- Laundry & utility: Washer; Dryer
Neighborhood map
What this means for you Summary
Snapshot
- This is a 3-bed/1.0-bath single-family listed at $125k.
Deal economics
- At list price, monthly cash flow is $282 ($3k/yr) — positive.
- The deal already cash-flows at list — no discount required.
- Meets the 1% rule at list price ($1k rent vs $125k).
- Cap rate 9.0% vs local median 6.0% in Roseville — top-decile yield for the area; either an underpriced asset or a hidden risk that comps aren't pricing in. Stress-test before assuming the spread holds.
Location & tenants
- Location reads 72/100 on livability (#258 in MI) — a middle-class / working-renter tenant base. Strengths: commute A+, cost of living A+, housing A+; Watch: health & safety D+, employment D, schools F.
- Roseville Community Schools (suburban): math 11% / reading 24% proficiency, ranked #483 of 540 in MI (top 89%) — low school quality limits family demand, transient renter base, plan for 1-2y turnover; 60% free/reduced lunch — lower-income household profile, screen leases tightly.
- Market conditions: Rents flat; 265 active listings in the ZIP; 19 comparable units currently listed for rent nearby; rentals at typical pace (median 24d on market — plan ~3-4 weeks tenant-placement turnaround); 1,321 units permitted in Macomb County in 2024 (86 in 5+ unit buildings).
Forward outlook
- Local home prices are declining (-3.0%/yr); year-one equity from $864 of loan paydown is wiped out by about $4k of value loss. Plan a longer hold.
- Macomb County population projected at +9% by 2050 — modest demand growth; plan on rents tracking national, not racing it.
Negotiation context
- Only 7 days on market — expect competitive offers; lowballing is unlikely to land.
Risks & watch-outs
- Watch-outs: built in 1926 — expect roof / HVAC / electrical / plumbing capex.
Questions for the listing agent
- Built in 1926 — when were the roof, HVAC, electrical panel, plumbing, and water heater last replaced?
- Is there a deadline driving the sale (1031 exchange, divorce, estate, relocation)? That informs how much negotiation room exists.
- Schools are F-rated, which usually means shorter tenancies and higher turnover. Who's the typical renter profile here, and what's been the actual vacancy rate?
- Crime grade is F in this area — have there been break-ins, vandalism, or insurance claims at this property in the last 3 years? What carrier currently insures it and at what premium?
- What's the average days-on-market for RENTAL listings here right now (not sales)? A rising rental-DOM trend means longer vacancies and softer asking-rent achievability than the comps imply.
- What's the recent tenant-quality profile in this submarket — average credit score on applications, eviction rate, late-payment / NSF rate, and stable-employment percentage? A property-management company in the area should have these aggregated.
- How much new for-sale + rental construction is in the pipeline within 1–3 miles? Heavy new supply typically softens prices + rents 12–24 months out; constrained supply supports both.
Investment metrics
- 1% rule
- 1.12% ✓
- Cap rate
- 9.00%
- Cash-on-cash
- 9.68%
- DSCR
- 1.43
- GRM
- 7.4
CMA / ARV
- ARV (on-the-fly)
- $123,627
- Comps found
- 12
Show comp detail 12 sales within ~0.75 mi
| Address | Dist | Beds/Ba | Sqft | Sold | Price | $/sf | Match |
|---|---|---|---|---|---|---|---|
| 27869 Tighe St | 0.29mi | 3/1.0 | 836 (-1%) | 6mo | $93,000 | $111 | 80 |
| 18374 Mesle St | 0.54mi | 2/1.0 (-1) | 830 (-1%) | 6mo | $55,000 | $66 | 63 |
| 27830 Van Howe St | 0.28mi | 3/1.0 | 960 (+14%) | 3mo | $159,900 | $167 | 61 |
| 28207 Grant St | 0.54mi | 2/1.0 (-1) | 815 (-3%) | 4mo | $144,665 | $178 | 61 |
| 27861 Bohnhoff St | 0.27mi | 2/1.0 (-1) | 936 (+11%) | 3mo | $85,000 | $91 | 61 |
| 27121 Maywood St | 0.59mi | 2/1.0 (-1) | 816 (-3%) | 4mo | $119,900 | $147 | 59 |
| 19128 Delaware St St | 0.45mi | 3/1.0 | 930 (+11%) | 6mo | $134,900 | $145 | 56 |
| 18605 Mesle St | 0.42mi | 3/1.0 | 950 (+13%) | 5mo | $139,000 | $146 | 54 |
| 28517 Grant St | 0.46mi | 3/1.5 | 942 (+12%) | 3mo | $260,000 | $276 | 54 |
| 27141 Maywood St | 0.58mi | 3/1.0 | 960 (+14%) | 2mo | $160,000 | $167 | 48 |
| 27056 Lawnwood St | 0.65mi | 3/1.0 | 955 (+14%) | 0mo | $105,000 | $110 | 47 |
| 19616 Bigelow St | 0.68mi | 2/1.0 (-1) | 932 (+11%) | 6mo | $173,000 | $186 | 40 |
Match score weights: distance 35% · size 25% · config 20% · recency 20%. Top-matched comps best support the ARV.
Projected returns pro-forma
-3.0% appreciation · 0.39% rent growth · sell at horizon
- IRR
- -4.6%
- Equity multiple
- 0.83×
- Total profit
- $-5,868
- Equity at exit
- $18,638
- IRR
- 1.8%
- Equity multiple
- 1.12×
- Total profit
- $4,045
- Equity at exit
- $10,808
Cash invested: $35,000 (down + closing). Projections, not guarantees.
Landlord ↔ Tenant lean methodology
- Overall (STATE)
- 62 Landlord-Friendly
- State Michigan
- 62 Landlord-Friendly · EVEN
- County
- — inherits STATE
- City
- — inherits STATE
ZIP-level market 48066
- Rents YoY
- 0.4%
- Active inventory
- 265
- Price-to-rent
- 7.4×
Monthly cashflow live
- Estimated rent
- $1,404 high interval (Pro) →
- Mortgage (P&I)
- −$656
- Tax from tax record
- −$119 /mo · $1,431/yr
- Insurance
- −$52
- HOA
- −$0
- Vacancy / Maint / Mgmt
- −$295
- Net cashflow
- $282
Break-even live
UW: 25.0% down · 7.5% · 30yr · 1.5% tax · 5.0% vac · 8.0% maint · 8.0% mgmt
Financing live
Cash to close
- Down payment
- $31,250
- Closing costs
- $3,750
- Reserves months
- —
- Total cash needed
- —
Loan-product check · same deal, 3 products live
Conventional
25% down · 7.5% · 30yr
- Down + closing
- —
- Monthly P&I
- —
- Monthly cashflow
- —
- DSCR
- —
- Eligible?
- —
Personal DTI + credit; lowest rate.
DSCR
20% down · 8.5% · 30yr
- Down + closing
- —
- Monthly P&I
- —
- Monthly cashflow
- —
- DSCR
- —
- Eligible?
- —
No personal income docs; deal must DSCR.
Hard money
10% down · 12.0% · 12mo
- Down + closing
- —
- Monthly P&I
- —
- Monthly cashflow
- —
- DSCR
- —
- Eligible?
- —
Short-term bridge; refi at stabilization.
Rent comps 19 comps
| Address | Beds | Baths | Sqft | Rent | $/sqft | DOM | Units | Dist |
|---|---|---|---|---|---|---|---|---|
| 27547 O Neil Roseville, MI | 3.0 | 1.0 | 1014 | $1,350 | $1.33 | 4d | 1 | 0.37mi |
| 18635 Meier St Unit : Back Roseville, MI | 2.0 | 1.0 | 900 | $1,100 | $1.22 | 24d | 1 | 0.42mi |
| 27067 Lawnwood St Roseville, MI | 3.0 | 1.0 | 960 | $1,500 | $1.56 | 43d | 1 | 0.62mi |
| 28744 Maple St Roseville, MI | 3.0 | 1.0 | 1050 | $1,295 | $1.23 | 43d | 1 | 0.94mi |
| 17405 Ivanhoe St Roseville, MI | 3.0 | 1.0 | 969 | $1,600 | $1.65 | 43d | 1 | 0.96mi |
| 17392 Tennyson St Roseville, MI | 3.0 | 1.0 | 900 | $1,649 | $1.83 | 2d | 1 | 1.00mi |
| 28368 Rosemont St Roseville, MI | 2.0 | 1.0 | 696 | $1,500 | $2.16 | 21d | 1 | 1.06mi |
| 26251 Pinehurst St Unit 251d Roseville, MI | 2.0 | 1.0 | 1000 | $1,200 | $1.20 | 43d | 1 | 1.28mi |
| 26221 Pinehurst St Roseville, MI | 2.0 | 1.0 | 1000 | $1,200 | $1.20 | 1d | 1 | 1.29mi |
| 21540 Saint Gertrude St #12 Saint Clair Shores, MI | 2.0 | 1.5 | 871 | $1,200 | $1.38 | 24d | 1 | 1.32mi |
| 30600 Little Mack Ave Roseville, MI | 1.0–2.0 | 1.0 | 900 | $1,210 | $1.34 | 1d | 6 | 1.34mi |
| 19040 E 13 Mile Rd Roseville, MI | 3.0 | 1.0 | 1008 | $1,550 | $1.54 | 1d | 1 | 1.34mi |
| 16944 E 11 Mile Rd Unit C2 Roseville, MI | 2.0 | 1.0 | 900 | $1,295 | $1.44 | 24d | 1 | 1.38mi |
| 16840 E Eleven Mile Rd Unit 103 Roseville, MI | 2.0 | 1.0 | 900 | $1,250 | $1.39 | 43d | 1 | 1.44mi |
| 16840 E 11 Mile Rd Unit 109 Roseville, MI | 2.0 | 1.0 | 900 | $1,400 | $1.56 | 43d | 1 | 1.44mi |
| 16840 E Eleven Mile Rd Unit 104 Roseville, MI | 2.0 | 1.0 | 900 | $1,200 | $1.33 | 43d | 1 | 1.44mi |
| 16840 E Eleven Mile Rd Roseville, MI | 2.0 | 1.0 | 900 | $1,300 | $1.44 | 21d | 3 | 1.44mi |
| 16840 E Eleven Mile Rd Roseville, MI | 2.0 | 1.0 | 900 | $1,300 | $1.44 | 24d | 3 | 1.44mi |
| 30512 Oakridge Manor Dr Roseville, MI | 2.0 | 1.5 | 1002 | $1,350 | $1.35 | 24d | 1 | 1.46mi |
Listing history 9 events
-
2026-06-18days on market $125,000 Active 7 DOM
-
2026-06-17statusdays on market $125,000 Active 6 DOM
-
2026-06-07remarks 651-char remark
-
2026-06-07statusdays on market $125,000 Pending 5 DOM
-
2026-06-04days on market $125,000 Active 3 DOM
-
2026-06-03days on market $125,000 Active 2 DOM
-
2026-06-02statusdays on market $125,000 Active 1 DOM
-
2026-06-01days on market $125,000 Coming Soon 3 DOM
-
2026-05-31days on market $125,000 Coming Soon 2 DOM
ⓘ Source: listings_history table (triggers on properties + properties_extension) + one-shot
backfill from property_details.listing_events for pre-trigger history.
Tax reassessment forecast MI · Partial reset (capped growth)
- Current annual tax
- $1,431 · $119/mo
- Projected year-2 tax
- $1,678 · $140/mo
- Expected delta
- +$247/yr (+$21/mo · 17.3%)
ⓘ Screening estimate from a state-policy table — verify with the county assessor before closing.
Climate risk First Street
- Flood 1/10 Low FEMA zone X (unshaded) · 0% chance over 30 yrs
- Wildfire 1/10 Low
- Heat 3/10 Moderate 7 d/yr ≥96°F today · 15 d/yr by 30 yrs out
- Wind 1/10 Low
- Air quality 4/10 Moderate 4 unhealthy d/yr today · 5 by 30 yrs out
Nearby sold comps map
Loading sold comps map…
Walkable amenities ~0.75 mi
Loading nearby amenities…
Taxation est. · year 1
- Rental income
- $16,848
- − Mortgage interest
- −$7,002
- − Property taxes
- −$1,431
- − Insurance
- −$625
- − Repairs & maintenance
- −$1,348
- − Management
- −$1,348
- − Depreciation
- −$3,636
- Taxable income
- $1,458
- Est. tax owed @ 24.0%
- −$350
- After-tax cash flow
- $3,038/yr
For passive investors: Depreciation is non-cash, so a rental often shows a tax loss while cash-flowing — sheltering income. Rental losses are passive: they offset passive income freely, and up to $25,000/yr can offset ordinary (W-2) income if you actively participate and your MAGI is under $100k (phasing out to $0 by $150k); unused losses carry forward. On sale, claimed depreciation is recaptured at up to 25%, and gains may owe capital-gains tax (a 1031 exchange can defer both). Figures are a year-1 estimate at your 24.0% rate — not tax advice; consult a CPA.
Schools (NCES district)
- District
- Roseville Community Schools
- NCES district ID
- 2630210
- Math proficiency
- 11% ▼ -8.00%
- Reading proficiency
- 24% ▼ -7.00%
- Median HH income
- $41,590
- Composite
- 14.98/100
- National rank
- #9363
- State rank
- #483 of 540 in MI
Livability — Roseville
- Score
- 72/100
- State rank
- #258
- US rank
- #6400
Category grades
Schools grade is shown separately in the Schools card above.
Census & demographics
- Census place
- Roseville, MI
- County
- Macomb County · 638,552 people
- City population
- 47,123
- Metro
- Detroit-Warren-Dearborn, MI
- Population (ZIP)
- 47,123
- Household income
- $62,182
- Rent vs Own
- Severe rent burden
- 1712.0
Population outlook (Macomb County) Hauer SSP2
- Today (2025)
- 925,296 people
- By 2030
- 948,226 · +2.5%
- By 2040
- 983,961 · +6.3%
- By 2050
- 1,010,200 · +9.2%
- By 2075
- 1,076,222 · +16.3%
- By 2100
- 1,077,065 · +16.4%
Race, ethnicity, and origin ACS 2023
- Neighborhood character
- Predominantly White (65%)
- Race & ethnicity
- White 65% Black 23% Two or more races 7% Hispanic / Latino 4% Asian 2%
- Common ancestry
- Romanian 12% Lithuanian 4% Slovak 2%
- Foreign-born
- 5% · Canada
- Languages at home
- 93% English-only · Spanish 2% Russian/Polish/Slavic 1% Other Indo-European 1%
Political lean MEDSL · Macomb
- 2024 margin
- R (+13.7) · D 42.2% · R 55.9% · Other 1.9%
- 2008→2024 swing
- -22.3pp toward R · 2008: 8.6pp · 2024: -13.7pp
- All cycles
- 2024: R+13.7 2020: R+8.1 2016: R+11.6 2012: D+4.0 2008: D+8.6
Not yet ingested
- Civics
- —
Market trends
- HPI YoY
- ▼ -232.95%
- Current HPI
- 217.4171
- Rent YoY
- ▲ 0.39%
- Metro
- Detroit-Warren-Dearborn, MI
- State GDP YoY
- ▲ 1.37%
- F500 in state
- 28
Industry mix (Fortune 500 HQ in MI)
| Industry | F500 HQs | Revenue |
|---|---|---|
| Automotive Parts | 3 | $48B |
|
||
| Automotive | 2 | $372B |
|
||
| Chemicals | 1 | $45B |
|
||
| Automotive Retail | 1 | $29B |
|
||
| Healthcare / Medical Devices | 1 | $23B |
|
||
| Automotive Technology | 1 | $20B |
|
||
Price history
1 event — show timeline
- 2026-05-29 Coming Soon $125,000 MiRealSource-MiMLS
Property tax history
+3.9%/yrLatest (2025): $1,431 · +4.3% YoY. Source: county tax records.
Cash-flow waterfall
monthlySold comps — $/sqft
last 12 mo · ≤1 miLoading sold comps…