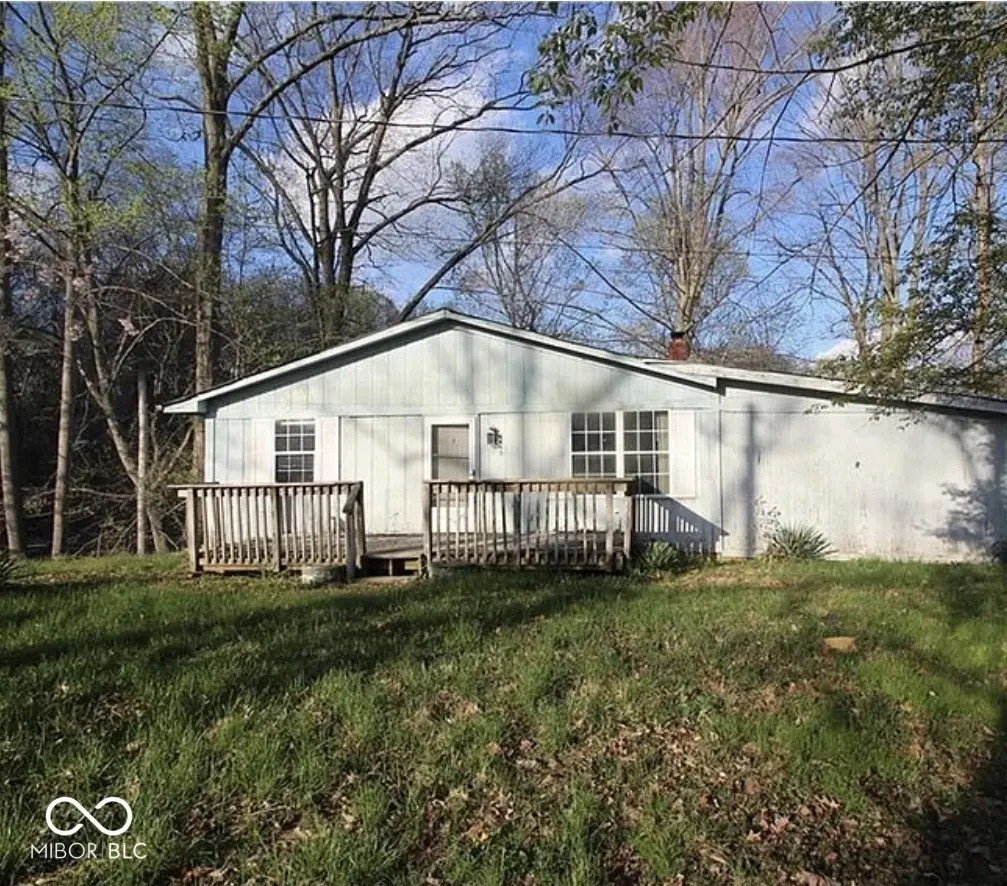
8816 S Ayres Dr · Prince's Lakes, IN
Flood risk 1/10 · Minimal
- FEMA flood zone
- X (unshaded)
- Chance of flooding over 30 yrs
- 0.0%
- Est. flood insurance / yr
- $473 – $860
Fire risk 1/10 · Minimal
- Est. fire insurance / yr
- $717 – $1,331
Heat risk 3/10 · Minor
- Hot days now (above 102°F)
- 7 days/yr
- Hot days in 30 yrs
- 19 days/yr
Wind risk 2/10 · Minimal
- Chance of severe wind over 30 yrs
- 0.0%
Air-quality risk 2/10 · Minimal
- Unhealthy air days now
- 1 days/yr
- Unhealthy air days in 30 yrs
- 2 days/yr
Risk factors via First Street. Map © Google.
Why this score? — see what drove the D grade
The composite is a weighted blend of 9 inputs, each scored 0–100. Each bar is that input's sub-score; the figure is the points it added to the 100-point composite (weight × sub-score).
- Cash flow +13.1/30.0
- ARV discount +7.5/15.0
- 1% rule +4.9/10.0
- DSCR +3.9/10.0
- Schools +3.9/10.0
- Rent growth +2.5/5.0
- Livability +2.5/5.0
- Condition / age +2.5/5.0
- Appreciation +0.0/10.0
$110,000
🖨 Deal sheet 📄 Offer letter ✓ Due diligence
Listing remarks
Knock Knock!! Who's there? OPPORTUNITY This property will need some love, no doubt about it. With the right vision anr the right team, the posssibiliteis are endless. This property provides a serene escape, designed for both relaxation and everyday living. The home offers 3 beds and 1 bath with the possiblity of adding on more. .With a thoughtful layout and a welcoming atmosphere, this property invites you to imagine your future here.
Key facts
- 0.32 acre lot
- Built 1979
- Listed 23 days
Property features AI
Exterior
- Utilities: Public water; Municipal sewer connected
- Home design: Single family residence; One level; Fixer condition; Quarter to half acre lot (approximately 0.32 acre)
- Construction: Vinyl with stone exterior; Concrete perimeter foundation
- Exterior features: Lake privileges and water access; Storage
Interior
- Kitchen: Gas oven
- Bedrooms: 3 bedrooms on the main level; Primary bedroom with walk-in closet
- Bathrooms: 1 full bathroom on the main level with a full shower stall
- Heating & cooling: Forced air heating; Central air conditioning
- Interior features: Unfinished basement; Storage; Has a view
- Laundry & utility: Washer and dryer; Laundry room on the main level
Neighborhood map
What this means for you Summary
Snapshot
- This is a 3-bed/1.0-bath single-family listed at $110k.
Deal economics
- At list price, monthly cash flow is $-5 ($-56/yr) — negative.
- To cash-flow at today's rent, offer at most $109k (0.7% below list).
- To meet the 1% rule (rent ≥ 1% of price), the offer needs to be $109k (1.1% below list).
- Recommended offer: $108k (1.5% below list) — sets the bar for market timing.
Location & tenants
- Location reads: area grade D — affects rentability + tenant quality, not the cash-flow math above.
- Nineveh-Hensley-Jackson United (rural): math 41% / reading 48% proficiency, ranked #93 of 301 in IN (top 31%) — families likely to look elsewhere, expect single-tenant / working-renter base with shorter leases.
- Zoned schools: Indian Creek Elementary School (520 students, 39% FRL); Indian Creek Sr High School (math 37% / reading 67%, grade D+, #106 of 369 statewide, top 31%, 624 students, 30% FRL).
- Market conditions: 76 active listings in the ZIP; 1,133 units permitted in Johnson County in 2024 (0 in 5+ unit buildings).
Forward outlook
- Local home prices are declining (-3.0%/yr); year-one equity from $761 of loan paydown is wiped out by about $3k of value loss. Plan a longer hold.
- Johnson County population projected at +26% by 2050 — long-run rental-demand tailwind backs the buy-and-hold thesis.
Negotiation context
- It's been on market 23 days — a 2% lower offer ($108k) is reasonable based on typical stale-listing flexibility.
- 12 sale attempts since 19y ago with the ask held roughly flat each time — persistent listings suggest the price (not the market) is what's stuck; bring a comps-based counter.
Risks & watch-outs
- Watch-outs: property tax is 2.6% of price.
Questions for the listing agent
- What do current leases actually rent for vs. the listed asking? Can we see a recent rent roll and the last 12 months of T-12 income?
- Built in 1979 — when were the roof, HVAC, electrical panel, plumbing, and water heater last replaced?
- Property tax is high relative to price — has the assessment been appealed recently, and will the sale trigger a re-assessment?
- Is there a deadline driving the sale (1031 exchange, divorce, estate, relocation)? That informs how much negotiation room exists.
- The area grade is low — what's the realistic commute time and amenity access for the typical tenant pool here? Any planned neighborhood developments (good or bad) we should know about?
- What's the average days-on-market for RENTAL listings here right now (not sales)? A rising rental-DOM trend means longer vacancies and softer asking-rent achievability than the comps imply.
- What's the recent tenant-quality profile in this submarket — average credit score on applications, eviction rate, late-payment / NSF rate, and stable-employment percentage? A property-management company in the area should have these aggregated.
- How much new for-sale + rental construction is in the pipeline within 1–3 miles? Heavy new supply typically softens prices + rents 12–24 months out; constrained supply supports both.
Investment metrics
- 1% rule
- 0.99% ✗
- Cap rate
- 6.24%
- Cash-on-cash
- -0.18%
- DSCR
- 0.99
- GRM
- 8.4
CMA / ARV
- ARV (on-the-fly)
- $250,984
- Comps found
- 4
Show comp detail 4 sales within ~0.75 mi
| Address | Dist | Beds/Ba | Sqft | Sold | Price | $/sf | Match |
|---|---|---|---|---|---|---|---|
| 861 & 862 W Bauer Dr | 0.33mi | 2/1.5 (-1) | 1,076 (-2%) | 14mo | $279,900 | $260 | 63 |
| 427 W Greenwalt Dr | 0.72mi | 2/1.0 (-1) | 1,100 (+0%) | 0mo | $225,000 | $205 | 61 |
| 943 W Lakeview Dr | 0.66mi | 2/2.0 (-1) | 1,152 (+5%) | 21mo | $240,000 | $208 | 35 |
| 8041 S Peoga Rd | 0.71mi | 2/1.0 (-1) | 960 (-12%) | 16mo | $220,000 | $229 | 28 |
Match score weights: distance 35% · size 25% · config 20% · recency 20%. Top-matched comps best support the ARV.
Projected returns pro-forma
-3.0% appreciation · 3.0% rent growth · sell at horizon
- IRR
- -16.5%
- Equity multiple
- 0.41×
- Total profit
- $-18,041
- Equity at exit
- $16,401
- IRR
- -8.1%
- Equity multiple
- 0.49×
- Total profit
- $-15,766
- Equity at exit
- $9,511
Cash invested: $30,800 (down + closing). Projections, not guarantees.
Landlord ↔ Tenant lean methodology
- Overall (STATE)
- 90 Strongly Landlord-Friendly
- State Indiana
- 90 Strongly Landlord-Friendly · R+11
- County
- — inherits STATE
- City
- — inherits STATE
ZIP-level market 46164
- Active inventory
- 76
- Price-to-rent
- 8.4×
Monthly cashflow live
- Estimated rent
- $1,088 medium interval (Pro) →
- Mortgage (P&I)
- −$577
- Tax from tax record
- −$242 /mo · $2,898/yr
- Insurance
- −$46
- HOA
- −$0
- Vacancy / Maint / Mgmt
- −$228
- Net cashflow
- $-5
Break-even live
UW: 25.0% down · 7.5% · 30yr · 1.5% tax · 5.0% vac · 8.0% maint · 8.0% mgmt
Financing live
Cash to close
- Down payment
- $27,500
- Closing costs
- $3,300
- Reserves months
- —
- Total cash needed
- —
Loan-product check · same deal, 3 products live
Conventional
25% down · 7.5% · 30yr
- Down + closing
- —
- Monthly P&I
- —
- Monthly cashflow
- —
- DSCR
- —
- Eligible?
- —
Personal DTI + credit; lowest rate.
DSCR
20% down · 8.5% · 30yr
- Down + closing
- —
- Monthly P&I
- —
- Monthly cashflow
- —
- DSCR
- —
- Eligible?
- —
No personal income docs; deal must DSCR.
Hard money
10% down · 12.0% · 12mo
- Down + closing
- —
- Monthly P&I
- —
- Monthly cashflow
- —
- DSCR
- —
- Eligible?
- —
Short-term bridge; refi at stabilization.
Listing history 35 events
-
2026-06-18days on market $110,000 Active 23 DOM
-
2026-06-17days on market $110,000 Active 22 DOM
-
2026-06-16days on market $110,000 Active 21 DOM
-
2026-06-15days on market $110,000 Active 20 DOM
-
2026-06-13days on market $110,000 Active 18 DOM
-
2026-06-09days on market $110,000 Active 14 DOM
-
2026-06-08days on market $110,000 Active 13 DOM
-
2026-06-07days on market $110,000 Active 12 DOM
-
2026-06-03days on market $110,000 Active 8 DOM
-
2026-06-02days on market $110,000 Active 7 DOM
-
2026-06-01days on market $110,000 Active 6 DOM
-
2026-05-31days on market $110,000 Active 5 DOM
-
2026-05-26$110,000 Active
-
2021-08-08historical
-
2021-06-25status Active
-
2021-06-14status Pending
-
2021-05-28price $69,900
-
2021-04-26$79,900
-
2021-04-23$79,900 Active
-
2019-02-13historical
-
2019-02-01status Active
-
2019-01-31historical
-
2019-01-22price $56,900
-
2018-12-14price $59,900
-
2018-09-06$64,900 Active
-
2018-07-23$64,900
-
2012-11-21$30,000
-
2010-11-05historical
-
2010-05-04$75,000
-
2010-05-01historical
-
2009-09-02$109,800
-
2009-07-01historical
-
2008-03-27$110,500
-
2008-03-06historical
-
2007-09-08$129,900
ⓘ Source: listings_history table (triggers on properties + properties_extension) + one-shot
backfill from property_details.listing_events for pre-trigger history.
Tax reassessment forecast IN · Partial reset (capped growth)
- Current annual tax
- $2,898 · $242/mo
- Projected year-2 tax
- $2,898 · $242/mo
- Expected delta
- $0/yr ($0/mo · 0.0%)
ⓘ Screening estimate from a state-policy table — verify with the county assessor before closing.
Climate risk First Street
- Flood 1/10 Low FEMA zone X (unshaded) · 0% chance over 30 yrs
- Wildfire 1/10 Low
- Heat 3/10 Moderate 7 d/yr ≥102°F today · 19 d/yr by 30 yrs out
- Wind 2/10 Low 0% chance of damaging wind over 30 yrs
- Air quality 2/10 Low 1 unhealthy d/yr today · 2 by 30 yrs out
Nearby sold comps map
Loading sold comps map…
Walkable amenities ~0.75 mi
Loading nearby amenities…
Taxation est. · year 1
- Rental income
- $13,056
- − Mortgage interest
- −$6,162
- − Property taxes
- −$2,898
- − Insurance
- −$550
- − Repairs & maintenance
- −$1,044
- − Management
- −$1,044
- − Depreciation
- −$3,200
- Taxable loss
- −$1,843
- Est. tax savings @ 24.0%
- +$442
- After-tax cash flow
- $386/yr
For passive investors: Depreciation is non-cash, so a rental often shows a tax loss while cash-flowing — sheltering income. Rental losses are passive: they offset passive income freely, and up to $25,000/yr can offset ordinary (W-2) income if you actively participate and your MAGI is under $100k (phasing out to $0 by $150k); unused losses carry forward. On sale, claimed depreciation is recaptured at up to 25%, and gains may owe capital-gains tax (a 1031 exchange can defer both). Figures are a year-1 estimate at your 24.0% rate — not tax advice; consult a CPA.
Schools (NCES district)
- District
- Nineveh-Hensley-Jackson United
- NCES district ID
- 1807620
- Math proficiency
- 41% ▼ -12.00%
- Reading proficiency
- 48% ▼ -10.00%
- Median HH income
- $59,040
- Composite
- 39.07/100
- National rank
- #4053
- State rank
- #93 of 301 in IN
Livability — Prince's Lakes
No livability data for this city. (Only ~50 U.S. cities are tracked.)
Census & demographics
- Census place
- Prince's Lakes, IN
- Population (ZIP)
- 3,991
Population outlook (Johnson County) Hauer SSP2
- Today (2025)
- 170,080 people
- By 2030
- 179,983 · +5.8%
- By 2040
- 198,580 · +16.8%
- By 2050
- 214,661 · +26.2%
- By 2075
- 247,990 · +45.8%
- By 2100
- 257,821 · +51.6%
Race, ethnicity, and origin ACS 2023
- Neighborhood character
- Predominantly White (96%)
- Race & ethnicity
- White 96% Two or more races 2% Pacific Islander 1%
- Common ancestry
- Romanian 3% Lithuanian 2% Slovak 2%
- Foreign-born
- 1% · Canada
- Languages at home
- 98% English-only · Spanish 2%
Political lean MEDSL · Johnson
- 2024 margin
- Solid R (+34.3) · D 32.0% · R 66.3% · Other 1.7%
- 2008→2024 swing
- -8.9pp toward R · 2008: -25.5pp · 2024: -34.3pp
- All cycles
- 2024: R+34.3 2020: R+34.1 2016: R+42.5 2012: R+38.5 2008: R+25.5
Not yet ingested
- Civics
- —
Market trends
- HPI YoY
- ▼ -129.89%
- Current HPI
- 218.3894
- Rent YoY
- —
- Metro
- —
- State GDP YoY
- ▲ 2.90%
- F500 in state
- 18
Industry mix (Fortune 500 HQ in IN)
| Industry | F500 HQs | Revenue |
|---|---|---|
| Industrial Machinery | 2 | $37B |
|
||
| Healthcare | 1 | $177B |
|
||
| Pharmaceuticals | 1 | $45B |
|
||
| Metals / Steel | 1 | $18B |
|
||
| Agriculture | 1 | $17B |
|
||
| Packaging | 1 | $12B |
|
||
Price history
-15.3% since first listed23 events — show timeline
- 2026-05-26 Listed $110,000 MIBOR as Distributed by MLS Grid
- 2021-08-08 Listing Removed — MIBOR as Distributed by MLS Grid
- 2021-06-25 Relisted — MIBOR as Distributed by MLS Grid
- 2021-06-14 Pending — MIBOR as Distributed by MLS Grid
- 2021-05-28 Price Changed $69,900 MIBOR as Distributed by MLS Grid
- 2021-04-26 Listed $79,900 IRMLS
- 2021-04-23 Listed $79,900 MIBOR as Distributed by MLS Grid
- 2019-02-13 Listing Removed — MIBOR as Distributed by MLS Grid
- 2019-02-01 Relisted — MIBOR as Distributed by MLS Grid
- 2019-01-31 Listing Removed — MIBOR as Distributed by MLS Grid
- 2019-01-22 Price Changed $56,900 MIBOR as Distributed by MLS Grid
- 2018-12-14 Price Changed $59,900 MIBOR as Distributed by MLS Grid
- 2018-09-06 Listed $64,900 MIBOR as Distributed by MLS Grid
- 2018-07-23 Listed $64,900 IRMLS
- 2012-11-21 Listed $30,000 MIBOR as Distributed by MLS Grid
- 2010-11-05 Listing Removed — MIBOR as Distributed by MLS Grid
- 2010-05-04 Listed $75,000 MIBOR as Distributed by MLS Grid
- 2010-05-01 Listing Removed — MIBOR as Distributed by MLS Grid
- 2009-09-02 Listed $109,800 MIBOR as Distributed by MLS Grid
- 2009-07-01 Listing Removed — MIBOR as Distributed by MLS Grid
- 2008-03-27 Listed $110,500 MIBOR as Distributed by MLS Grid
- 2008-03-06 Listing Removed — MIBOR as Distributed by MLS Grid
- 2007-09-08 Listed $129,900 MIBOR as Distributed by MLS Grid
Property tax history
+5.9%/yrLatest (2024): $2,898 · +8.6% YoY. Source: county tax records.
Cash-flow waterfall
monthlySold comps — $/sqft
last 12 mo · ≤1 miLoading sold comps…