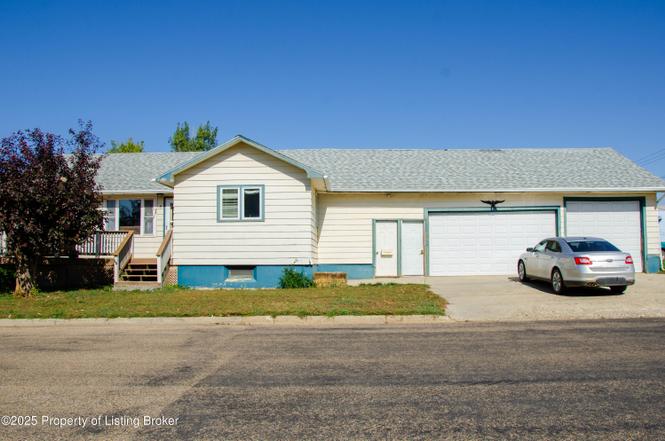
18 2nd St SW · Bowman, ND
Flood risk No data
- FEMA flood zone
- —
- Chance of flooding over 30 yrs
- —
- Est. flood insurance / yr
- —
Fire risk No data
- Est. fire insurance / yr
- —
Heat risk No data
- Hot days now (above threshold)
- —
- Hot days in 30 yrs
- —
Wind risk No data
- Chance of severe wind over 30 yrs
- —
Air-quality risk No data
- Unhealthy air days now
- —
- Unhealthy air days in 30 yrs
- —
Risk factors via First Street. Map © Google.
Why this score? — see what drove the D- grade
The composite is a weighted blend of 9 inputs, each scored 0–100. Each bar is that input's sub-score; the figure is the points it added to the 100-point composite (weight × sub-score).
- ARV discount +7.5/15.0
- Cash flow +7.4/30.0
- Appreciation +6.2/10.0
- Livability +3.6/5.0
- Schools +3.2/10.0
- Rent growth +2.5/5.0
- Condition / age +2.5/5.0
- DSCR +1.6/10.0
- 1% rule +0.8/10.0
$159,500
🖨 Deal sheet 📄 Offer letter ✓ Due diligence
Key facts
- 3 garage spots
- Built 1950
- Listed 260 days
Property features AI
Exterior
- Parking: 3-car garage; Garage door opener
- Utilities: Public sewer
- Home design: Single-family residence; Residential property; Low-density residential zoning
- Construction: Has basement (finished, concrete)
- Exterior features: Irregular-shaped lot; Public sewer
Interior
- Kitchen: Dishwasher; Microwave; Range; Refrigerator
- Bathrooms: 3 full bathrooms
- Heating & cooling: Forced-air heating; Central cooling
- Interior features: Window coverings; Finished concrete basement
- Laundry & utility: Washer; Dryer
Neighborhood map
What this means for you Summary
Snapshot
- This is a 4-bed/3.0-bath single-family listed at $160k.
Deal economics
- At list price, monthly cash flow is $-204 ($-2k/yr) — negative.
- To cash-flow at today's rent, offer at most $123k (22.6% below list).
- To meet the 1% rule (rent ≥ 1% of price), the offer needs to be $93k (41.9% below list).
- Recommended offer: $93k (41.9% below list) — sets the bar for 1% rule.
Location & tenants
- Location reads 71/100 on livability (#53 in ND) — a middle-class / working-renter tenant base. Strengths: crime A+, cost of living A+, housing A+; Watch: health & safety D+, schools D, amenities F.
- Bowman County 1 (rural): math 34% / reading 39% proficiency, ranked #33 of 53 in ND (top 62%) — families likely to look elsewhere, expect single-tenant / working-renter base with shorter leases; only 13% free/reduced lunch — higher-income household profile.
- Market conditions: 16 active listings in the ZIP; 3 units permitted in Bowman County in 2024 (0 in 5+ unit buildings).
Forward outlook
- In year one you build about $5k of equity ($1k loan paydown + $4k appreciation (2.5% local appreciation)).
- Bowman County population projected at +39% by 2050 — long-run rental-demand tailwind backs the buy-and-hold thesis.
- By year 7, paydown + projected appreciation supports a ~$32k cash-out refi (75% LTV) — recoverable capital for the next deal without selling this one.
Negotiation context
- It's been on market 260 days — a 12% lower offer ($140k) is reasonable based on typical stale-listing flexibility.
- 2 sale attempts; this cycle's ask has dropped $16k (9%) from the opening price — seller is motivated, your offer sets the floor, not the list.
Risks & watch-outs
- Watch-outs: built in 1950 — expect roof / HVAC / electrical / plumbing capex.
Questions for the listing agent
- What do current leases actually rent for vs. the listed asking? Can we see a recent rent roll and the last 12 months of T-12 income?
- It's been on market 260 days. Have you received any prior offers? Is the seller open to a 42% concession, seller financing, or rate buy-down credit?
- Built in 1950 — when were the roof, HVAC, electrical panel, plumbing, and water heater last replaced?
- Why hasn't it sold? Are there any deal-killer items the seller is aware of (foundation, flood, title, zoning, code violations)?
- Is there a deadline driving the sale (1031 exchange, divorce, estate, relocation)? That informs how much negotiation room exists.
- Schools are D-rated, which usually means shorter tenancies and higher turnover. Who's the typical renter profile here, and what's been the actual vacancy rate?
- The area grade is low — what's the realistic commute time and amenity access for the typical tenant pool here? Any planned neighborhood developments (good or bad) we should know about?
- What's the average days-on-market for RENTAL listings here right now (not sales)? A rising rental-DOM trend means longer vacancies and softer asking-rent achievability than the comps imply.
- What's the recent tenant-quality profile in this submarket — average credit score on applications, eviction rate, late-payment / NSF rate, and stable-employment percentage? A property-management company in the area should have these aggregated.
- How much new for-sale + rental construction is in the pipeline within 1–3 miles? Heavy new supply typically softens prices + rents 12–24 months out; constrained supply supports both.
Investment metrics
- 1% rule
- 0.58% ✗
- Cap rate
- 4.76%
- Cash-on-cash
- -5.49%
- DSCR
- 0.76
- GRM
- 14.3
CMA / ARV
No comps found within radius.
Show comp detail 10 sales within ~0.75 mi
| Address | Dist | Beds/Ba | Sqft | Sold | Price | $/sf | Match |
|---|---|---|---|---|---|---|---|
| 112 1st Ave SW | 0.03mi | 4/2.0 | 1,728 | 10mo | $139,000 | $80 | 74 |
| 19 2nd Ave NW | 0.21mi | 4/2.0 | 1,706 | 10mo | $229,000 | $134 | 65 |
| 201 6th Ave NW | 0.47mi | 4/3.0 | 2,391 | 4mo | $229,900 | $96 | 62 |
| 112 2nd Ave SW | 0.10mi | 3/1.0 (-1) | 1,786 | 10mo | $109,000 | $61 | 61 |
| 308 4th Ave SW | 0.27mi | 4/2.0 | 3,164 | 12mo | $369,000 | $117 | 61 |
| 507 1st St SW | 0.35mi | 4/3.5 | 3,194 | 13mo | $240,000 | $75 | 58 |
| 208 3rd Ave SW | 0.18mi | 3/1.5 (-1) | 1,626 | 13mo | $229,000 | $141 | 57 |
| 206 2nd Ave SW | 0.11mi | 3/1.0 (-1) | 832 | 24mo | $75,000 | $90 | 49 |
| 501 4th St SW | 0.35mi | 5/3.0 (+1) | 4,480 | 22mo | $329,900 | $74 | 48 |
| 902 1st St NW | 0.62mi | 3/1.0 (-1) | 2,294 | 22mo | $259,000 | $113 | 27 |
Match score weights: distance 35% · size 25% · config 20% · recency 20%. Top-matched comps best support the ARV.
Projected returns pro-forma
2.48% appreciation · 3.0% rent growth · sell at horizon
- IRR
- 0.7%
- Equity multiple
- 1.04×
- Total profit
- $1,783
- Equity at exit
- $67,117
- IRR
- 4.6%
- Equity multiple
- 1.67×
- Total profit
- $29,989
- Equity at exit
- $99,991
Cash invested: $44,660 (down + closing). Projections, not guarantees.
Landlord ↔ Tenant lean methodology
- Overall (STATE)
- 82 Strongly Landlord-Friendly
- State North Dakota
- 82 Strongly Landlord-Friendly · R+20
- County
- — inherits STATE
- City
- — inherits STATE
ZIP-level market 58623
- Home prices YoY
- 2.5%
- Active inventory
- 16
- Price-to-rent
- 14.3×
Monthly cashflow live
- Estimated rent
- $927 medium interval (Pro) →
- Mortgage (P&I)
- −$836
- Tax from tax record
- −$34 /mo · $405/yr
- Insurance
- −$66
- HOA
- −$0
- Vacancy / Maint / Mgmt
- −$195
- Net cashflow
- $-204
Break-even live
UW: 25.0% down · 7.5% · 30yr · 1.5% tax · 5.0% vac · 8.0% maint · 8.0% mgmt
Financing live
Cash to close
- Down payment
- $39,875
- Closing costs
- $4,785
- Reserves months
- —
- Total cash needed
- —
Loan-product check · same deal, 3 products live
Conventional
25% down · 7.5% · 30yr
- Down + closing
- —
- Monthly P&I
- —
- Monthly cashflow
- —
- DSCR
- —
- Eligible?
- —
Personal DTI + credit; lowest rate.
DSCR
20% down · 8.5% · 30yr
- Down + closing
- —
- Monthly P&I
- —
- Monthly cashflow
- —
- DSCR
- —
- Eligible?
- —
No personal income docs; deal must DSCR.
Hard money
10% down · 12.0% · 12mo
- Down + closing
- —
- Monthly P&I
- —
- Monthly cashflow
- —
- DSCR
- —
- Eligible?
- —
Short-term bridge; refi at stabilization.
Listing history 17 events
-
2026-06-18days on market $159,500 Active 260 DOM
-
2026-06-17days on market $159,500 Active 259 DOM
-
2026-06-16days on market $159,500 Active 258 DOM
-
2026-06-15days on market $159,500 Active 257 DOM
-
2026-06-13days on market $159,500 Active 255 DOM
-
2026-06-12days on market $159,500 Active 254 DOM
-
2026-06-09days on market $159,500 Active 251 DOM
-
2026-06-08days on market $159,500 Active 250 DOM
-
2026-06-07days on market $159,500 Active 249 DOM
-
2026-06-05days on market $159,500 Active 247 DOM
-
2026-06-04days on market $159,500 Active 245 DOM
-
2026-06-02days on market $159,500 Active 244 DOM
-
2026-06-01days on market $159,500 Active 243 DOM
-
2026-05-31days on market $159,500 Active 242 DOM
-
2026-04-23price $159,500
-
2026-04-14status Active
-
2025-09-24$175,000 Active
ⓘ Source: listings_history table (triggers on properties + properties_extension) + one-shot
backfill from property_details.listing_events for pre-trigger history.
Tax reassessment forecast ND · Resets to sale price
- Current annual tax
- $405 · $34/mo
- Projected year-2 tax
- $1,563 · $130/mo
- Expected delta
- +$1,158/yr (+$97/mo · 286.0%)
ⓘ Screening estimate from a state-policy table — verify with the county assessor before closing.
Nearby sold comps map
Loading sold comps map…
Walkable amenities ~0.75 mi
Loading nearby amenities…
Taxation est. · year 1
- Rental income
- $11,123
- − Mortgage interest
- −$8,934
- − Property taxes
- −$405
- − Insurance
- −$798
- − Repairs & maintenance
- −$890
- − Management
- −$890
- − Depreciation
- −$4,640
- Taxable loss
- −$5,434
- Est. tax savings @ 24.0%
- +$1,304
- After-tax cash flow
- $-1,149/yr
For passive investors: Depreciation is non-cash, so a rental often shows a tax loss while cash-flowing — sheltering income. Rental losses are passive: they offset passive income freely, and up to $25,000/yr can offset ordinary (W-2) income if you actively participate and your MAGI is under $100k (phasing out to $0 by $150k); unused losses carry forward. On sale, claimed depreciation is recaptured at up to 25%, and gains may owe capital-gains tax (a 1031 exchange can defer both). Figures are a year-1 estimate at your 24.0% rate — not tax advice; consult a CPA.
Schools (NCES district)
- District
- Bowman County 1
- NCES district ID
- 3803200
- Math proficiency
- 34% ▼ -5.00%
- Reading proficiency
- 39% ▲ 1.00%
- Median HH income
- $55,839
- Composite
- 32.14/100
- National rank
- #5794
- State rank
- #33 of 53 in ND
Livability — Bowman
- Score
- 71/100
- State rank
- #53
- US rank
- #6541
Category grades
Schools grade is shown separately in the Schools card above.
Census & demographics
- Census place
- Bowman, ND
- Population (ZIP)
- 1,918
Population outlook (Bowman County) Hauer SSP2
- Today (2025)
- 3,563 people
- By 2030
- 3,792 · +6.4%
- By 2040
- 4,299 · +20.7%
- By 2050
- 4,955 · +39.1%
- By 2075
- 7,322 · +105.5%
- By 2100
- 9,588 · +169.1%
Race, ethnicity, and origin ACS 2023
- Neighborhood character
- Predominantly White (92%)
- Race & ethnicity
- White 92% Hispanic / Latino 7%
- Hispanic origin (detail)
- Mexican 6%
- Common ancestry
- Portuguese 26% Romanian 6% Iranian 1%
- Foreign-born
- 2% · Canada
- Languages at home
- 94% English-only · Spanish 4% German/W. Germanic 1% Other Indo-European 1%
Political lean MEDSL · Bowman
- 2024 margin
- Solid R (+73.1) · D 12.8% · R 85.9% · Other 1.2%
- 2008→2024 swing
- -34.7pp toward R · 2008: -38.4pp · 2024: -73.1pp
- All cycles
- 2024: R+73.1 2020: R+70.4 2016: R+68.8 2012: R+50.1 2008: R+38.4
Not yet ingested
- Civics
- —
Market trends
- HPI YoY
- ▲ 2.48%
- Current HPI
- 102.2128
- Rent YoY
- —
- Metro
- —
- State GDP YoY
- ▲ 2.09%
- F500 in state
- 2
Industry mix (Fortune 500 HQ in ND)
| Industry | F500 HQs | Revenue |
|---|---|---|
| Utilities / Construction | 1 | $6B |
|
||
Price history
-8.9% since first listed3 events — show timeline
- 2026-04-23 Price Changed $159,500 Badlands BOR MLS
- 2026-04-14 Relisted — Badlands BOR MLS
- 2025-09-24 Listed $175,000 Badlands BOR MLS
Property tax history
+10.0%/yrLatest (2017): $405 · +8.9% YoY. Source: county tax records.
Cash-flow waterfall
monthlySold comps — $/sqft
last 12 mo · ≤1 miLoading sold comps…