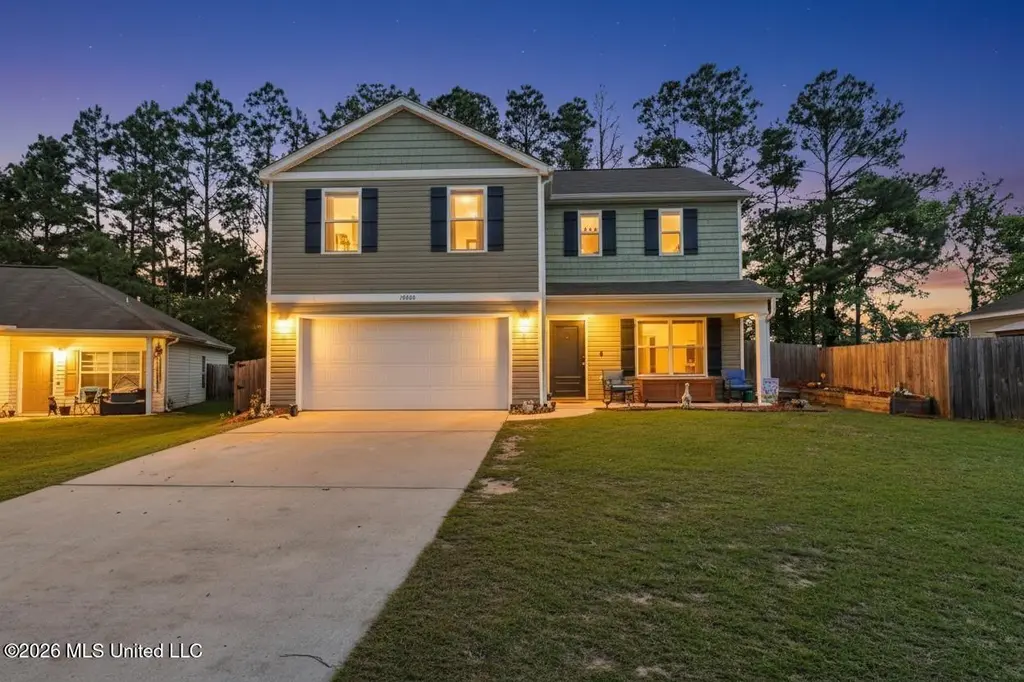
18520 Devin Ct · Lyman, MS
Flood risk 1/10 · Minimal
- FEMA flood zone
- X (unshaded)
- Chance of flooding over 30 yrs
- 0.0%
- Est. flood insurance / yr
- $507 – $1,088
Fire risk 6/10 · Moderate
- Est. fire insurance / yr
- $1,241 – $2,305
Heat risk 10/10 · Severe
- Hot days now (above 108°F)
- 7 days/yr
- Hot days in 30 yrs
- 22 days/yr
Wind risk 9/10 · Severe
- Chance of severe wind over 30 yrs
- 99.0%
Air-quality risk 1/10 · Minimal
- Unhealthy air days now
- 0 days/yr
- Unhealthy air days in 30 yrs
- 0 days/yr
Risk factors via First Street. Map © Google.
Why this score? — see what drove the D+ grade
The composite is a weighted blend of 9 inputs, each scored 0–100. Each bar is that input's sub-score; the figure is the points it added to the 100-point composite (weight × sub-score).
- Cash flow +13.7/30.0
- ARV discount +11.4/15.0
- Rent growth +4.2/5.0
- Schools +4.2/10.0
- DSCR +4.1/10.0
- Livability +3.5/5.0
- 1% rule +3.3/10.0
- Condition / age +2.5/5.0
- Appreciation +0.0/10.0
$249,000
🖨 Deal sheet 📄 Offer letter ✓ Due diligence
Listing remarks MLS
Don't miss this spacious 4-bedroom, 2.5 bath, home nestled in a quiet neighborhood in Gulfport! With 2,450 square feet of living space, this well-built 2015 home offers the room and flexibility today's buyers are looking for, whether you're growing a family, working from home, or simply craving extra space. The open floor plan creates a natural flow between the living, dining, and kitchen areas, making everyday living and entertaining a breeze. The generously sized primary suite provides a private retreat, while the additional bedrooms offer versatility for family, guests, or a home office. Tucked away on Devin Court, you'll enjoy the peace of a cul-de-sac setting while staying just minutes from Canal Road, with easy interstate access to Keesler Air Force Base, the Seabee Base, Gulf Coast beaches, shopping, dining, and casino entertainment. The nearby Windance Golf Course is also just a short drive away. This home is a fantastic opportunity in a convenient Gulfport location, schedule your private showing today!
Key facts
- Open floor plan
- Cul-de-sac setting
- Private retreat
Tags
Neighborhood map
What this means for you Summary
Snapshot
- This is a 4-bed/1.5-bath single-family listed at $249k.
Deal economics
- At list price, monthly cash flow is $16 ($195/yr) — positive.
- The deal already cash-flows at list — no discount required.
- To meet the 1% rule (rent ≥ 1% of price), the offer needs to be $207k (16.7% below list).
- Recommended offer: $207k (16.7% below list) — sets the bar for 1% rule.
- Cap rate 6.4% vs local median 4.4% in Lyman — top-decile yield for the area; either an underpriced asset or a hidden risk that comps aren't pricing in. Stress-test before assuming the spread holds.
Location & tenants
- Location reads 69/100 on livability (#47 in MS) — a middle-class / working-renter tenant base. Strengths: crime A+, employment A+, cost of living A+; Watch: schools F, amenities F, commute F.
- Harrison County School District (rural): math 52% / reading 46% proficiency, ranked #14 of 130 in MS (top 11%) — families likely to look elsewhere, expect single-tenant / working-renter base with shorter leases; 62% free/reduced lunch — lower-income household profile, screen leases tightly.
- Market conditions: Rents rising fast (+7.0%/yr); 763 active listings in the ZIP; 6 comparable units currently listed for rent nearby; rentals lingering (median 44d on market — plan ~5-8 weeks vacancy on turnover, expect pricing pressure); 50% of comp listings sitting > 30 days — soft ceiling on asking rent; 2,194 units permitted in Harrison County in 2024 (0 in 5+ unit buildings).
- This rent runs 40% of the median local income ($63k/yr) — at the standard rent-burdened threshold; future hikes will face affordability resistance.
Forward outlook
- Local home prices are declining (-3.0%/yr); year-one equity from $2k of loan paydown is wiped out by about $7k of value loss. Plan a longer hold.
- Harrison County population projected at +27% by 2050 — long-run rental-demand tailwind backs the buy-and-hold thesis.
Negotiation context
- It's been on market 63 days — a 6% lower offer ($234k) is reasonable based on typical stale-listing flexibility.
- 3 sale attempts since 11y ago with the ask held roughly flat each time — persistent listings suggest the price (not the market) is what's stuck; bring a comps-based counter.
Risks & watch-outs
- Climate carrying-cost: severe wind risk, 99% chance of damaging wind over 30y; major wildfire risk; extreme-heat days projected 7→22/yr by 2055 (HVAC capex compounding) — expect insurance premiums to compound above CPI over the hold.
Questions for the listing agent
- It's been on market 63 days. Have you received any prior offers? Is the seller open to a 17% concession, seller financing, or rate buy-down credit?
- Why hasn't it sold? Are there any deal-killer items the seller is aware of (foundation, flood, title, zoning, code violations)?
- Is there a deadline driving the sale (1031 exchange, divorce, estate, relocation)? That informs how much negotiation room exists.
- Schools are F-rated, which usually means shorter tenancies and higher turnover. Who's the typical renter profile here, and what's been the actual vacancy rate?
- The area grade is low — what's the realistic commute time and amenity access for the typical tenant pool here? Any planned neighborhood developments (good or bad) we should know about?
- What's the average days-on-market for RENTAL listings here right now (not sales)? A rising rental-DOM trend means longer vacancies and softer asking-rent achievability than the comps imply.
- What's the recent tenant-quality profile in this submarket — average credit score on applications, eviction rate, late-payment / NSF rate, and stable-employment percentage? A property-management company in the area should have these aggregated.
- How much new for-sale + rental construction is in the pipeline within 1–3 miles? Heavy new supply typically softens prices + rents 12–24 months out; constrained supply supports both.
Investment metrics
- 1% rule
- 0.83% ✗
- Cap rate
- 6.37%
- Cash-on-cash
- 0.28%
- DSCR
- 1.01
- GRM
- 10.0
CMA / ARV
- ARV (median comp)
- $272,918
- List price
- $249,000
- Delta
- -8.76%
- Verdict
- FAIR
- Comps
- 20 within 1.0 mi
Show comp detail 12 sales within ~0.75 mi
| Address | Dist | Beds/Ba | Sqft | Sold | Price | $/sf | Match |
|---|---|---|---|---|---|---|---|
| 18348 Robinson Rd | 0.09mi | 3/2.0 (-1) | 1,916 (-14%) | 7mo | $263,000 | $137 | 59 |
| 17980 Restoration Cir | 0.31mi | 3/2.0 (-1) | 2,046 (-9%) | 11mo | $255,000 | $125 | 55 |
| 18020 Canal Landing Dr | 0.34mi | 4/2.0 | 1,930 (-14%) | 6mo | $265,000 | $137 | 54 |
| 12024 Ol Oaks Dr | 0.61mi | 4/3.0 | 2,297 (+2%) | 13mo | $379,999 | $165 | 50 |
| 12334 Fox Forrest Dr | 0.55mi | 4/2.5 | 2,152 (-4%) | 18mo | $280,000 | $130 | 49 |
| 12412 Fox Forest Dr | 0.51mi | 3/2.0 (-1) | 2,037 (-9%) | 12mo | $399,000 | $196 | 44 |
| 13058 W Echo Dr | 0.74mi | 3/2.0 (-1) | 2,100 (-6%) | 12mo | $299,000 | $142 | 38 |
| 11973 Live Oak Cv | 0.69mi | 5/3.0 (+1) | 2,550 (+14%) | 1mo | $485,000 | $190 | 32 |
| 12015 Ol Oaks Dr | 0.63mi | 4/3.0 | 2,487 (+11%) | 19mo | $439,900 | $177 | 31 |
| 17989 Tingle Dr | 0.66mi | 5/3.0 (+1) | 2,034 (-9%) | 18mo | $307,900 | $151 | 28 |
| 17982 Tingle Dr | 0.66mi | 5/3.0 (+1) | 2,034 (-9%) | 18mo | $313,900 | $154 | 28 |
| 17970 Tingle Dr | 0.68mi | 5/3.0 (+1) | 2,034 (-9%) | 18mo | $307,900 | $151 | 27 |
Match score weights: distance 35% · size 25% · config 20% · recency 20%. Top-matched comps best support the ARV.
Projected returns pro-forma
-3.0% appreciation · 6.99% rent growth · sell at horizon
- IRR
- -11.7%
- Equity multiple
- 0.56×
- Total profit
- $-30,678
- Equity at exit
- $37,127
- IRR
- 2.3%
- Equity multiple
- 1.19×
- Total profit
- $13,103
- Equity at exit
- $21,529
Cash invested: $69,720 (down + closing). Projections, not guarantees.
Landlord ↔ Tenant lean methodology
- Overall (STATE)
- 90 Strongly Landlord-Friendly
- State Mississippi
- 90 Strongly Landlord-Friendly · R+11
- County
- — inherits STATE
- City
- — inherits STATE
ZIP-level market 39503
- Home prices YoY
- -21.5%
- Rents YoY
- 7.0%
- Active inventory
- 763
- Price-to-rent
- 10.0×
Monthly cashflow live
- Estimated rent
- $2,075 high interval (Pro) →
- Mortgage (P&I)
- −$1,306
- Tax from tax record
- −$213 /mo · $2,559/yr
- Insurance
- −$104
- HOA
- −$0
- Vacancy / Maint / Mgmt
- −$436
- Net cashflow
- $16
Break-even live
UW: 25.0% down · 7.5% · 30yr · 1.5% tax · 5.0% vac · 8.0% maint · 8.0% mgmt
Financing live
Cash to close
- Down payment
- $62,250
- Closing costs
- $7,470
- Reserves months
- —
- Total cash needed
- —
Loan-product check · same deal, 3 products live
Conventional
25% down · 7.5% · 30yr
- Down + closing
- —
- Monthly P&I
- —
- Monthly cashflow
- —
- DSCR
- —
- Eligible?
- —
Personal DTI + credit; lowest rate.
DSCR
20% down · 8.5% · 30yr
- Down + closing
- —
- Monthly P&I
- —
- Monthly cashflow
- —
- DSCR
- —
- Eligible?
- —
No personal income docs; deal must DSCR.
Hard money
10% down · 12.0% · 12mo
- Down + closing
- —
- Monthly P&I
- —
- Monthly cashflow
- —
- DSCR
- —
- Eligible?
- —
Short-term bridge; refi at stabilization.
Rent comps 6 comps
| Address | Beds | Baths | Sqft | Rent | $/sqft | DOM | Units | Dist |
|---|---|---|---|---|---|---|---|---|
| 18137 Canal Junction Dr Gulfport, MS | 3.0 | 2.0 | 1413 | $1,750 | $1.24 | 43d | 1 | 0.22mi |
| 17986 Restoration Cir Gulfport, MS | 3.0 | 2.5 | 1730 | $2,100 | $1.21 | 13d | 1 | 0.31mi |
| 11604 Caroline Ct Gulfport, MS | 3.0 | 2.0 | 1660 | $1,850 | $1.11 | 44d | 1 | 0.82mi |
| 11415 Oak Alley Dr Gulfport, MS | 3.0 | 2.0 | 1495 | $1,975 | $1.32 | 13d | 1 | 0.86mi |
| 11571 Caroline Ct Gulfport, MS | 3.0 | 2.0 | 1950 | $2,000 | $1.03 | 43d | 1 | 0.89mi |
| 18052 Green Leaves Dr Gulfport, MS | 3.0 | 2.0 | 1485 | $1,800 | $1.21 | 21d | 1 | 1.01mi |
Listing history 22 events
-
2026-06-18days on market $249,000 Active 63 DOM
-
2026-06-17days on market $249,000 Active 62 DOM
-
2026-06-16days on market $249,000 Active 61 DOM
-
2026-06-15days on market $249,000 Active 60 DOM
-
2026-06-14days on market $249,000 Active 58 DOM
-
2026-06-13days on market $249,000 Active 57 DOM
-
2026-06-10days on market $249,000 Active 55 DOM
-
2026-06-09days on market $249,000 Active 54 DOM
-
2026-06-08days on market $249,000 Active 53 DOM
-
2026-06-07days on market $249,000 Active 52 DOM
-
2026-06-02days on market $249,000 Active 47 DOM
-
2026-06-01days on market $249,000 Active 46 DOM
-
2026-05-31days on market $249,000 Active 45 DOM
-
2026-05-30days on market $249,000 Active 44 DOM
-
2026-04-16$249,000 Active 1029-char remark
Show marketing remark (1029 chars)
Don't miss this spacious 4-bedroom, 2.5 bath, home nestled in a quiet neighborhood in Gulfport! With 2,450 square feet of living space, this well-built 2015 home offers the room and flexibility today's buyers are looking for, whether you're growing a family, working from home, or simply craving extra space. The open floor plan creates a natural flow between the living, dining, and kitchen areas, making everyday living and entertaining a breeze. The generously sized primary suite provides a private retreat, while the additional bedrooms offer versatility for family, guests, or a home office. Tucked away on Devin Court, you'll enjoy the peace of a cul-de-sac setting while staying just minutes from Canal Road, with easy interstate access to Keesler Air Force Base, the Seabee Base, Gulf Coast beaches, shopping, dining, and casino entertainment. The nearby Windance Golf Course is also just a short drive away. This home is a fantastic opportunity in a convenient Gulfport location, schedule your private showing today!
-
2026-02-05historical
-
2025-12-18price $249,900
-
2025-11-20price $260,000
-
2025-11-03$265,000 Active
-
2016-01-06soldstatus
-
2015-12-09soldstatus
-
2015-05-26$159,900
ⓘ Source: listings_history table (triggers on properties + properties_extension) + one-shot
backfill from property_details.listing_events for pre-trigger history.
Tax reassessment forecast MS · Resets to sale price
- Current annual tax
- $2,559 · $213/mo
- Projected year-2 tax
- $2,559 · $213/mo
- Expected delta
- $0/yr ($0/mo · 0.0%)
ⓘ Screening estimate from a state-policy table — verify with the county assessor before closing.
Climate risk First Street
- Flood 1/10 Low FEMA zone X (unshaded) · 0% chance over 30 yrs
- Wildfire 6/10 Major
- Heat 10/10 Extreme 7 d/yr ≥108°F today · 22 d/yr by 30 yrs out
- Wind 9/10 Extreme 99% chance of damaging wind over 30 yrs
- Air quality 1/10 Low 0 unhealthy d/yr today · 0 by 30 yrs out
Nearby sold comps map
Loading sold comps map…
Walkable amenities ~0.75 mi
Loading nearby amenities…
Taxation est. · year 1
- Rental income
- $24,897
- − Mortgage interest
- −$13,948
- − Property taxes
- −$2,559
- − Insurance
- −$1,245
- − Repairs & maintenance
- −$1,992
- − Management
- −$1,992
- − Depreciation
- −$7,244
- Taxable loss
- −$4,082
- Est. tax savings @ 24.0%
- +$980
- After-tax cash flow
- $1,175/yr
For passive investors: Depreciation is non-cash, so a rental often shows a tax loss while cash-flowing — sheltering income. Rental losses are passive: they offset passive income freely, and up to $25,000/yr can offset ordinary (W-2) income if you actively participate and your MAGI is under $100k (phasing out to $0 by $150k); unused losses carry forward. On sale, claimed depreciation is recaptured at up to 25%, and gains may owe capital-gains tax (a 1031 exchange can defer both). Figures are a year-1 estimate at your 24.0% rate — not tax advice; consult a CPA.
Schools (NCES district)
- District
- Harrison County School District
- NCES district ID
- 2801770
- Math proficiency
- 52% ▼ -4.00%
- Reading proficiency
- 46% ▼ -4.00%
- Median HH income
- $46,504
- Composite
- 41.66/100
- National rank
- #3419
- State rank
- #14 of 130 in MS
Livability — Lyman
- Score
- 69/100
- State rank
- #47
- US rank
- #8189
Category grades
Schools grade is shown separately in the Schools card above.
Census & demographics
- County
- Harrison County · 178,171 people
- Metro
- Gulfport-Biloxi, MS
- Population (ZIP)
- 55,059
- Household income
- $62,641
- Rent vs Own
- Severe rent burden
- 1686.0
Population outlook (Harrison County) Hauer SSP2
- Today (2025)
- 228,444 people
- By 2030
- 241,942 · +5.9%
- By 2040
- 267,531 · +17.1%
- By 2050
- 291,062 · +27.4%
- By 2075
- 346,711 · +51.8%
- By 2100
- 378,165 · +65.5%
Race, ethnicity, and origin ACS 2023
- Neighborhood character
- Diverse neighborhood (Simpson 0.58)
- Race & ethnicity
- White 58% Black 27% Two or more races 9% Hispanic / Latino 6% Asian 2%
- Hispanic origin (detail)
- Mexican 2% Puerto Rican 1%
- Common ancestry
- Lithuanian 5% Slovak 1% Portuguese 1%
- Foreign-born
- 3% · Canada
- Languages at home
- 95% English-only · Spanish 3%
Political lean MEDSL · Harrison
- 2024 margin
- Strong R (+28.9) · D 35.0% · R 63.9% · Other 1.1%
- 2008→2024 swing
- -2.9pp toward R · 2008: -26.0pp · 2024: -28.9pp
- All cycles
- 2024: R+28.9 2020: R+25.2 2016: R+30.7 2012: R+26.6 2008: R+26.0
Not yet ingested
- Civics
- —
Market trends
- HPI YoY
- ▼ -51.39%
- Current HPI
- 187.285
- Rent YoY
- ▲ 6.99%
- Metro
- Gulfport-Biloxi, MS
- State GDP YoY
- —
- F500 in state
- 0
Price history
+55.7% since first listed8 events — show timeline
- 2026-04-16 Listed $249,000 MLSU
- 2026-02-05 Listing Removed — MLSU
- 2025-12-18 Price Changed $249,900 MLSU
- 2025-11-20 Price Changed $260,000 MLSU
- 2025-11-03 Listed $265,000 MLSU
- 2016-01-06 Sold (Public Records) — Public Records
- 2015-12-09 Sold (MLS) — MLSU
- 2015-05-26 Listed $159,900 MLSU
Property tax history
+0.1%/yrLatest (2025): $2,559 · +4.2% YoY. Source: county tax records.
Cash-flow waterfall
monthlySold comps — $/sqft
last 12 mo · ≤1 miLoading sold comps…