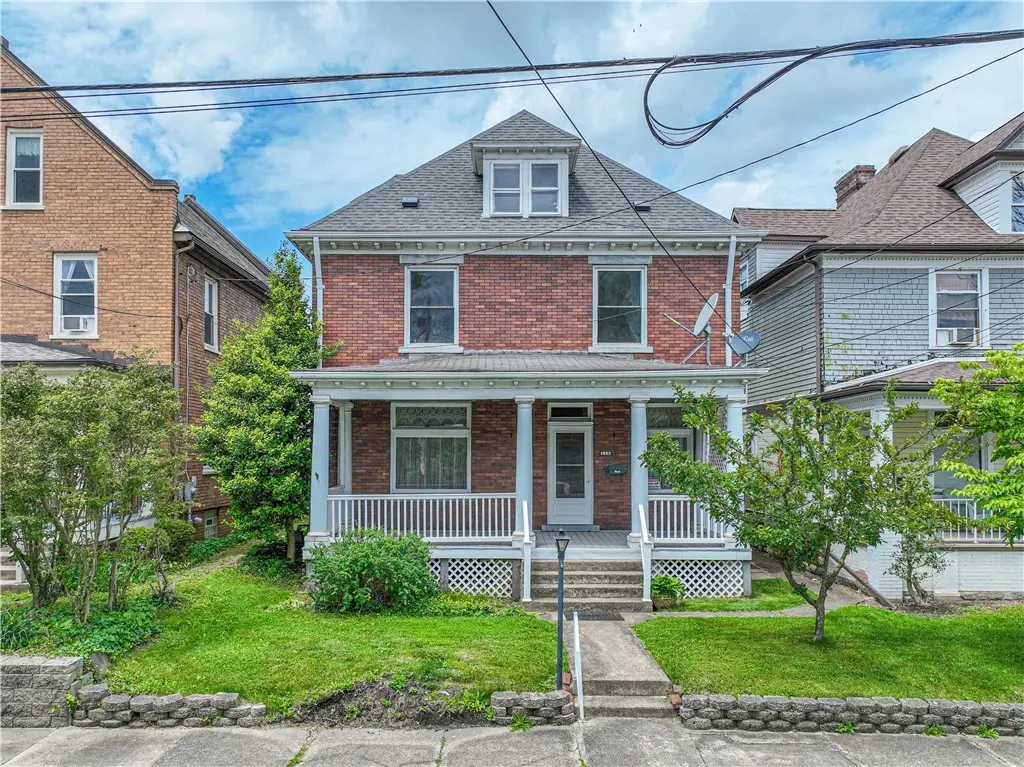
114 Union St · Uniontown, PA
Flood risk 1/10 · Minimal
- FEMA flood zone
- X (unshaded)
- Chance of flooding over 30 yrs
- 0.0%
- Est. flood insurance / yr
- $473 – $860
Fire risk 1/10 · Minimal
- Est. fire insurance / yr
- $511 – $949
Heat risk 4/10 · Minor
- Hot days now (above 96°F)
- 7 days/yr
- Hot days in 30 yrs
- 18 days/yr
Wind risk 2/10 · Minimal
- Chance of severe wind over 30 yrs
- —
Air-quality risk 2/10 · Minimal
- Unhealthy air days now
- 1 days/yr
- Unhealthy air days in 30 yrs
- 2 days/yr
Risk factors via First Street. Map © Google.
Why this score? — see what drove the B grade
The composite is a weighted blend of 9 inputs, each scored 0–100. Each bar is that input's sub-score; the figure is the points it added to the 100-point composite (weight × sub-score).
- Cash flow +27.6/30.0
- ARV discount +13.0/15.0
- DSCR +9.7/10.0
- 1% rule +8.0/10.0
- Livability +3.5/5.0
- Schools +3.1/10.0
- Rent growth +2.5/5.0
- Condition / age +2.5/5.0
- Appreciation +0.9/10.0
$139,900
🖨 Deal sheet 📄 Offer letter ✓ Due diligence
Listing remarks
Welcome to this 3-bedroom, 1-bath two-story home featuring beautiful wood trim and hardwood flooring throughout. The main floor offers spacious living areas with stunning wood pocket doors that provide privacy and add timeless charm. The kitchen includes tile flooring and a small center island. Additional features include a walk-in closet, ceiling fans throughout, central air conditioning, and an unfinished basement for storage or future possibilities. Outside, enjoy a fenced backyard, detached garage, and additional carport. Conveniently located within walking distance to schools and shopping, this home offers comfort, character, and everyday convenience. Schedule your private showing toda
Key facts
- Hardwood flooring
- Wood pocket doors
- Walk-in closet
Tags
Property features AI
Exterior
- Parking: Detached garage; On-street parking; Garage available
- Utilities: Public water; Public sewer
- Home design: 2-story residence; Resale property
- Construction: Lot approximately 0.1 acres
- Exterior features: Public water; Public sewer
Interior
- Kitchen: Stove; Some gas appliances
- Bathrooms: One full bathroom
- Heating & cooling: Gas forced air heating; Central air conditioning
- Interior features: Unfinished basement
Neighborhood map
What this means for you Summary
Snapshot
- This is a 3-bed/1.0-bath single-family listed at $140k.
Deal economics
- At list price, monthly cash flow is $417 ($5k/yr) — positive.
- The deal already cash-flows at list — no discount required.
- Meets the 1% rule at list price ($2k rent vs $140k).
- Recommended offer: $138k (1.5% below list) — sets the bar for market timing.
Location & tenants
- Location reads 70/100 on livability (#750 in PA) — a middle-class / working-renter tenant base. Strengths: cost of living A+, health & safety A+, housing A; Watch: schools C-, amenities D+, crime F.
- Uniontown Area SD (suburban): math 27% / reading 49% proficiency, ranked #392 of 539 in PA (top 73%) — families likely to look elsewhere, expect single-tenant / working-renter base with shorter leases.
- Market conditions: 145 active listings in the ZIP; 2 comparable units currently listed for rent nearby; 201 units permitted in Fayette County in 2024 (10 in 5+ unit buildings).
Forward outlook
- Local home prices are declining (-3.0%/yr); year-one equity from $967 of loan paydown is wiped out by about $4k of value loss. Plan a longer hold.
- Fayette County population projected at -19% by 2050 — secular population decline; favor cash flow + early exit over multi-decade hold.
- At projected returns (-3.0% appreciation + 3.0% rent growth), your $39k cash investment doubles in ~9 years — after that, you're playing with house money.
Negotiation context
- It's been on market 20 days — a 2% lower offer ($138k) is reasonable based on typical stale-listing flexibility.
- Current owner paid $88k; list at $140k implies a 58% gain — meaningful room to come down on a strong offer.
Risks & watch-outs
- Watch-outs: built in 1900 — expect roof / HVAC / electrical / plumbing capex.
Questions for the listing agent
- Built in 1900 — when were the roof, HVAC, electrical panel, plumbing, and water heater last replaced?
- Is there a deadline driving the sale (1031 exchange, divorce, estate, relocation)? That informs how much negotiation room exists.
- Crime grade is F in this area — have there been break-ins, vandalism, or insurance claims at this property in the last 3 years? What carrier currently insures it and at what premium?
- What's the average days-on-market for RENTAL listings here right now (not sales)? A rising rental-DOM trend means longer vacancies and softer asking-rent achievability than the comps imply.
- What's the recent tenant-quality profile in this submarket — average credit score on applications, eviction rate, late-payment / NSF rate, and stable-employment percentage? A property-management company in the area should have these aggregated.
- How much new for-sale + rental construction is in the pipeline within 1–3 miles? Heavy new supply typically softens prices + rents 12–24 months out; constrained supply supports both.
Investment metrics
- 1% rule
- 1.30% ✓
- Cap rate
- 9.87%
- Cash-on-cash
- 12.76%
- DSCR
- 1.57
- GRM
- 6.4
CMA / ARV
- ARV (on-the-fly)
- $159,296
- Comps found
- 6
Show comp detail 6 sales within ~0.75 mi
| Address | Dist | Beds/Ba | Sqft | Sold | Price | $/sf | Match |
|---|---|---|---|---|---|---|---|
| 105 Patty Dr | 0.43mi | 3/2.0 | 2,198 (+5%) | 6mo | $270,000 | $123 | 63 |
| 59 Lebanon Ave | 0.44mi | 4/2.0 (+1) | 2,098 (+0%) | 10mo | $159,900 | $76 | 62 |
| 158 Clarendon Ave | 0.46mi | 3/2.5 | 1,800 (-14%) | 2mo | $120,000 | $67 | 47 |
| 51 Francis St | 0.67mi | 3/3.0 | 2,124 (+1%) | 14mo | $280,000 | $132 | 47 |
| 122 Shaffer St | 0.52mi | 4/1.5 (+1) | 1,832 (-13%) | 7mo | $75,000 | $41 | 42 |
| 14 Leith St | 0.73mi | 4/2.0 (+1) | 1,848 (-12%) | 10mo | $40,000 | $22 | 29 |
Match score weights: distance 35% · size 25% · config 20% · recency 20%. Top-matched comps best support the ARV.
Projected returns pro-forma
-3.0% appreciation · 3.0% rent growth · sell at horizon
- IRR
- 2.6%
- Equity multiple
- 1.10×
- Total profit
- $3,923
- Equity at exit
- $20,860
- IRR
- 12.2%
- Equity multiple
- 1.97×
- Total profit
- $37,829
- Equity at exit
- $12,096
Cash invested: $39,172 (down + closing). Projections, not guarantees.
Landlord ↔ Tenant lean methodology
- Overall (STATE)
- 62 Landlord-Friendly
- State Pennsylvania
- 62 Landlord-Friendly · EVEN
- County
- — inherits STATE
- City
- — inherits STATE
ZIP-level market 15401
- Home prices YoY
- -3.8%
- Active inventory
- 145
- Price-to-rent
- 6.4×
Monthly cashflow live
- Estimated rent
- $1,821 medium interval (Pro) →
- Mortgage (P&I)
- −$734
- Tax from tax record
- −$230 /mo · $2,761/yr
- Insurance
- −$58
- HOA
- −$0
- Vacancy / Maint / Mgmt
- −$382
- Net cashflow
- $417
Break-even live
UW: 25.0% down · 7.5% · 30yr · 1.5% tax · 5.0% vac · 8.0% maint · 8.0% mgmt
Financing live
Cash to close
- Down payment
- $34,975
- Closing costs
- $4,197
- Reserves months
- —
- Total cash needed
- —
Loan-product check · same deal, 3 products live
Conventional
25% down · 7.5% · 30yr
- Down + closing
- —
- Monthly P&I
- —
- Monthly cashflow
- —
- DSCR
- —
- Eligible?
- —
Personal DTI + credit; lowest rate.
DSCR
20% down · 8.5% · 30yr
- Down + closing
- —
- Monthly P&I
- —
- Monthly cashflow
- —
- DSCR
- —
- Eligible?
- —
No personal income docs; deal must DSCR.
Hard money
10% down · 12.0% · 12mo
- Down + closing
- —
- Monthly P&I
- —
- Monthly cashflow
- —
- DSCR
- —
- Eligible?
- —
Short-term bridge; refi at stabilization.
Rent comps 2 comps
| Address | Beds | Baths | Sqft | Rent | $/sqft | DOM | Units | Dist |
|---|---|---|---|---|---|---|---|---|
| 14 Leith St Uniontown, PA | 4.0 | 2.0 | 1848 | $1,600 | $0.87 | 43d | 1 | 0.75mi |
| 189 Wiggins Ln Uniontown, PA | 3.0 | 2.0 | 1663 | $2,300 | $1.38 | 43d | 1 | 1.46mi |
Listing history 16 events
-
2026-06-18days on market $139,900 Active 20 DOM
-
2026-06-17days on market $139,900 Active 19 DOM
-
2026-06-16days on market $139,900 Active 18 DOM
-
2026-06-15days on market $139,900 Active 17 DOM
-
2026-06-13days on market $139,900 Active 15 DOM
-
2026-06-12days on market $139,900 Active 14 DOM
-
2026-06-09days on market $139,900 Active 11 DOM
-
2026-06-08days on market $139,900 Active 10 DOM
-
2026-06-08days on market $139,900 Active 9 DOM
-
2026-06-07days on market $139,900 Active 8 DOM
-
2026-06-04days on market $139,900 Active 5 DOM
-
2026-06-02days on market $139,900 Active 4 DOM
-
2026-06-01days on market $139,900 Active 3 DOM
-
2026-05-31days on market $139,900 Active 2 DOM
-
2026-05-29$139,900 Active
-
2002-03-29soldstatus $88,500
ⓘ Source: listings_history table (triggers on properties + properties_extension) + one-shot
backfill from property_details.listing_events for pre-trigger history.
Tax reassessment forecast PA · Partial reset (capped growth)
- Current annual tax
- $2,761 · $230/mo
- Projected year-2 tax
- $2,761 · $230/mo
- Expected delta
- $0/yr ($0/mo · 0.0%)
ⓘ Screening estimate from a state-policy table — verify with the county assessor before closing.
Climate risk First Street
- Flood 1/10 Low FEMA zone X (unshaded) · 0% chance over 30 yrs
- Wildfire 1/10 Low
- Heat 4/10 Moderate 7 d/yr ≥96°F today · 18 d/yr by 30 yrs out
- Wind 2/10 Low
- Air quality 2/10 Low 1 unhealthy d/yr today · 2 by 30 yrs out
Nearby sold comps map
Loading sold comps map…
Walkable amenities ~0.75 mi
Loading nearby amenities…
Taxation est. · year 1
- Rental income
- $21,852
- − Mortgage interest
- −$7,837
- − Property taxes
- −$2,761
- − Insurance
- −$700
- − Repairs & maintenance
- −$1,748
- − Management
- −$1,748
- − Depreciation
- −$4,070
- Taxable income
- $2,989
- Est. tax owed @ 24.0%
- −$717
- After-tax cash flow
- $4,282/yr
For passive investors: Depreciation is non-cash, so a rental often shows a tax loss while cash-flowing — sheltering income. Rental losses are passive: they offset passive income freely, and up to $25,000/yr can offset ordinary (W-2) income if you actively participate and your MAGI is under $100k (phasing out to $0 by $150k); unused losses carry forward. On sale, claimed depreciation is recaptured at up to 25%, and gains may owe capital-gains tax (a 1031 exchange can defer both). Figures are a year-1 estimate at your 24.0% rate — not tax advice; consult a CPA.
Schools (NCES district)
- District
- Uniontown Area SD
- NCES district ID
- 4224150
- Math proficiency
- 27% ▼ -8.00%
- Reading proficiency
- 49% ▼ -6.00%
- Median HH income
- $36,744
- Composite
- 31.48/100
- National rank
- #5977
- State rank
- #392 of 539 in PA
Livability — Uniontown
- Score
- 70/100
- State rank
- #750
- US rank
- #7482
Category grades
Schools grade is shown separately in the Schools card above.
Census & demographics
- Census place
- Uniontown, PA
- Population (ZIP)
- 30,230
Population outlook (Fayette County) Hauer SSP2
- Today (2025)
- 127,561 people
- By 2030
- 123,206 · -3.4%
- By 2040
- 113,232 · -11.2%
- By 2050
- 103,468 · -18.9%
- By 2075
- 83,185 · -34.8%
- By 2100
- 62,384 · -51.1%
Race, ethnicity, and origin ACS 2023
- Neighborhood character
- Predominantly White (86%)
- Race & ethnicity
- White 86% Black 7% Two or more races 5% Hispanic / Latino 1%
- Common ancestry
- Romanian 8% Scotch-Irish 2% Iranian 1%
- Foreign-born
- 2% · Canada
- Languages at home
- 97% English-only · Spanish 1% Arabic 1%
Political lean MEDSL · Fayette
- 2024 margin
- Solid R (+37.9) · D 30.8% · R 68.7%
- 2008→2024 swing
- -37.5pp toward R · 2008: -0.4pp · 2024: -37.9pp
- All cycles
- 2024: R+37.9 2020: R+33.5 2016: R+31.0 2012: R+8.3 2008: R+0.4
Not yet ingested
- Civics
- —
Market trends
- HPI YoY
- ▼ -8.29%
- Current HPI
- 210.1257
- Rent YoY
- —
- Metro
- —
- State GDP YoY
- ▲ 1.68%
- F500 in state
- 34
Industry mix (Fortune 500 HQ in PA)
| Industry | F500 HQs | Revenue |
|---|---|---|
| Healthcare | 2 | $309B |
|
||
| Insurance | 2 | $27B |
|
||
| Telecommunications / Media | 1 | $124B |
|
||
| Industrial Distribution | 1 | $22B |
|
||
| Financial Services | 1 | $20B |
|
||
| Chemicals / Materials | 1 | $18B |
|
||
Price history
+58.1% since first listed2 events — show timeline
- 2026-05-29 Listed $139,900 West Penn MLS
- 2002-03-29 Sold (Public Records) $88,500 Public Records
Property tax history
+2.5%/yrLatest (2026): $2,761 · +2.4% YoY. Source: county tax records.
Cash-flow waterfall
monthlySold comps — $/sqft
last 12 mo · ≤1 miLoading sold comps…