8200 Jantzen Rd · Hughson, CA
Flood risk 1/10 · Minimal
- FEMA flood zone
- X (unshaded)
- Chance of flooding over 30 yrs
- 0.0%
- Est. flood insurance / yr
- $507 – $1,088
Fire risk 7/10 · Major
- Est. fire insurance / yr
- $659 – $1,223
Heat risk 7/10 · Major
- Hot days now (above 102°F)
- 7 days/yr
- Hot days in 30 yrs
- 16 days/yr
Wind risk 1/10 · Minimal
- Chance of severe wind over 30 yrs
- —
Air-quality risk 10/10 · Severe
- Unhealthy air days now
- 38 days/yr
- Unhealthy air days in 30 yrs
- 40 days/yr
Risk factors via First Street. Map © Google.
Why this score? — see what drove the B- grade
The composite is a weighted blend of 9 inputs, each scored 0–100. Each bar is that input's sub-score; the figure is the points it added to the 100-point composite (weight × sub-score).
- Cash flow +30.0/30.0
- 1% rule +10.0/10.0
- DSCR +10.0/10.0
- ARV discount +7.5/15.0
- Livability +3.2/5.0
- Rent growth +2.5/5.0
- Condition / age +2.5/5.0
- Schools +2.2/10.0
- Appreciation +0.0/10.0
$119,000
🖨 Deal sheet 📄 Offer letter ✓ Due diligence
Listing remarks
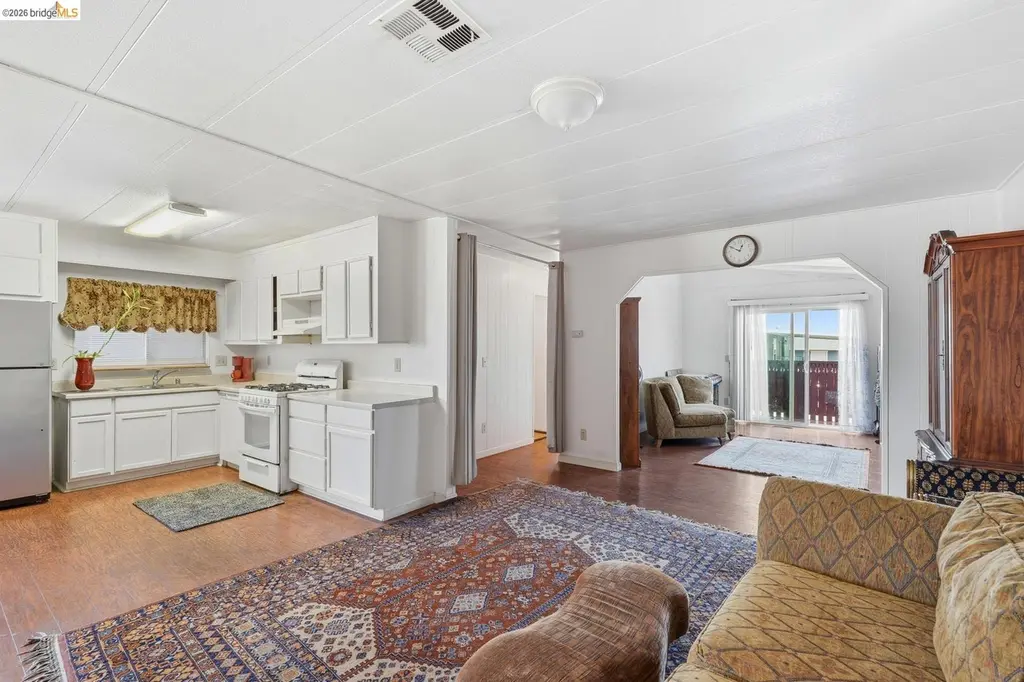
A beautiful split floor plan designed for space and privacy. With common room, dining room, living room and room for 3 cars, this is one of the most affordable ways to own in Modesto. LOW SPACE RENT OF $700 per month. A unique all-age community with dog park, playground, basketball court, private soccer field and clubhouse with river views available for private functions. Just minutes from shopping and popular restaurants. Riverview is pet friendly allowing 2 pets per home, w/ park approval.
Key facts
- Dog park
- Private soccer field
- Split floor plan
Tags
Property features AI
Finance
- HOA & community: Pets allowed (cats and dogs; size and number limits; may require approval); Community clubhouse; Greenbelt; Playground; BBQ area; Dog park; Game court; Guest parking; Community laundry; Picnic area; RV storage; Park interview required; Pet restrictions; Electric and gas metered; Setting: rural
Exterior
- Parking: 2 covered parking spaces; Carport for 2 or more; 2 garage spaces
- Utilities: Internet available; Natural gas connected; Individual electric meter; Individual gas meter
- Home design: Manufactured home in park; Mobile home (double wide, Heritage model)
- Construction: Masonite exterior; Composition shingle roof; Pillar/post/pier foundation; Masonite skirting
- Exterior features: Enclosed patio; Front porch; Back yard; Front yard; Landscaped yard; Garden; Level lot
Interior
- Kitchen: Laminate counters; Dishwasher; Free-standing range (oven/stove); Refrigerator
- Flooring: Laminate flooring; Linoleum flooring; Carpet
- Bathrooms: 2 full bathrooms; Primary bathroom includes shower over tub, tub, and window; Other bathroom includes stall shower
- Heating & cooling: Forced air heating; Central air conditioning
- Interior features: Family room; Mirrored closet doors; Window coverings
- Laundry & utility: Laundry room with washer and dryer; Gas water heater
Neighborhood map
What this means for you Summary
Snapshot
- This is a 2-bed/2.0-bath land listed at $119k.
Deal economics
- At list price, monthly cash flow is $837 ($10k/yr) — positive.
- The deal already cash-flows at list — no discount required.
- Meets the 1% rule at list price ($2k rent vs $119k).
- Recommended offer: $117k (1.5% below list) — sets the bar for market timing.
- Cap rate 14.7% vs local median 3.4% in Hughson — top-decile yield for the area; either an underpriced asset or a hidden risk that comps aren't pricing in. Stress-test before assuming the spread holds.
Location & tenants
- Location reads 63/100 on livability (#458 in CA) — a middle-class / working-renter tenant base. Strengths: crime A+, housing A+, employment A; Watch: amenities F, commute F, cost of living F.
- Empire Union Elementary (suburban): math 25% / reading 25% proficiency, ranked #398 of 517 in CA (top 77%) — low school quality limits family demand, transient renter base, plan for 1-2y turnover; 67% free/reduced lunch — lower-income household profile, screen leases tightly.
- Market conditions: 91 active listings in the ZIP; 1 comparable units currently listed for rent nearby; 923 units permitted in Stanislaus County in 2024 (63 in 5+ unit buildings).
Forward outlook
- Local home prices are declining (-3.0%/yr); year-one equity from $823 of loan paydown is wiped out by about $4k of value loss. Plan a longer hold.
- Stanislaus County population projected at +14% by 2050 — modest demand growth; plan on rents tracking national, not racing it.
- At projected returns (-3.0% appreciation + 3.0% rent growth), your $33k cash investment doubles in ~4 years — after that, you're playing with house money.
Negotiation context
- It's been on market 28 days — a 2% lower offer ($117k) is reasonable based on typical stale-listing flexibility.
Risks & watch-outs
- Climate carrying-cost: major wildfire risk; extreme-heat days projected 7→16/yr by 2055 (HVAC capex compounding) — expect insurance premiums to compound above CPI over the hold.
Questions for the listing agent
- Built in 1977 — when were the roof, HVAC, electrical panel, plumbing, and water heater last replaced?
- Is there a deadline driving the sale (1031 exchange, divorce, estate, relocation)? That informs how much negotiation room exists.
- What's the average days-on-market for RENTAL listings here right now (not sales)? A rising rental-DOM trend means longer vacancies and softer asking-rent achievability than the comps imply.
- What's the recent tenant-quality profile in this submarket — average credit score on applications, eviction rate, late-payment / NSF rate, and stable-employment percentage? A property-management company in the area should have these aggregated.
- How much new for-sale + rental construction is in the pipeline within 1–3 miles? Heavy new supply typically softens prices + rents 12–24 months out; constrained supply supports both.
Investment metrics
- 1% rule
- 1.76% ✓
- Cap rate
- 14.73%
- Cash-on-cash
- 30.13%
- DSCR
- 2.34
- GRM
- 4.7
CMA / ARV
No comps found within radius.
Projected returns pro-forma
-3.0% appreciation · 3.0% rent growth · sell at horizon
- IRR
- 24.8%
- Equity multiple
- 2.02×
- Total profit
- $34,033
- Equity at exit
- $17,743
- IRR
- 32.5%
- Equity multiple
- 3.95×
- Total profit
- $98,377
- Equity at exit
- $10,289
Cash invested: $33,320 (down + closing). Projections, not guarantees.
Landlord ↔ Tenant lean methodology
- Overall (STATE)
- 18 Strongly Tenant-Friendly
- State California
- 18 Strongly Tenant-Friendly · D+13
- County
- — inherits STATE
- City
- — inherits STATE
ZIP-level market 95357
- Home prices YoY
- -28.8%
- Active inventory
- 91
- Price-to-rent
- 4.7×
Monthly cashflow live
- Estimated rent
- $2,100 medium interval (Pro) →
- Mortgage (P&I)
- −$624
- Tax est. 1.5%
- −$149 /mo · $1,785/yr
- Insurance
- −$50
- HOA
- −$0
- Vacancy / Maint / Mgmt
- −$441
- Net cashflow
- $837
Break-even live
UW: 25.0% down · 7.5% · 30yr · 1.5% tax · 5.0% vac · 8.0% maint · 8.0% mgmt
Financing live
Cash to close
- Down payment
- $29,750
- Closing costs
- $3,570
- Reserves months
- —
- Total cash needed
- —
Loan-product check · same deal, 3 products live
Conventional
25% down · 7.5% · 30yr
- Down + closing
- —
- Monthly P&I
- —
- Monthly cashflow
- —
- DSCR
- —
- Eligible?
- —
Personal DTI + credit; lowest rate.
DSCR
20% down · 8.5% · 30yr
- Down + closing
- —
- Monthly P&I
- —
- Monthly cashflow
- —
- DSCR
- —
- Eligible?
- —
No personal income docs; deal must DSCR.
Hard money
10% down · 12.0% · 12mo
- Down + closing
- —
- Monthly P&I
- —
- Monthly cashflow
- —
- DSCR
- —
- Eligible?
- —
Short-term bridge; refi at stabilization.
Rent comps 1 comps
| Address | Beds | Baths | Sqft | Rent | $/sqft | DOM | Units | Dist |
|---|---|---|---|---|---|---|---|---|
| 7237 Yosemite Blvd Modesto, CA | 2.0 | 2.0 | 1200 | $2,100 | $1.75 | 44d | 1 | 1.29mi |
Listing history 19 events
-
2026-06-18days on market $119,000 Active 28 DOM
-
2026-06-17days on market $119,000 Active 27 DOM
-
2026-06-16days on market $119,000 Active 26 DOM
-
2026-06-15days on market $119,000 Active 25 DOM
-
2026-06-14days on market $119,000 Active 23 DOM
-
2026-06-10days on market $119,000 Active 20 DOM
-
2026-06-09days on market $119,000 Active 19 DOM
-
2026-06-08days on market $119,000 Active 18 DOM
-
2026-06-07days on market $119,000 Active 17 DOM
-
2026-06-05days on market $119,000 Active 14 DOM
-
2026-06-03days on market $119,000 Active 13 DOM
-
2026-06-02days on market $119,000 Active 12 DOM
-
2026-06-01days on market $119,000 Active 11 DOM
-
2026-05-31days on market $119,000 Active 10 DOM
-
2026-05-30days on market $119,000 Active 9 DOM
-
2026-05-21$119,000 Active
-
2014-04-23soldstatus $1,300,000
-
1988-09-16soldstatus $2,560,000
-
1986-03-01soldstatus $304,500
ⓘ Source: listings_history table (triggers on properties + properties_extension) + one-shot
backfill from property_details.listing_events for pre-trigger history.
Climate risk First Street
- Flood 1/10 Low FEMA zone X (unshaded) · 0% chance over 30 yrs
- Wildfire 7/10 Severe
- Heat 7/10 Severe 7 d/yr ≥102°F today · 16 d/yr by 30 yrs out
- Wind 1/10 Low
- Air quality 10/10 Extreme 38 unhealthy d/yr today · 40 by 30 yrs out
Nearby sold comps map
Loading sold comps map…
Walkable amenities ~0.75 mi
Loading nearby amenities…
Taxation est. · year 1
- Rental income
- $25,200
- − Mortgage interest
- −$6,666
- − Property taxes
- −$1,785
- − Insurance
- −$595
- − Repairs & maintenance
- −$2,016
- − Management
- −$2,016
- − Depreciation
- −$3,462
- Taxable income
- $8,660
- Est. tax owed @ 24.0%
- −$2,078
- After-tax cash flow
- $7,961/yr
For passive investors: Depreciation is non-cash, so a rental often shows a tax loss while cash-flowing — sheltering income. Rental losses are passive: they offset passive income freely, and up to $25,000/yr can offset ordinary (W-2) income if you actively participate and your MAGI is under $100k (phasing out to $0 by $150k); unused losses carry forward. On sale, claimed depreciation is recaptured at up to 25%, and gains may owe capital-gains tax (a 1031 exchange can defer both). Figures are a year-1 estimate at your 24.0% rate — not tax advice; consult a CPA.
Schools (NCES district)
- District
- Empire Union Elementary
- NCES district ID
- 0612690
- Math proficiency
- 25% ▼ -6.00%
- Reading proficiency
- 25% ▼ -14.00%
- Median HH income
- $49,808
- Composite
- 22.05/100
- National rank
- #8193
- State rank
- #398 of 517 in CA
Livability — Hughson
- Score
- 63/100
- State rank
- #458
- US rank
- #15641
Category grades
Schools grade is shown separately in the Schools card above.
Census & demographics
- Population (ZIP)
- 14,283
Population outlook (Stanislaus County) Hauer SSP2
- Today (2025)
- 579,493 people
- By 2030
- 598,000 · +3.2%
- By 2040
- 630,930 · +8.9%
- By 2050
- 658,300 · +13.6%
- By 2075
- 712,363 · +22.9%
- By 2100
- 719,805 · +24.2%
Race, ethnicity, and origin ACS 2023
- Neighborhood character
- Diverse neighborhood (Simpson 0.64)
- Race & ethnicity
- Hispanic / Latino 46% White 37% Two or more races 16% Black 6% Asian 5% Native American 2% Pacific Islander 1%
- Hispanic origin (detail)
- Mexican 42%
- Common ancestry
- Russian 3% Italian 2% Iranian 2%
- Foreign-born
- 19% · Canada
- Languages at home
- 59% English-only · Spanish 31% Other Asian/Pacific 2% Other Indo-European 2%
Political lean MEDSL · Stanislaus
- 2024 margin
- R (+11.0) · D 43.2% · R 54.2% · Other 2.6%
- 2008→2024 swing
- -12.7pp toward R · 2008: 1.7pp · 2024: -11.0pp
- All cycles
- 2024: R+11.0 2020: D+0.8 2016: D+0.6 2012: D+0.7 2008: D+1.7
Not yet ingested
- Civics
- —
Market trends
- HPI YoY
- ▼ -114.94%
- Current HPI
- 283.9315
- Rent YoY
- —
- Metro
- —
- State GDP YoY
- ▲ 3.21%
- F500 in state
- 116
Industry mix (Fortune 500 HQ in CA)
| Industry | F500 HQs | Revenue |
|---|---|---|
| Technology | 27 | $1,492B |
|
||
| Financial Services | 3 | $174B |
|
||
| Retail | 3 | $44B |
|
||
| Insurance | 3 | $26B |
|
||
| Media / Entertainment | 2 | $115B |
|
||
| Pharmaceuticals / Biotech | 2 | $62B |
|
||
Price history
-60.9% since first listed4 events — show timeline
- 2026-05-21 Listed $119,000 bridgeMLS, Bay East AOR, or Contra Costa AOR
- 2014-04-23 Sold (Public Records) $1,300,000 Public Records
- 1988-09-16 Sold (Public Records) $2,560,000 Public Records
- 1986-03-01 Sold (Public Records) $304,500 Public Records
Property tax history
-0.1%/yrLatest (2025): $27,644 · +2.6% YoY. Source: county tax records.
Cash-flow waterfall
monthlySold comps — $/sqft
last 12 mo · ≤1 miLoading sold comps…