53 Seward Ln · Village Green-Green Ridge, PA
Flood risk 1/10 · Minimal
- FEMA flood zone
- X (unshaded)
- Chance of flooding over 30 yrs
- 0.0%
- Est. flood insurance / yr
- $473 – $860
Fire risk 1/10 · Minimal
- Est. fire insurance / yr
- $511 – $949
Heat risk 7/10 · Major
- Hot days now (above 103°F)
- 7 days/yr
- Hot days in 30 yrs
- 15 days/yr
Wind risk 6/10 · Moderate
- Chance of severe wind over 30 yrs
- 27.0%
Air-quality risk 3/10 · Minor
- Unhealthy air days now
- 2 days/yr
- Unhealthy air days in 30 yrs
- 4 days/yr
Risk factors via First Street. Map © Google.
Why this score? — see what drove the B- grade
The composite is a weighted blend of 9 inputs, each scored 0–100. Each bar is that input's sub-score; the figure is the points it added to the 100-point composite (weight × sub-score).
- Cash flow +25.5/30.0
- ARV discount +15.0/15.0
- DSCR +8.5/10.0
- 1% rule +5.7/10.0
- Schools +4.3/10.0
- Rent growth +2.5/5.0
- Livability +2.5/5.0
- Condition / age +2.5/5.0
- Appreciation +0.0/10.0
$199,900
🖨 Deal sheet 📄 Offer letter ✓ Due diligence
Listing remarks
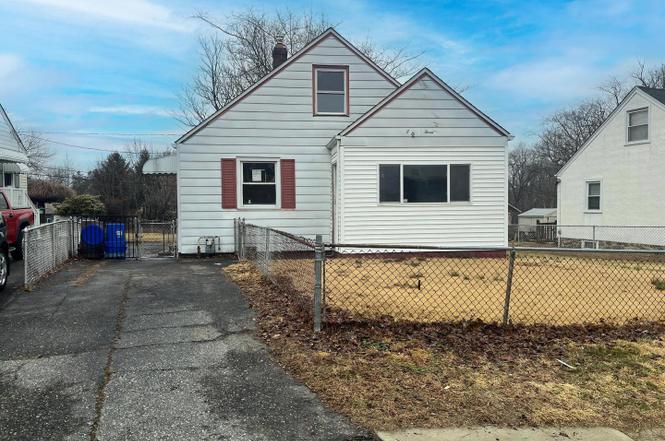
Welcome to 53 Seward Lane, a cozy and inviting single-family home located in Aston. Built in 1943, this home offers classic charm with comfortable living spaces and excellent potential for personalization. This home features 3 bedrooms and 1 full bathroom across approximately 1,050 square feet of living space, making it an ideal option for first-time buyers, downsizers, or investors. Inside, you'll find a bright living area with a mix of hardwood and carpet flooring, along with a functional kitchen and dining space designed for everyday living. Situated on a nearly 5,000 sq ft lot, the property offers outdoor space ideal for gardening, entertaining, or relaxing. The stucco exterior adds dur
Key facts
- Functional kitchen
- Single family home
- Classic charm
Tags
Neighborhood map
What this means for you Summary
Snapshot
- This is a 2-bed/1.0-bath single-family listed at $200k.
Deal economics
- At list price, monthly cash flow is $467 ($6k/yr) — positive.
- The deal already cash-flows at list — no discount required.
- Meets the 1% rule at list price ($2k rent vs $200k).
- Cap rate 9.1% vs local median 4.7% in Village Green-Green Ridge — top-decile yield for the area; either an underpriced asset or a hidden risk that comps aren't pricing in. Stress-test before assuming the spread holds.
Location & tenants
- Location reads: area grade B — affects rentability + tenant quality, not the cash-flow math above.
- Penn-Delco SD (suburban): math 37% / reading 59% proficiency, ranked #174 of 539 in PA (top 32%) — families likely to look elsewhere, expect single-tenant / working-renter base with shorter leases; only 16% free/reduced lunch — higher-income household profile.
- Market conditions: 71 active listings in the ZIP; 9 comparable units currently listed for rent nearby; rentals leasing fast (median 5d on market — plan ~1-2 weeks tenant-placement turnaround); solid renter incomes; 299 units permitted in Delaware County in 2024 (5 in 5+ unit buildings).
Forward outlook
- Local home prices are declining (-3.0%/yr); year-one equity from $1k of loan paydown is wiped out by about $6k of value loss. Plan a longer hold.
Negotiation context
- Only 14 days on market — expect competitive offers; lowballing is unlikely to land.
Risks & watch-outs
- Watch-outs: built in 1943 — expect roof / HVAC / electrical / plumbing capex.
- Climate carrying-cost: major wind risk, 27% chance of damaging wind over 30y; extreme-heat days projected 7→15/yr by 2055 (HVAC capex compounding) — expect insurance premiums to compound above CPI over the hold.
Questions for the listing agent
- Built in 1943 — when were the roof, HVAC, electrical panel, plumbing, and water heater last replaced?
- Is there a deadline driving the sale (1031 exchange, divorce, estate, relocation)? That informs how much negotiation room exists.
- What's the average days-on-market for RENTAL listings here right now (not sales)? A rising rental-DOM trend means longer vacancies and softer asking-rent achievability than the comps imply.
- What's the recent tenant-quality profile in this submarket — average credit score on applications, eviction rate, late-payment / NSF rate, and stable-employment percentage? A property-management company in the area should have these aggregated.
- How much new for-sale + rental construction is in the pipeline within 1–3 miles? Heavy new supply typically softens prices + rents 12–24 months out; constrained supply supports both.
Investment metrics
- 1% rule
- 1.07% ✓
- Cap rate
- 9.10%
- Cash-on-cash
- 10.01%
- DSCR
- 1.45
- GRM
- 7.8
CMA / ARV
- ARV (on-the-fly)
- $306,600
- Comps found
- 12
Show comp detail 12 sales within ~0.75 mi
| Address | Dist | Beds/Ba | Sqft | Sold | Price | $/sf | Match |
|---|---|---|---|---|---|---|---|
| 53 Seward Ln | 0.00mi | 3/1.0 (+1) | 1,050 (0%) | 2mo | $180,000 | $171 | 93 |
| 1825 Dutton Mill Rd | 0.30mi | 2/1.0 | 1,050 (0%) | 2mo | $240,000 | $229 | 85 |
| 14 Rosalie Ln | 0.13mi | 2/1.0 | 1,025 (-2%) | 7mo | $325,000 | $317 | 84 |
| 30 Neeld Ln | 0.13mi | 3/1.0 (+1) | 1,050 (0%) | 9mo | $330,000 | $314 | 82 |
| 25 Norman St | 0.33mi | 3/1.0 (+1) | 1,044 (-1%) | 2mo | $250,000 | $239 | 77 |
| 45 Seward Ln | 0.05mi | 3/1.0 (+1) | 1,128 (+7%) | 9mo | $350,000 | $310 | 73 |
| 2205 Dutton Mill Rd | 0.24mi | 3/1.5 (+1) | 1,025 (-2%) | 11mo | $285,000 | $278 | 68 |
| 11 Pancoast Ave | 0.43mi | 3/1.0 (+1) | 1,044 (-1%) | 9mo | $305,000 | $292 | 67 |
| 26 Green Ln | 0.20mi | 3/1.0 (+1) | 1,182 (+13%) | 4mo | $290,000 | $245 | 61 |
| 112 Raymond Ave | 0.32mi | 3/1.5 (+1) | 975 (-7%) | 11mo | $365,000 | $374 | 57 |
| 255 Seventh Ave | 0.72mi | 2/1.0 | 912 (-13%) | 10mo | $83,000 | $91 | 36 |
| 2218 Lee Ln | 0.74mi | 3/2.0 (+1) | 964 (-8%) | 11mo | $385,000 | $399 | 34 |
Match score weights: distance 35% · size 25% · config 20% · recency 20%. Top-matched comps best support the ARV.
Projected returns pro-forma
-3.0% appreciation · 3.0% rent growth · sell at horizon
- IRR
- -1.3%
- Equity multiple
- 0.95×
- Total profit
- $-2,717
- Equity at exit
- $29,806
- IRR
- 8.4%
- Equity multiple
- 1.64×
- Total profit
- $35,662
- Equity at exit
- $17,284
Cash invested: $55,972 (down + closing). Projections, not guarantees.
Landlord ↔ Tenant lean methodology
- Overall (STATE)
- 62 Landlord-Friendly
- State Pennsylvania
- 62 Landlord-Friendly · EVEN
- County
- — inherits STATE
- City
- — inherits STATE
ZIP-level market 19014
- Active inventory
- 71
- Price-to-rent
- 7.8×
Monthly cashflow live
- Estimated rent
- $2,137 high interval (Pro) →
- Mortgage (P&I)
- −$1,048
- Tax from tax record
- −$90 /mo · $1,078/yr
- Insurance
- −$83
- HOA
- −$0
- Vacancy / Maint / Mgmt
- −$449
- Net cashflow
- $467
Break-even live
UW: 25.0% down · 7.5% · 30yr · 1.5% tax · 5.0% vac · 8.0% maint · 8.0% mgmt
Financing live
Cash to close
- Down payment
- $49,975
- Closing costs
- $5,997
- Reserves months
- —
- Total cash needed
- —
Loan-product check · same deal, 3 products live
Conventional
25% down · 7.5% · 30yr
- Down + closing
- —
- Monthly P&I
- —
- Monthly cashflow
- —
- DSCR
- —
- Eligible?
- —
Personal DTI + credit; lowest rate.
DSCR
20% down · 8.5% · 30yr
- Down + closing
- —
- Monthly P&I
- —
- Monthly cashflow
- —
- DSCR
- —
- Eligible?
- —
No personal income docs; deal must DSCR.
Hard money
10% down · 12.0% · 12mo
- Down + closing
- —
- Monthly P&I
- —
- Monthly cashflow
- —
- DSCR
- —
- Eligible?
- —
Short-term bridge; refi at stabilization.
Rent comps 9 comps
| Address | Beds | Baths | Sqft | Rent | $/sqft | DOM | Units | Dist |
|---|---|---|---|---|---|---|---|---|
| 45 Neeld Ln Aston, PA | 3.0 | 2.0 | 1303 | $2,900 | $2.23 | 2d | 1 | 0.21mi |
| 3150 Concord Rd Unit B Aston Township, PA | 2.0 | 1.0 | 850 | $1,550 | $1.82 | 10d | 1 | 0.30mi |
| 29 Thomas Rd Aston Township, PA | 2.0 | 1.0 | 1100 | $1,985 | $1.80 | 43d | 1 | 0.69mi |
| 3701 Concord Rd Aston, PA | 2.0 | 1.0 | 850 | $1,497 | $1.76 | 5d | 1 | 0.73mi |
| 713 Lamp Post Ln Unit A Aston Township, PA | 3.0 | 1.0 | 1000 | $2,500 | $2.50 | 43d | 1 | 0.90mi |
| 532 Brookhaven Rd Brookhaven, PA | 1.0–2.0 | 1.0 | 720 | $1,690 | $2.35 | 1d | 10 | 1.20mi |
| 280 Bridgewater Rd Brookhaven, PA | 1.0–2.0 | 1.0–2.0 | 775 | $1,695 | $2.19 | 5d | 4 | 1.28mi |
| 280 Bridgewater Rd Brookhaven, PA | 1.0–2.0 | 1.0–1.5 | 775 | $1,800 | $2.32 | 24d | 2 | 1.28mi |
| 25 Abel Pl Media, PA | 2.0 | 1.5 | 1331 | $3,200 | $2.40 | 2d | 1 | 1.45mi |
Listing history 2 events
-
2026-03-20status Pending
-
2026-03-05$199,900 Active
ⓘ Source: listings_history table (triggers on properties + properties_extension) + one-shot
backfill from property_details.listing_events for pre-trigger history.
Tax reassessment forecast PA · Partial reset (capped growth)
- Current annual tax
- $1,078 · $90/mo
- Projected year-2 tax
- $2,118 · $177/mo
- Expected delta
- +$1,040/yr (+$87/mo · 96.5%)
ⓘ Screening estimate from a state-policy table — verify with the county assessor before closing.
Climate risk First Street
- Flood 1/10 Low FEMA zone X (unshaded) · 0% chance over 30 yrs
- Wildfire 1/10 Low
- Heat 7/10 Severe 7 d/yr ≥103°F today · 15 d/yr by 30 yrs out
- Wind 6/10 Major 27% chance of damaging wind over 30 yrs
- Air quality 3/10 Moderate 2 unhealthy d/yr today · 4 by 30 yrs out
Nearby sold comps map
Loading sold comps map…
Walkable amenities ~0.75 mi
Loading nearby amenities…
Taxation est. · year 1
- Rental income
- $25,646
- − Mortgage interest
- −$11,198
- − Property taxes
- −$1,078
- − Insurance
- −$1,000
- − Repairs & maintenance
- −$2,052
- − Management
- −$2,052
- − Depreciation
- −$5,815
- Taxable income
- $2,453
- Est. tax owed @ 24.0%
- −$589
- After-tax cash flow
- $5,015/yr
For passive investors: Depreciation is non-cash, so a rental often shows a tax loss while cash-flowing — sheltering income. Rental losses are passive: they offset passive income freely, and up to $25,000/yr can offset ordinary (W-2) income if you actively participate and your MAGI is under $100k (phasing out to $0 by $150k); unused losses carry forward. On sale, claimed depreciation is recaptured at up to 25%, and gains may owe capital-gains tax (a 1031 exchange can defer both). Figures are a year-1 estimate at your 24.0% rate — not tax advice; consult a CPA.
Schools (NCES district)
- District
- Penn-Delco SD
- NCES district ID
- 4218580
- Math proficiency
- 37% ▼ -18.00%
- Reading proficiency
- 59% ▼ -13.00%
- Median HH income
- $71,673
- Composite
- 43.11/100
- National rank
- #3083
- State rank
- #174 of 539 in PA
Livability — Village Green-Green Ridge
No livability data for this city. (Only ~50 U.S. cities are tracked.)
Census & demographics
- Census place
- Village Green-Green Ridge, PA
- County
- Delaware County · 399,863 people
- City population
- 21,242
- Metro
- Philadelphia-Camden-Wilmington, PA-NJ-DE-MD
- Population (ZIP)
- 21,427
- Household income
- $96,781
- Rent vs Own
- Severe rent burden
- 276.0
Population outlook (Delaware County) Hauer SSP2
- Today (2025)
- 577,490 people
- By 2030
- 581,243 · +0.6%
- By 2040
- 584,700 · +1.2%
- By 2050
- 586,581 · +1.6%
- By 2075
- 598,706 · +3.7%
- By 2100
- 590,823 · +2.3%
Race, ethnicity, and origin ACS 2023
- Neighborhood character
- Predominantly White (86%)
- Race & ethnicity
- White 86% Black 9% Two or more races 2% Asian 2% Hispanic / Latino 2%
- Common ancestry
- Romanian 9% Italian 2% Iranian 1%
- Foreign-born
- 4% · South Korea, Canada
- Languages at home
- 95% English-only · Russian/Polish/Slavic 1% Other Indo-European 1% Spanish 1%
Political lean MEDSL · Delaware
- 2024 margin
- Strong D (+23.7) · D 61.4% · R 37.6% · Other 1.0%
- 2008→2024 swing
- +2.3pp toward D · 2008: 21.4pp · 2024: 23.7pp
- All cycles
- 2024: D+23.7 2020: D+26.7 2016: D+22.0 2012: D+21.8 2008: D+21.4
Not yet ingested
- Civics
- —
Market trends
- HPI YoY
- ▼ -260.34%
- Current HPI
- 262.8409
- Rent YoY
- —
- Metro
- Philadelphia-Camden-Wilmington, PA-NJ-DE-MD
- State GDP YoY
- ▲ 1.68%
- F500 in state
- 34
Industry mix (Fortune 500 HQ in PA)
| Industry | F500 HQs | Revenue |
|---|---|---|
| Healthcare | 2 | $309B |
|
||
| Insurance | 2 | $27B |
|
||
| Telecommunications / Media | 1 | $124B |
|
||
| Industrial Distribution | 1 | $22B |
|
||
| Financial Services | 1 | $20B |
|
||
| Chemicals / Materials | 1 | $18B |
|
||
Price history
2 events — show timeline
- 2026-03-20 Pending — BRIGHT MLS
- 2026-03-05 Listed $199,900 BRIGHT MLS
Property tax history
-6.0%/yrLatest (2026): $1,078 · -76.1% YoY. Source: county tax records.
Cash-flow waterfall
monthlySold comps — $/sqft
last 12 mo · ≤1 miLoading sold comps…