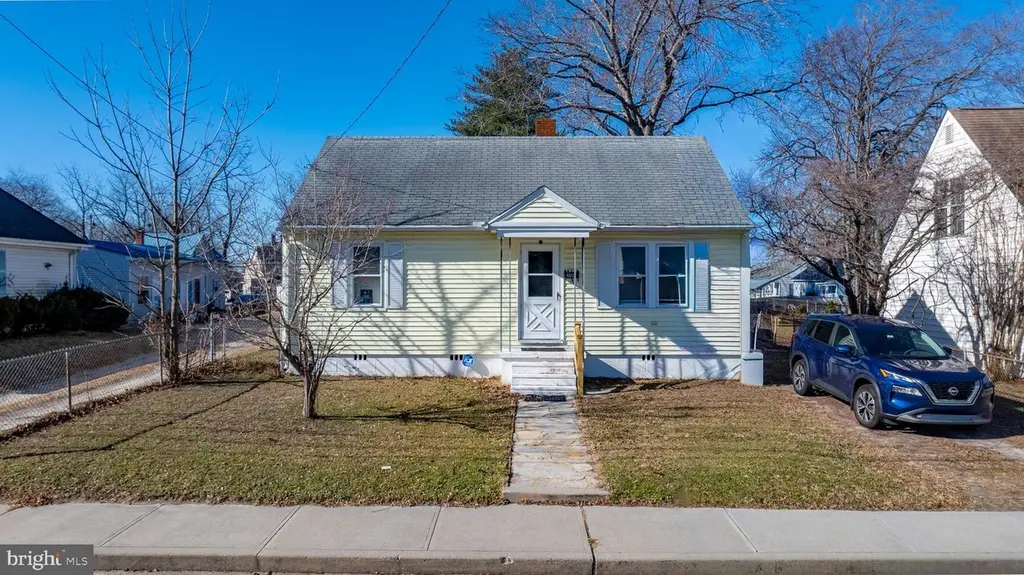
704 Madison St · Salisbury, MD
Flood risk 1/10 · Minimal
- FEMA flood zone
- X (unshaded)
- Chance of flooding over 30 yrs
- 0.0%
- Est. flood insurance / yr
- $507 – $1,088
Fire risk 1/10 · Minimal
- Est. fire insurance / yr
- $755 – $1,403
Heat risk 9/10 · Severe
- Hot days now (above 105°F)
- 7 days/yr
- Hot days in 30 yrs
- 16 days/yr
Wind risk 7/10 · Major
- Chance of severe wind over 30 yrs
- 78.0%
Air-quality risk 2/10 · Minimal
- Unhealthy air days now
- 1 days/yr
- Unhealthy air days in 30 yrs
- 2 days/yr
Risk factors via First Street. Map © Google.
Why this score? — see what drove the C- grade
The composite is a weighted blend of 9 inputs, each scored 0–100. Each bar is that input's sub-score; the figure is the points it added to the 100-point composite (weight × sub-score).
- Cash flow +19.0/30.0
- ARV discount +10.9/15.0
- DSCR +6.0/10.0
- 1% rule +4.2/10.0
- Rent growth +3.4/5.0
- Livability +3.0/5.0
- Condition / age +2.5/5.0
- Schools +1.9/10.0
- Appreciation +0.0/10.0
$165,000
🖨 Deal sheet 📄 Offer letter ✓ Due diligence
Listing remarks MLS
Motivated seller!! Charming 2 bedroom, 1 bath home ideally located just minutes from Salisbury University. This well maintained property offers a functional layout with great potential, perfect for a first time home buyer, or an investment property. An oversized detached garage provides ample space for storage- an added bonus rarely found at this price point.
Key facts
- 5,000 sq ft lot
- Built 1949
- Listed 129 days
Neighborhood map
What this means for you Summary
Snapshot
- This is a 2-bed/1.0-bath single-family listed at $165k.
Deal economics
- At list price, monthly cash flow is $172 ($2k/yr) — positive.
- The deal already cash-flows at list — no discount required.
- To meet the 1% rule (rent ≥ 1% of price), the offer needs to be $151k (8.3% below list).
- Recommended offer: $145k (12.0% below list) — sets the bar for market timing.
- Cap rate 7.5% vs local median 4.8% in Salisbury — top-decile yield for the area; either an underpriced asset or a hidden risk that comps aren't pricing in. Stress-test before assuming the spread holds.
Location & tenants
- Location reads 60/100 on livability (#351 in MD) — a middle-class / working-renter tenant base. Strengths: health & safety A+, cost of living A, housing A; Watch: schools D-, crime F, amenities F.
- Wicomico County Public Schools (urban): math 16% / reading 26% proficiency, ranked #19 of 24 in MD (top 79%) — low school quality limits family demand, transient renter base, plan for 1-2y turnover.
- Market conditions: Rents rising (+3.8%/yr); 195 active listings in the ZIP; 21 comparable units currently listed for rent nearby; rentals lingering (median 44d on market — plan ~5-8 weeks vacancy on turnover, expect pricing pressure); 52% of comp listings sitting > 30 days — soft ceiling on asking rent; 278 units permitted in Wicomico County in 2024 (44 in 5+ unit buildings).
Forward outlook
- Local home prices are declining (-3.0%/yr); year-one equity from $1k of loan paydown is wiped out by about $5k of value loss. Plan a longer hold.
- Wicomico County population projected at +14% by 2050 — modest demand growth; plan on rents tracking national, not racing it.
Negotiation context
- It's been on market 129 days — a 12% lower offer ($145k) is reasonable based on typical stale-listing flexibility.
- 5 sale attempts since 22y ago; this cycle's ask has dropped $10k (6%) from the opening price — seller is motivated, your offer sets the floor, not the list.
- Current owner paid $130k; 27% above their basis — modest negotiation headroom, anchor on the comps not their cost.
Risks & watch-outs
- Watch-outs: built in 1949 — expect roof / HVAC / electrical / plumbing capex.
- Climate carrying-cost: major wind risk, 78% chance of damaging wind over 30y; extreme-heat days projected 7→16/yr by 2055 (HVAC capex compounding) — expect insurance premiums to compound above CPI over the hold.
Questions for the listing agent
- It's been on market 129 days. Have you received any prior offers? Is the seller open to a 12% concession, seller financing, or rate buy-down credit?
- Built in 1949 — when were the roof, HVAC, electrical panel, plumbing, and water heater last replaced?
- Why hasn't it sold? Are there any deal-killer items the seller is aware of (foundation, flood, title, zoning, code violations)?
- Is there a deadline driving the sale (1031 exchange, divorce, estate, relocation)? That informs how much negotiation room exists.
- Schools are D-rated, which usually means shorter tenancies and higher turnover. Who's the typical renter profile here, and what's been the actual vacancy rate?
- Crime grade is F in this area — have there been break-ins, vandalism, or insurance claims at this property in the last 3 years? What carrier currently insures it and at what premium?
- What's the average days-on-market for RENTAL listings here right now (not sales)? A rising rental-DOM trend means longer vacancies and softer asking-rent achievability than the comps imply.
- What's the recent tenant-quality profile in this submarket — average credit score on applications, eviction rate, late-payment / NSF rate, and stable-employment percentage? A property-management company in the area should have these aggregated.
- How much new for-sale + rental construction is in the pipeline within 1–3 miles? Heavy new supply typically softens prices + rents 12–24 months out; constrained supply supports both.
Investment metrics
- 1% rule
- 0.92% ✗
- Cap rate
- 7.55%
- Cash-on-cash
- 4.48%
- DSCR
- 1.20
- GRM
- 9.1
CMA / ARV
- ARV (median comp)
- $178,368
- List price
- $165,000
- Delta
- -7.49%
- Verdict
- FAIR
- Comps
- 20 within 1.0 mi
Show comp detail 12 sales within ~0.75 mi
| Address | Dist | Beds/Ba | Sqft | Sold | Price | $/sf | Match |
|---|---|---|---|---|---|---|---|
| 704 Madison St | 0.00mi | 2/1.0 | 832 (0%) | 0mo | $165,000 | $198 | 100 |
| 109 Prince St | 0.05mi | 2/1.0 | 804 (-3%) | 12mo | $189,900 | $236 | 82 |
| 409 Franklin Ave | 0.25mi | 2/1.0 | 848 (+2%) | 8mo | $140,000 | $165 | 79 |
| 304 E Lincoln Ave | 0.22mi | 3/1.0 (+1) | 856 (+3%) | 9mo | $215,000 | $251 | 73 |
| 405 Newton Ter | 0.50mi | 2/1.0 | 780 (-6%) | 2mo | $154,000 | $197 | 64 |
| 916 Vincent St | 0.44mi | 2/1.5 | 868 (+4%) | 9mo | $212,999 | $245 | 62 |
| 1007 Spring Ave | 0.58mi | 2/1.0 | 879 (+6%) | 2mo | $208,500 | $237 | 62 |
| 310 Pryor Ave | 0.49mi | 3/1.0 (+1) | 768 (-8%) | 2mo | $180,000 | $234 | 58 |
| 835 S Division St | 0.32mi | 2/1.0 | 936 (+12%) | 9mo | $129,000 | $138 | 57 |
| 1006 Tyler Ave | 0.69mi | 3/1.0 (+1) | 840 (+1%) | 12mo | $190,000 | $226 | 51 |
| 530 E Lincoln Ave | 0.52mi | 3/1.5 (+1) | 919 (+10%) | 7mo | $200,000 | $218 | 46 |
| 826 Springfield Cir | 0.38mi | 3/1.0 (+1) | 952 (+14%) | 12mo | $189,000 | $199 | 43 |
Match score weights: distance 35% · size 25% · config 20% · recency 20%. Top-matched comps best support the ARV.
Projected returns pro-forma
-3.0% appreciation · 3.78% rent growth · sell at horizon
- IRR
- -8.6%
- Equity multiple
- 0.68×
- Total profit
- $-14,615
- Equity at exit
- $24,602
- IRR
- 1.8%
- Equity multiple
- 1.13×
- Total profit
- $6,194
- Equity at exit
- $14,266
Cash invested: $46,200 (down + closing). Projections, not guarantees.
Landlord ↔ Tenant lean methodology
- Overall (STATE)
- 27 Tenant-Leaning
- State Maryland
- 27 Tenant-Leaning · D+14
- County
- — inherits STATE
- City
- — inherits STATE
ZIP-level market 21804
- Home prices YoY
- -26.7%
- Rents YoY
- 3.8%
- Active inventory
- 195
- Price-to-rent
- 9.1×
Monthly cashflow live
- Estimated rent
- $1,513 high interval (Pro) →
- Mortgage (P&I)
- −$865
- Tax from tax record
- −$89 /mo · $1,065/yr
- Insurance
- −$69
- HOA
- −$0
- Vacancy / Maint / Mgmt
- −$318
- Net cashflow
- $172
Break-even live
UW: 25.0% down · 7.5% · 30yr · 1.5% tax · 5.0% vac · 8.0% maint · 8.0% mgmt
Financing live
Cash to close
- Down payment
- $41,250
- Closing costs
- $4,950
- Reserves months
- —
- Total cash needed
- —
Loan-product check · same deal, 3 products live
Conventional
25% down · 7.5% · 30yr
- Down + closing
- —
- Monthly P&I
- —
- Monthly cashflow
- —
- DSCR
- —
- Eligible?
- —
Personal DTI + credit; lowest rate.
DSCR
20% down · 8.5% · 30yr
- Down + closing
- —
- Monthly P&I
- —
- Monthly cashflow
- —
- DSCR
- —
- Eligible?
- —
No personal income docs; deal must DSCR.
Hard money
10% down · 12.0% · 12mo
- Down + closing
- —
- Monthly P&I
- —
- Monthly cashflow
- —
- DSCR
- —
- Eligible?
- —
Short-term bridge; refi at stabilization.
Rent comps 21 comps
| Address | Beds | Baths | Sqft | Rent | $/sqft | DOM | Units | Dist |
|---|---|---|---|---|---|---|---|---|
| 504 Juniper St Salisbury, MD | 3.0 | 1.0 | 960 | $1,595 | $1.66 | 21d | 1 | 0.42mi |
| 231 Newton St Unit A Salisbury, MD | 3.0 | 1.0 | 1000 | $1,595 | $1.59 | 44d | 1 | 0.47mi |
| 231 Newton St Unit B Salisbury, MD | 2.0 | 1.0 | 736 | $1,400 | $1.90 | 44d | 1 | 0.47mi |
| 1008 Adams Ave Unit 11D Salisbury, MD | 2.0 | 1.0 | 918 | $1,250 | $1.36 | 21d | 1 | 0.56mi |
| 1027 Adams Ave Ste A Salisbury, MD | 2.0 | 1.0–2.0 | 576 | $1,425 | $2.47 | 13d | 13 | 0.60mi |
| 1022 Adams Ave Unit 1D Salisbury, MD | 2.0 | 1.0 | 918 | $1,400 | $1.53 | 44d | 1 | 0.63mi |
| 1014 Cecil St Salisbury, MD | 3.0 | 1.0 | 1023 | $1,500 | $1.47 | 44d | 1 | 0.64mi |
| 218 W Main St Unit 401 Salisbury, MD | 2.0 | 1.0 | 1060 | $1,695 | $1.60 | 44d | 1 | 0.67mi |
| 529 E William St Salisbury, MD | 3.0 | 1.0 | 1057 | $1,495 | $1.41 | 21d | 1 | 0.70mi |
| 1017 Tyler Ave Salisbury, MD | 2.0 | 1.0 | 1024 | $1,650 | $1.61 | 21d | 1 | 0.75mi |
| 304 Glen Ave Salisbury, MD | 1.0–2.0 | 1.0 | 675 | $1,300 | $1.93 | 44d | 4 | 0.78mi |
| 308 N Division St #12 Salisbury, MD | 2.0 | 1.0 | 990 | $1,295 | $1.31 | 44d | 1 | 0.82mi |
| 518 Alabama Ave Salisbury, MD | 1.0–3.0 | 1.0–2.5 | 1028 | $1,592 | $1.55 | 13d | 14 | 0.87mi |
| 146 Onley Rd Salisbury, MD | 3.0 | 1.0 | 960 | $1,550 | $1.61 | 44d | 1 | 1.02mi |
| 826 S Schumaker Dr Salisbury, MD | 1.0–3.0 | 1.0–2.5 | 1022 | $1,538 | $1.50 | 13d | 5 | 1.04mi |
| 915 N Division St Unit A Salisbury, MD | 3.0 | 1.0 | 900 | $1,395 | $1.55 | 44d | 1 | 1.18mi |
| 205 W London Ave Salisbury, MD | 2.0 | 1.0 | 840 | $1,500 | $1.79 | 21d | 1 | 1.32mi |
| 1000 Marley Manor Dr Salisbury, MD | 2.0–3.0 | 2.0 | 1225 | $1,699 | $1.39 | 13d | 20 | 1.37mi |
| 411 Dover St Salisbury, MD | 3.0 | 2.0 | 984 | $1,600 | $1.63 | 44d | 1 | 1.38mi |
| 821 Johnson St Salisbury, MD | 2.0 | 1.0 | 939 | $1,495 | $1.59 | 13d | 1 | 1.48mi |
| 906 Johnson St Salisbury, MD | 3.0 | 1.5 | 875 | $1,495 | $1.71 | 44d | 1 | 1.48mi |
Listing history 17 events
-
2026-02-13price $165,000 361-char remark
Show marketing remark (361 chars)
Motivated seller!! Charming 2 bedroom, 1 bath home ideally located just minutes from Salisbury University. This well maintained property offers a functional layout with great potential, perfect for a first time home buyer, or an investment property. An oversized detached garage provides ample space for storage- an added bonus rarely found at this price point.
-
2026-01-29price $170,000 361-char remark
Show marketing remark (361 chars)
Motivated seller!! Charming 2 bedroom, 1 bath home ideally located just minutes from Salisbury University. This well maintained property offers a functional layout with great potential, perfect for a first time home buyer, or an investment property. An oversized detached garage provides ample space for storage- an added bonus rarely found at this price point.
-
2026-01-13$175,000 Active 361-char remark
Show marketing remark (361 chars)
Motivated seller!! Charming 2 bedroom, 1 bath home ideally located just minutes from Salisbury University. This well maintained property offers a functional layout with great potential, perfect for a first time home buyer, or an investment property. An oversized detached garage provides ample space for storage- an added bonus rarely found at this price point.
-
2026-01-08historical
-
2025-12-11price $175,000
-
2025-12-10$170,000 Active
-
2021-06-01soldstatus $130,000
-
2021-05-21soldstatus $130,000 Closed
-
2021-04-14status Pending
-
2021-03-27$134,900 Active
-
2008-01-25historical
-
2007-07-27$132,000
-
2004-11-05soldstatus $68,900
-
2004-10-29soldstatus $68,900
-
2004-09-13$68,900
-
1995-09-08soldstatus $46,500
-
1989-01-13soldstatus $38,000
ⓘ Source: listings_history table (triggers on properties + properties_extension) + one-shot
backfill from property_details.listing_events for pre-trigger history.
Tax reassessment forecast MD · Partial reset (capped growth)
- Current annual tax
- $1,065 · $89/mo
- Projected year-2 tax
- $1,432 · $119/mo
- Expected delta
- +$367/yr (+$31/mo · 34.4%)
ⓘ Screening estimate from a state-policy table — verify with the county assessor before closing.
Climate risk First Street
- Flood 1/10 Low FEMA zone X (unshaded) · 0% chance over 30 yrs
- Wildfire 1/10 Low
- Heat 9/10 Extreme 7 d/yr ≥105°F today · 16 d/yr by 30 yrs out
- Wind 7/10 Severe 78% chance of damaging wind over 30 yrs
- Air quality 2/10 Low 1 unhealthy d/yr today · 2 by 30 yrs out
Nearby sold comps map
Loading sold comps map…
Walkable amenities ~0.75 mi
Loading nearby amenities…
Taxation est. · year 1
- Rental income
- $18,154
- − Mortgage interest
- −$9,243
- − Property taxes
- −$1,065
- − Insurance
- −$825
- − Repairs & maintenance
- −$1,452
- − Management
- −$1,452
- − Depreciation
- −$4,800
- Taxable loss
- −$684
- Est. tax savings @ 24.0%
- +$164
- After-tax cash flow
- $2,232/yr
For passive investors: Depreciation is non-cash, so a rental often shows a tax loss while cash-flowing — sheltering income. Rental losses are passive: they offset passive income freely, and up to $25,000/yr can offset ordinary (W-2) income if you actively participate and your MAGI is under $100k (phasing out to $0 by $150k); unused losses carry forward. On sale, claimed depreciation is recaptured at up to 25%, and gains may owe capital-gains tax (a 1031 exchange can defer both). Figures are a year-1 estimate at your 24.0% rate — not tax advice; consult a CPA.
Schools (NCES district)
- District
- Wicomico County Public Schools
- NCES district ID
- 2400690
- Math proficiency
- 16% ▼ -18.00%
- Reading proficiency
- 26% ▼ -13.00%
- Median HH income
- $51,745
- Composite
- 18.87/100
- National rank
- #8860
- State rank
- #19 of 24 in MD
Livability — Salisbury
- Score
- 60/100
- State rank
- #351
- US rank
- #18948
Category grades
Schools grade is shown separately in the Schools card above.
Census & demographics
- Census place
- Salisbury, MD
- County
- Wicomico County · 75,969 people
- City population
- 70,518
- Metro
- Salisbury, MD-DE
- Population (ZIP)
- 40,430
- Household income
- $73,156
- Rent vs Own
- Severe rent burden
- 2096.0
Population outlook (Wicomico County) Hauer SSP2
- Today (2025)
- 108,548 people
- By 2030
- 111,783 · +3.0%
- By 2040
- 118,139 · +8.8%
- By 2050
- 123,641 · +13.9%
- By 2075
- 139,784 · +28.8%
- By 2100
- 145,334 · +33.9%
Race, ethnicity, and origin ACS 2023
- Neighborhood character
- Diverse neighborhood (Simpson 0.61)
- Race & ethnicity
- White 54% Black 30% Two or more races 9% Hispanic / Latino 7% Asian 3%
- Hispanic origin (detail)
- Mexican 4% Dominican 1%
- Common ancestry
- Hispanic 8% Romanian 3% Slovak 1%
- Foreign-born
- 13% · Canada, Vietnam, South Korea
- Languages at home
- 83% English-only · French/Haitian/Cajun 7% Spanish 5% Other Indo-European 2%
Political lean MEDSL · Wicomico
- 2024 margin
- Lean R (+5.5) · D 46.1% · R 51.5% · Other 2.4%
- 2008→2024 swing
- +0.3pp no change · 2008: -5.8pp · 2024: -5.5pp
- All cycles
- 2024: R+5.5 2020: R+1.9 2016: R+11.6 2012: R+6.9 2008: R+5.8
Not yet ingested
- Civics
- —
Market trends
- HPI YoY
- ▼ -84.15%
- Current HPI
- 230.6099
- Rent YoY
- ▲ 3.78%
- Metro
- Salisbury, MD-DE
- State GDP YoY
- ▲ 2.97%
- F500 in state
- 12
Industry mix (Fortune 500 HQ in MD)
| Industry | F500 HQs | Revenue |
|---|---|---|
| Aerospace / Defense | 1 | $71B |
|
||
| Utilities | 1 | $25B |
|
||
| Hotels | 1 | $24B |
|
||
| Consumer Goods | 1 | $7B |
|
||
| Real Estate | 1 | $6B |
|
||
| Chemicals | 1 | $2B |
|
||
Price history
+334.2% since first listed17 events — show timeline
- 2026-02-13 Price Changed $165,000 BRIGHT MLS
- 2026-01-29 Price Changed $170,000 BRIGHT MLS
- 2026-01-13 Listed $175,000 BRIGHT MLS
- 2026-01-08 Listing Removed — BRIGHT MLS
- 2025-12-11 Price Changed $175,000 BRIGHT MLS
- 2025-12-10 Listed $170,000 BRIGHT MLS
- 2021-06-01 Sold (Public Records) $130,000 Public Records
- 2021-05-21 Sold (MLS) $130,000 BRIGHT MLS
- 2021-04-14 Pending — BRIGHT MLS
- 2021-03-27 Listed $134,900 BRIGHT MLS
- 2008-01-25 Listing Removed — BRIGHT MLS
- 2007-07-27 Listed $132,000 BRIGHT MLS
- 2004-11-05 Sold (Public Records) $68,900 Public Records
- 2004-10-29 Sold (MLS) $68,900 BRIGHT MLS
- 2004-09-13 Listed $68,900 BRIGHT MLS
- 1995-09-08 Sold (Public Records) $46,500 Public Records
- 1989-01-13 Sold (Public Records) $38,000 Public Records
Property tax history
+1.0%/yrLatest (2025): $1,065 · +9.5% YoY. Source: county tax records.
Cash-flow waterfall
monthlySold comps — $/sqft
last 12 mo · ≤1 miLoading sold comps…