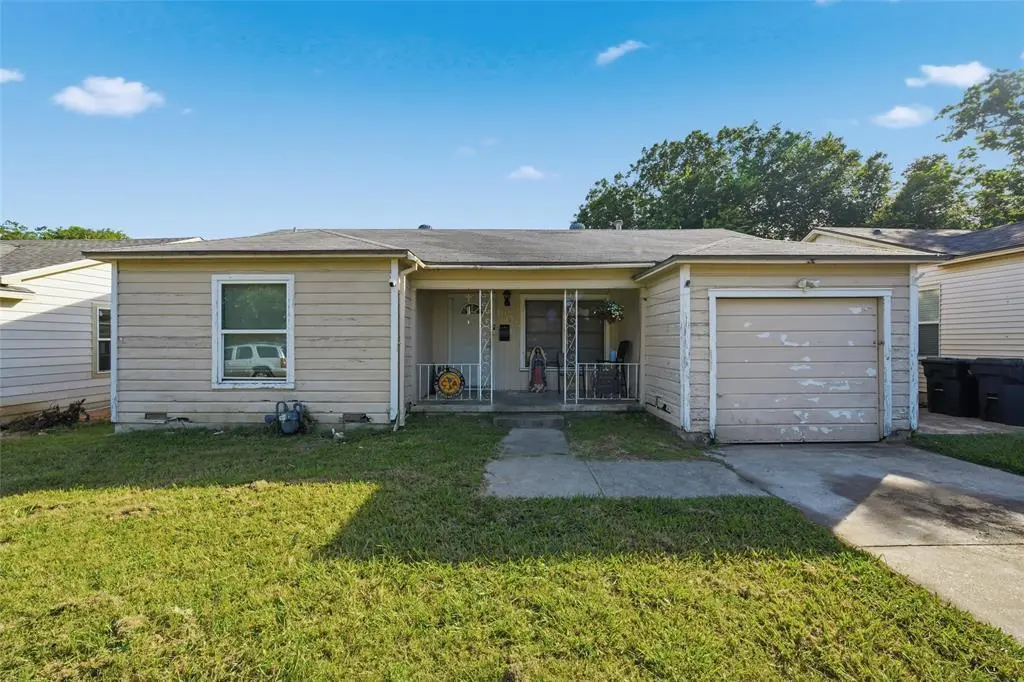
1905 Bell St · Waco, TX
Flood risk 3/10 · Minor
- FEMA flood zone
- X (unshaded)
- Chance of flooding over 30 yrs
- 0.1%
- Est. flood insurance / yr
- $507 – $1,088
Fire risk 1/10 · Minimal
- Est. fire insurance / yr
- $1,222 – $2,270
Heat risk 7/10 · Major
- Hot days now (above 109°F)
- 7 days/yr
- Hot days in 30 yrs
- 23 days/yr
Wind risk 6/10 · Moderate
- Chance of severe wind over 30 yrs
- 60.0%
Air-quality risk 1/10 · Minimal
- Unhealthy air days now
- 0 days/yr
- Unhealthy air days in 30 yrs
- 0 days/yr
Risk factors via First Street. Map © Google.
Why this score? — see what drove the B+ grade
The composite is a weighted blend of 9 inputs, each scored 0–100. Each bar is that input's sub-score; the figure is the points it added to the 100-point composite (weight × sub-score).
- Cash flow +26.4/30.0
- ARV discount +15.0/15.0
- DSCR +9.0/10.0
- 1% rule +7.8/10.0
- Appreciation +6.8/10.0
- Livability +3.7/5.0
- Rent growth +3.2/5.0
- Condition / age +2.5/5.0
- Schools +1.8/10.0
$127,000
🖨 Deal sheet 📄 Offer letter ✓ Due diligence
Listing remarks MLS
1905 Bell Street is ready for it's new owner! Located in the Heart of South Waco within minutes away from shopping, dining, and entertainment. Recent updates include minor foundation work, new windows, and HVAC unit which was replaced at the beginning of 2023. This home is a perfect opportunity for someone who is looking to grow their Real Estate portfolio or just looking to buy their first home. With a little love and your personal touch you can easily turn this into the perfect home. This home is priced below MCAD appraised value and will go fast. Schedule a private showing sooner than later!
Key facts
- 8,072 sq ft lot
- Built 1953
- Listed 22 days
Property features AI
Finance
- Financial info: Listing accepted for cash and conventional financing; No second mortgage indicated
- HOA & community: No homeowners association
Exterior
- Parking: Driveway (no garage, no covered or carport spaces)
- Utilities: City water; City sewer (sewer available); Electricity connected; Not in a municipal utility district
- Home design: Single family residence; One story; Built in 1953; Not attached to other properties
- Construction: Composition roof; Pillar/post/pier foundation
- Exterior features: Covered porch(es); Chain-link fence; Subdivision setting
Interior
- Kitchen: Gas water heater; Vented exhaust fan
- Bedrooms: 4 bedrooms (primary bedroom on main level)
- Flooring: Wood flooring
- Bathrooms: 1 full bathroom; 1 half bathroom (2 total bathrooms)
- Heating & cooling: Central heating (natural gas); Central air conditioning (gas)
- Interior features: Cable TV available; One living area; One dining area; One level (single-story)
- Laundry & utility: No specific laundry appliances listed
Neighborhood map
What this means for you Summary
Snapshot
- This is a 3-bed/1.5-bath single-family listed at $127k.
Deal economics
- At list price, monthly cash flow is $330 ($4k/yr) — positive.
- The deal already cash-flows at list — no discount required.
- Meets the 1% rule at list price ($2k rent vs $127k).
- Recommended offer: $125k (1.5% below list) — sets the bar for market timing.
- Cap rate 9.4% vs local median 3.9% in Waco — top-decile yield for the area; either an underpriced asset or a hidden risk that comps aren't pricing in. Stress-test before assuming the spread holds.
Location & tenants
- Location reads 74/100 on livability (#166 in TX, #4,378 nationally) — a middle-class / working-renter tenant base. Strengths: cost of living A+, housing A+, health & safety A+; Watch: crime D, commute F, employment D-.
- Waco ISD (urban): math 20% / reading 24% proficiency, ranked #773 of 826 in TX (top 94%) — low school quality limits family demand, transient renter base, plan for 1-2y turnover; 81% free/reduced lunch — lower-income household profile, screen leases tightly.
- Zoned schools: Kendrick El (math 15% / reading 19%, grade F, #3,836 of 4,322 statewide, top 91%, 482 students, 96% FRL).
- Market conditions: Rents rising (+2.6%/yr); 43 active listings in the ZIP; 29 comparable units currently listed for rent nearby; rentals at typical pace (median 21d on market — plan ~3-4 weeks tenant-placement turnaround); 1,014 units permitted in McLennan County in 2024 (200 in 5+ unit buildings).
Forward outlook
- In year one you build about $5k of equity ($878 loan paydown + $5k appreciation (3.6% local appreciation)).
- McLennan County population projected at +17% by 2050 — long-run rental-demand tailwind backs the buy-and-hold thesis.
- At projected returns (3.6% appreciation + 2.6% rent growth), your $36k cash investment doubles in ~4 years — after that, you're playing with house money.
- By year 7, paydown + projected appreciation supports a ~$34k cash-out refi (75% LTV) — recoverable capital for the next deal without selling this one.
Negotiation context
- It's been on market 22 days — a 2% lower offer ($125k) is reasonable based on typical stale-listing flexibility.
- 2 sale attempts since 3y ago; this cycle's ask has dropped $13k (9%) from the opening price — seller is motivated, your offer sets the floor, not the list.
Risks & watch-outs
- Watch-outs: built in 1953 — expect roof / HVAC / electrical / plumbing capex.
- Climate carrying-cost: major wind risk, 60% chance of damaging wind over 30y; extreme-heat days projected 7→23/yr by 2055 (HVAC capex compounding) — expect insurance premiums to compound above CPI over the hold.
Questions for the listing agent
- Built in 1953 — when were the roof, HVAC, electrical panel, plumbing, and water heater last replaced?
- Is there a deadline driving the sale (1031 exchange, divorce, estate, relocation)? That informs how much negotiation room exists.
- Schools are D-rated, which usually means shorter tenancies and higher turnover. Who's the typical renter profile here, and what's been the actual vacancy rate?
- Crime grade is D in this area — have there been break-ins, vandalism, or insurance claims at this property in the last 3 years? What carrier currently insures it and at what premium?
- What's the average days-on-market for RENTAL listings here right now (not sales)? A rising rental-DOM trend means longer vacancies and softer asking-rent achievability than the comps imply.
- What's the recent tenant-quality profile in this submarket — average credit score on applications, eviction rate, late-payment / NSF rate, and stable-employment percentage? A property-management company in the area should have these aggregated.
- How much new for-sale + rental construction is in the pipeline within 1–3 miles? Heavy new supply typically softens prices + rents 12–24 months out; constrained supply supports both.
Investment metrics
- 1% rule
- 1.28% ✓
- Cap rate
- 9.41%
- Cash-on-cash
- 11.14%
- DSCR
- 1.50
- GRM
- 6.5
CMA / ARV
- ARV (on-the-fly)
- $220,967
- Comps found
- 12
Show comp detail 12 sales within ~0.75 mi
| Address | Dist | Beds/Ba | Sqft | Sold | Price | $/sf | Match |
|---|---|---|---|---|---|---|---|
| 3400 Daughtrey Ave | 0.08mi | 3/2.0 | 1,448 (-2%) | 9mo | $254,900 | $176 | 83 |
| 1709 Nelva St | 0.19mi | 3/2.0 | 1,513 (+2%) | 6mo | $225,000 | $149 | 81 |
| 3401 James Ave | 0.19mi | 3/2.5 | 1,536 (+4%) | 8mo | $249,000 | $162 | 74 |
| 3501 Bagby Ave | 0.18mi | 3/2.0 | 1,351 (-9%) | 1mo | $204,000 | $151 | 74 |
| 3205 Belmont Dr | 0.19mi | 3/1.0 | 1,344 (-9%) | 13mo | $219,900 | $164 | 62 |
| 2308 Richter Ave | 0.41mi | 3/2.0 | 1,306 (-12%) | 2mo | $184,900 | $142 | 57 |
| 3820 James Ave | 0.45mi | 3/1.0 | 1,339 (-10%) | 4mo | $200,000 | $149 | 57 |
| 2213 Autumn Woods Dr | 0.56mi | 3/2.0 | 1,308 (-12%) | 1mo | $249,900 | $191 | 52 |
| 3904 Speight Ave | 0.54mi | 3/1.0 | 1,408 (-5%) | 16mo | $69,000 | $49 | 51 |
| 2711 Old Robinson Rd | 0.73mi | 3/2.0 | 1,356 (-9%) | 2mo | $179,000 | $132 | 48 |
| 2729 Gurley Ave | 0.69mi | 2/1.0 (-1) | 1,284 (-13%) | 18mo | $165,000 | $129 | 23 |
| 2729 Connor Ave | 0.64mi | 4/2.0 (+1) | 1,263 (-15%) | 18mo | $178,000 | $141 | 23 |
Match score weights: distance 35% · size 25% · config 20% · recency 20%. Top-matched comps best support the ARV.
Projected returns pro-forma
3.57% appreciation · 2.62% rent growth · sell at horizon
- IRR
- 19.0%
- Equity multiple
- 2.11×
- Total profit
- $39,625
- Equity at exit
- $61,193
- IRR
- 19.7%
- Equity multiple
- 3.99×
- Total profit
- $106,203
- Equity at exit
- $97,616
Cash invested: $35,560 (down + closing). Projections, not guarantees.
Landlord ↔ Tenant lean methodology
- Overall (STATE)
- 87 Strongly Landlord-Friendly
- State Texas
- 87 Strongly Landlord-Friendly · R+5
- County
- — inherits STATE
- City
- — inherits STATE
ZIP-level market 76711
- Home prices YoY
- 1.4%
- Rents YoY
- 2.6%
- Active inventory
- 43
- Price-to-rent
- 6.5×
Monthly cashflow live
- Estimated rent
- $1,629 high interval (Pro) →
- Mortgage (P&I)
- −$666
- Tax from tax record
- −$238 /mo · $2,855/yr
- Insurance
- −$53
- HOA
- −$0
- Vacancy / Maint / Mgmt
- −$342
- Net cashflow
- $330
Break-even live
UW: 25.0% down · 7.5% · 30yr · 1.5% tax · 5.0% vac · 8.0% maint · 8.0% mgmt
Financing live
Cash to close
- Down payment
- $31,750
- Closing costs
- $3,810
- Reserves months
- —
- Total cash needed
- —
Loan-product check · same deal, 3 products live
Conventional
25% down · 7.5% · 30yr
- Down + closing
- —
- Monthly P&I
- —
- Monthly cashflow
- —
- DSCR
- —
- Eligible?
- —
Personal DTI + credit; lowest rate.
DSCR
20% down · 8.5% · 30yr
- Down + closing
- —
- Monthly P&I
- —
- Monthly cashflow
- —
- DSCR
- —
- Eligible?
- —
No personal income docs; deal must DSCR.
Hard money
10% down · 12.0% · 12mo
- Down + closing
- —
- Monthly P&I
- —
- Monthly cashflow
- —
- DSCR
- —
- Eligible?
- —
Short-term bridge; refi at stabilization.
Rent comps 29 comps
| Address | Beds | Baths | Sqft | Rent | $/sqft | DOM | Units | Dist |
|---|---|---|---|---|---|---|---|---|
| 3200 Belmont Dr Unit 3228 Waco, TX | 2.0 | 2.0 | 995 | $1,500 | $1.51 | 13d | 1 | 0.20mi |
| 3743 Vista Cove Dr Waco, TX | 3.0 | 2.0 | 1509 | $1,850 | $1.23 | 21d | 1 | 0.61mi |
| 4009 James Ave Waco, TX | 3.0 | 1.0 | 1056 | $1,495 | $1.42 | 21d | 1 | 0.64mi |
| 3447 Pewitt Dr Waco, TX | 2.0 | 1.0 | 907 | $1,350 | $1.49 | 13d | 1 | 0.66mi |
| 3430 Pewitt Dr Waco, TX | 2.0 | 1.0 | 916 | $1,150 | $1.26 | 43d | 1 | 0.70mi |
| 3411 Pewitt Dr #3413 Waco, TX | 2.0 | 1.0 | 1000 | $1,350 | $1.35 | 21d | 1 | 0.74mi |
| 700 S Valley Mills Dr Waco, TX | 1.0–2.0 | 1.0–1.5 | 850 | $995 | $1.17 | 13d | 2 | 0.86mi |
| 3812 Hiland Dr Waco, TX | 3.0 | 1.0 | 1124 | $995 | $0.89 | 13d | 1 | 0.86mi |
| 2601 Flint Ave Waco, TX | 3.0 | 2.0 | 1356 | $1,720 | $1.27 | 43d | 1 | 0.90mi |
| 3300 Wynmore Dr Waco, TX | 3.0 | 2.0 | 1678 | $1,850 | $1.10 | 21d | 1 | 0.92mi |
| 3300 Wynmore Dr Waco, TX | 3.0 | 2.0 | 1678 | $1,850 | $1.10 | 43d | 1 | 0.92mi |
| 4000 Acree St Waco, TX | 3.0 | 1.5 | 984 | $1,295 | $1.32 | 21d | 1 | 1.02mi |
| 3001 S New Rd Waco, TX | 1.0–3.0 | 1.0–2.0 | 885 | $1,645 | $1.86 | 13d | 15 | 1.07mi |
| 2021 Gurley Ave Waco, TX | 3.0 | 2.0 | 1320 | $1,500 | $1.14 | 21d | 1 | 1.13mi |
| 1800 Primrose Dr Waco, TX | 1.0–4.0 | 1.0–2.0 | 942 | $1,133 | $1.20 | 13d | 33 | 1.18mi |
| 2201 Creekview Dr Waco, TX | 1.0–3.0 | 1.0–2.0 | 990 | $2,094 | $2.12 | 13d | 20 | 1.20mi |
| 1925 S 17th St Unit 1 Waco, TX | 4.0 | 4.0 | 1856 | $2,100 | $1.13 | 21d | 1 | 1.24mi |
| 1914 Ross Ave Waco, TX | 3.0 | 1.0 | 1316 | $1,495 | $1.14 | 21d | 1 | 1.38mi |
| 4900 Bagby Ave Waco, TX | 3.0 | 1.0–2.0 | 1026 | $1,650 | $1.61 | 21d | 1 | 1.38mi |
| 2900 Austin Ave Waco, TX | 2.0 | 2.0 | 1176 | $1,195 | $1.02 | 43d | 1 | 1.39mi |
| 1628 Ewing Ave Waco, TX | 3.0 | 2.0 | 1472 | $2,400 | $1.63 | 13d | 1 | 1.43mi |
| 1912 S 15th St Unit A Waco, TX | 4.0 | 2.0 | 1400 | $1,850 | $1.32 | 21d | 1 | 1.45mi |
| 1916 S 15th St Unit A Waco, TX | 4.0 | 4.0 | 1744 | $1,800 | $1.03 | 21d | 1 | 1.45mi |
| 1916 S 15th St Waco, TX | 4.0 | 4.0 | 1744 | $1,800 | $1.03 | 13d | 1 | 1.45mi |
| 1905 S 14th St Unit B Waco, TX | 4.0 | 4.0 | 1200 | $550 | $0.46 | 21d | 1 | 1.47mi |
| 1905 S 14th St Waco, TX | 4.0 | 4.0 | 1500 | $3,000 | $2.00 | 21d | 1 | 1.47mi |
| 1909 S 14th St Unit B Waco, TX | 4.0 | 4.0 | 1680 | $1,650 | $0.98 | 43d | 1 | 1.47mi |
| 1909 S 14th St Waco, TX | 4.0 | 4.0 | 1680 | $1,600 | $0.95 | 21d | 1 | 1.47mi |
| 5210 Bagby Ave Waco, TX | 1.0–3.0 | 1.0–2.0 | 1014 | $1,695 | $1.67 | 13d | 12 | 1.48mi |
Listing history 22 events
-
2026-06-19price $127,000 Active 22 DOM
-
2026-06-18days on market $140,000 Active 22 DOM
-
2026-06-17days on market $140,000 Active 21 DOM
-
2026-06-16days on market $140,000 Active 20 DOM
-
2026-06-15days on market $140,000 Active 19 DOM
-
2026-06-14days on market $140,000 Active 17 DOM
-
2026-06-13days on market $140,000 Active 16 DOM
-
2026-06-10days on market $140,000 Active 14 DOM
-
2026-06-09days on market $140,000 Active 13 DOM
-
2026-06-08days on market $140,000 Active 12 DOM
-
2026-06-07days on market $140,000 Active 11 DOM
-
2026-06-05days on market $140,000 Active 8 DOM
-
2026-06-03days on market $140,000 Active 7 DOM
-
2026-06-02days on market $140,000 Active 6 DOM
-
2026-06-01days on market $140,000 Active 5 DOM
-
2026-05-31days on market $140,000 Active 4 DOM
-
2026-05-30days on market $140,000 Active 3 DOM
-
2026-05-27$140,000 Active
-
2024-02-07soldstatus 601-char remark
Show marketing remark (601 chars)
1905 Bell Street is ready for it's new owner! Located in the Heart of South Waco within minutes away from shopping, dining, and entertainment. Recent updates include minor foundation work, new windows, and HVAC unit which was replaced at the beginning of 2023. This home is a perfect opportunity for someone who is looking to grow their Real Estate portfolio or just looking to buy their first home. With a little love and your personal touch you can easily turn this into the perfect home. This home is priced below MCAD appraised value and will go fast. Schedule a private showing sooner than later!
-
2023-11-29$135,000 601-char remark
Show marketing remark (601 chars)
1905 Bell Street is ready for it's new owner! Located in the Heart of South Waco within minutes away from shopping, dining, and entertainment. Recent updates include minor foundation work, new windows, and HVAC unit which was replaced at the beginning of 2023. This home is a perfect opportunity for someone who is looking to grow their Real Estate portfolio or just looking to buy their first home. With a little love and your personal touch you can easily turn this into the perfect home. This home is priced below MCAD appraised value and will go fast. Schedule a private showing sooner than later!
-
2017-07-12soldstatus
-
1999-03-08soldstatus
ⓘ Source: listings_history table (triggers on properties + properties_extension) + one-shot
backfill from property_details.listing_events for pre-trigger history.
Tax reassessment forecast TX · Resets to sale price
- Current annual tax
- $2,855 · $238/mo
- Projected year-2 tax
- $2,855 · $238/mo
- Expected delta
- $0/yr ($0/mo · 0.0%)
ⓘ Screening estimate from a state-policy table — verify with the county assessor before closing.
Climate risk First Street
- Flood 3/10 Moderate FEMA zone X (unshaded) · 10% chance over 30 yrs
- Wildfire 1/10 Low
- Heat 7/10 Severe 7 d/yr ≥109°F today · 23 d/yr by 30 yrs out
- Wind 6/10 Major 60% chance of damaging wind over 30 yrs
- Air quality 1/10 Low 0 unhealthy d/yr today · 0 by 30 yrs out
Nearby sold comps map
Loading sold comps map…
Walkable amenities ~0.75 mi
Loading nearby amenities…
Taxation est. · year 1
- Rental income
- $19,550
- − Mortgage interest
- −$7,114
- − Property taxes
- −$2,855
- − Insurance
- −$635
- − Repairs & maintenance
- −$1,564
- − Management
- −$1,564
- − Depreciation
- −$3,695
- Taxable income
- $2,123
- Est. tax owed @ 24.0%
- −$510
- After-tax cash flow
- $3,453/yr
For passive investors: Depreciation is non-cash, so a rental often shows a tax loss while cash-flowing — sheltering income. Rental losses are passive: they offset passive income freely, and up to $25,000/yr can offset ordinary (W-2) income if you actively participate and your MAGI is under $100k (phasing out to $0 by $150k); unused losses carry forward. On sale, claimed depreciation is recaptured at up to 25%, and gains may owe capital-gains tax (a 1031 exchange can defer both). Figures are a year-1 estimate at your 24.0% rate — not tax advice; consult a CPA.
Schools (NCES district)
- District
- Waco ISD
- NCES district ID
- 4844280
- Math proficiency
- 20% ▼ -14.00%
- Reading proficiency
- 24% ▼ -6.00%
- Median HH income
- $29,208
- Composite
- 17.57/100
- National rank
- #9043
- State rank
- #773 of 826 in TX
Livability — Waco
- Score
- 74/100
- State rank
- #166
- US rank
- #4378
Category grades
Schools grade is shown separately in the Schools card above.
Census & demographics
- Census place
- Waco, TX
- County
- McLennan County · 213,088 people
- City population
- 125,319
- Metro
- Waco, TX
- Population (ZIP)
- 9,676
- Household income
- $53,185
- Rent vs Own
- Severe rent burden
- 424.0
Population outlook (McLennan County) Hauer SSP2
- Today (2025)
- 264,191 people
- By 2030
- 273,578 · +3.6%
- By 2040
- 291,506 · +10.3%
- By 2050
- 308,044 · +16.6%
- By 2075
- 349,648 · +32.3%
- By 2100
- 364,779 · +38.1%
Race, ethnicity, and origin ACS 2023
- Neighborhood character
- Diverse neighborhood (Simpson 0.56)
- Race & ethnicity
- Hispanic / Latino 61% Two or more races 43% White 23% Black 12% Native American 3% Asian 2%
- Hispanic origin (detail)
- Mexican 56%
- Common ancestry
- Lithuanian 1% Italian 1% Portuguese 1%
- Foreign-born
- 27% · Canada, China
- Languages at home
- 53% English-only · Spanish 45% Tagalog/Filipino 1% Other Indo-European 1%
Political lean MEDSL · McLennan
- 2024 margin
- Solid R (+30.9) · D 34.0% · R 64.9% · Other 1.0%
- 2008→2024 swing
- -7.0pp toward R · 2008: -23.9pp · 2024: -30.9pp
- All cycles
- 2024: R+30.9 2020: R+23.4 2016: R+27.1 2012: R+29.8 2008: R+23.9
Not yet ingested
- Civics
- —
Market trends
- HPI YoY
- ▲ 3.57%
- Current HPI
- 261.7166
- Rent YoY
- ▲ 2.62%
- Metro
- Waco, TX
- State GDP YoY
- ▲ 3.95%
- F500 in state
- 110
Industry mix (Fortune 500 HQ in TX)
| Industry | F500 HQs | Revenue |
|---|---|---|
| Energy | 16 | $1,198B |
|
||
| Technology | 5 | $198B |
|
||
| Engineering / Construction | 4 | $72B |
|
||
| Energy Services | 3 | $60B |
|
||
| Utilities | 3 | $41B |
|
||
| Healthcare | 2 | $330B |
|
||
Price history
+3.7% since first listed5 events — show timeline
- 2026-05-27 Listed $140,000 NTREIS
- 2024-02-07 Sold (MLS) — NTREIS
- 2023-11-29 Listed $135,000 NTREIS
- 2017-07-12 Sold (Public Records) — Public Records
- 1999-03-08 Sold (Public Records) — Public Records
Property tax history
+3.6%/yrLatest (2025): $2,855 · -46.1% YoY. Source: county tax records.
Cash-flow waterfall
monthlySold comps — $/sqft
last 12 mo · ≤1 miLoading sold comps…