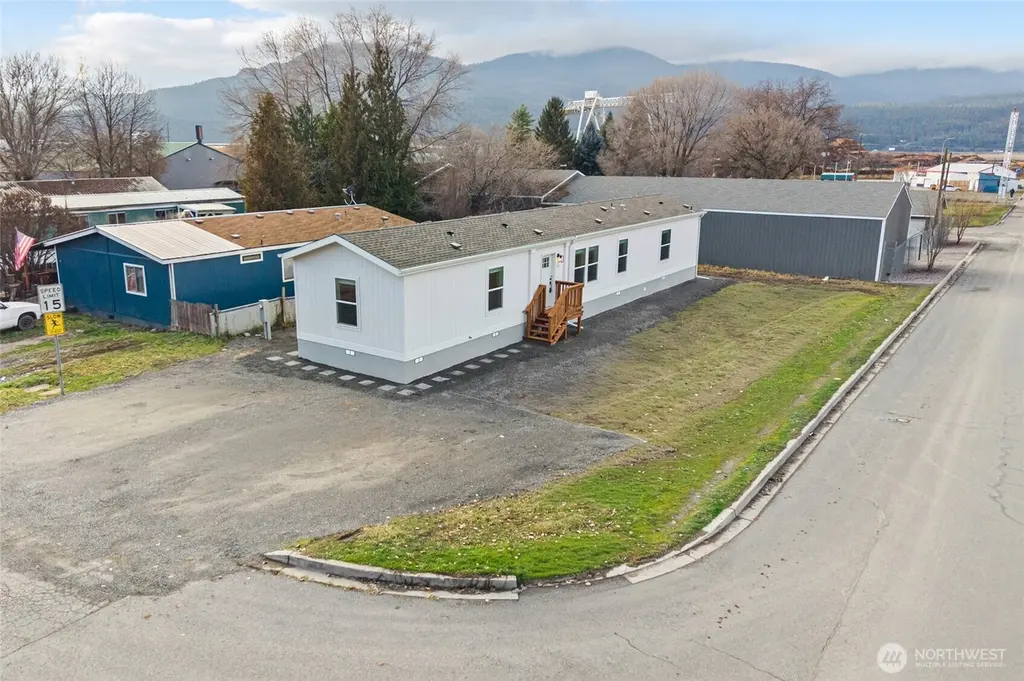
793 N CARTER · Colville, WA
Flood risk 1/10 · Minimal
- FEMA flood zone
- X
- Chance of flooding over 30 yrs
- 0.0%
- Est. flood insurance / yr
- $507 – $1,088
Fire risk 7/10 · Major
- Est. fire insurance / yr
- $604 – $1,122
Heat risk 4/10 · Minor
- Hot days now (above 94°F)
- 7 days/yr
- Hot days in 30 yrs
- 15 days/yr
Wind risk 1/10 · Minimal
- Chance of severe wind over 30 yrs
- —
Air-quality risk 9/10 · Severe
- Unhealthy air days now
- 17 days/yr
- Unhealthy air days in 30 yrs
- 19 days/yr
Risk factors via First Street. Map © Google.
Why this score? — see what drove the B- grade
The composite is a weighted blend of 9 inputs, each scored 0–100. Each bar is that input's sub-score; the figure is the points it added to the 100-point composite (weight × sub-score).
- Cash flow +25.6/30.0
- ARV discount +15.0/15.0
- DSCR +8.5/10.0
- 1% rule +5.5/10.0
- Schools +5.2/10.0
- Livability +3.9/5.0
- Rent growth +2.5/5.0
- Condition / age +2.5/5.0
- Appreciation +0.0/10.0
$110,000
🖨 Deal sheet 📄 Offer letter ✓ Due diligence
Listing remarks
RENT TO OWN AVAILABLE! Stop renting and start working toward homeownership with this brand new 2025 manufactured home in Colville Mobile Home Park in Colville, Washington! Flexible rent-to-own terms may be available for qualified buyers, making this an excellent opportunity for those looking for an alternative to traditional financing. Please note that the purchase price under rent-to-own terms will be higher than the standard cash or financed sale price. This beautiful 3-bedroom, 2-bath home features a bright, open-concept layout with modern finishes throughout. The kitchen comes fully equipped with stainless steel appliances, including a refrigerator, range, microwave and dishwasher&mdash
Key facts
- New construction
- Modern kitchen
- 4,416 sq ft lot
Tags
Neighborhood map
What this means for you Summary
Snapshot
- This is a 3-bed/2.0-bath manufactured listed at $110k.
Deal economics
- At list price, monthly cash flow is $262 ($3k/yr) — positive.
- The deal already cash-flows at list — no discount required.
- Meets the 1% rule at list price ($1k rent vs $110k).
- Recommended offer: $97k (12.0% below list) — sets the bar for market timing.
- Cap rate 9.1% vs local median 1.6% in Colville — top-decile yield for the area; either an underpriced asset or a hidden risk that comps aren't pricing in. Stress-test before assuming the spread holds.
Location & tenants
- Location reads 78/100 on livability (#119 in WA, #2,418 nationally) — a middle-class / working-renter tenant base. Strengths: crime A+, amenities A+, health & safety A+; Watch: employment D, commute F.
- Colville School District (town): math 52% / reading 67% proficiency, ranked #75 of 291 in WA (top 26%) — acceptable for families but not a draw, mixed tenant base, ~2y average lease.
- Market conditions: 138 active listings in the ZIP; 341 units permitted in Stevens County in 2024 (72 in 5+ unit buildings).
Forward outlook
- Local home prices are declining (-3.0%/yr); year-one equity from $761 of loan paydown is wiped out by about $3k of value loss. Plan a longer hold.
- Stevens County population projected at -12% by 2050 — secular population decline; favor cash flow + early exit over multi-decade hold.
Negotiation context
- It's been on market 191 days — a 12% lower offer ($97k) is reasonable based on typical stale-listing flexibility.
Risks & watch-outs
- Climate carrying-cost: major wildfire risk — expect insurance premiums to compound above CPI over the hold.
Questions for the listing agent
- It's been on market 191 days. Have you received any prior offers? Is the seller open to a 12% concession, seller financing, or rate buy-down credit?
- Why hasn't it sold? Are there any deal-killer items the seller is aware of (foundation, flood, title, zoning, code violations)?
- Is there a deadline driving the sale (1031 exchange, divorce, estate, relocation)? That informs how much negotiation room exists.
- Schools are B-rated — typically a magnet for longer-tenancy family renters. What's the average tenant stay here, and is there a school-zone premium baked into asking?
- What's the average days-on-market for RENTAL listings here right now (not sales)? A rising rental-DOM trend means longer vacancies and softer asking-rent achievability than the comps imply.
- What's the recent tenant-quality profile in this submarket — average credit score on applications, eviction rate, late-payment / NSF rate, and stable-employment percentage? A property-management company in the area should have these aggregated.
- How much new for-sale + rental construction is in the pipeline within 1–3 miles? Heavy new supply typically softens prices + rents 12–24 months out; constrained supply supports both.
Investment metrics
- 1% rule
- 1.05% ✓
- Cap rate
- 9.15%
- Cash-on-cash
- 10.19%
- DSCR
- 1.45
- GRM
- 8.0
CMA / ARV
- ARV (median comp)
- $169,681
- List price
- $110,000
- Delta
- -35.17%
- Verdict
- UNDERPRICED
- Comps
- 2 within 1.0 mi
Show comp detail 3 sales within ~0.75 mi
| Address | Dist | Beds/Ba | Sqft | Sold | Price | $/sf | Match |
|---|---|---|---|---|---|---|---|
| 468 W 8th Ave | 0.07mi | 3/2.0 | 938 (+2%) | 10mo | $89,000 | $95 | 86 |
| 484 W 8th Ave | 0.03mi | 3/2.0 | 938 (+2%) | 12mo | $120,000 | $128 | 86 |
| 534 W 8th Ave | 0.04mi | 3/2.0 | 980 (+6%) | 18mo | $100,000 | $102 | 73 |
Match score weights: distance 35% · size 25% · config 20% · recency 20%. Top-matched comps best support the ARV.
Projected returns pro-forma
-3.0% appreciation · 3.0% rent growth · sell at horizon
- IRR
- -1.0%
- Equity multiple
- 0.96×
- Total profit
- $-1,218
- Equity at exit
- $16,401
- IRR
- 8.6%
- Equity multiple
- 1.66×
- Total profit
- $20,181
- Equity at exit
- $9,511
Cash invested: $30,800 (down + closing). Projections, not guarantees.
Landlord ↔ Tenant lean methodology
- Overall (STATE)
- 28 Tenant-Leaning
- State Washington
- 28 Tenant-Leaning · D+8
- County
- — inherits STATE
- City
- — inherits STATE
ZIP-level market 99114
- Home prices YoY
- -24.3%
- Active inventory
- 138
- Price-to-rent
- 8.0×
Monthly cashflow live
- Estimated rent
- $1,152 medium interval (Pro) →
- Mortgage (P&I)
- −$577
- Tax from tax record
- −$26 /mo · $310/yr
- Insurance
- −$46
- HOA
- −$0
- Vacancy / Maint / Mgmt
- −$242
- Net cashflow
- $262
Break-even live
UW: 25.0% down · 7.5% · 30yr · 1.5% tax · 5.0% vac · 8.0% maint · 8.0% mgmt
Financing live
Cash to close
- Down payment
- $27,500
- Closing costs
- $3,300
- Reserves months
- —
- Total cash needed
- —
Loan-product check · same deal, 3 products live
Conventional
25% down · 7.5% · 30yr
- Down + closing
- —
- Monthly P&I
- —
- Monthly cashflow
- —
- DSCR
- —
- Eligible?
- —
Personal DTI + credit; lowest rate.
DSCR
20% down · 8.5% · 30yr
- Down + closing
- —
- Monthly P&I
- —
- Monthly cashflow
- —
- DSCR
- —
- Eligible?
- —
No personal income docs; deal must DSCR.
Hard money
10% down · 12.0% · 12mo
- Down + closing
- —
- Monthly P&I
- —
- Monthly cashflow
- —
- DSCR
- —
- Eligible?
- —
Short-term bridge; refi at stabilization.
Listing history 19 events
-
2026-06-18days on market $110,000 Active 191 DOM
-
2026-06-17days on market $110,000 Active 190 DOM
-
2026-06-16days on market $110,000 Active 189 DOM
-
2026-06-15days on market $110,000 Active 188 DOM
-
2026-06-15days on market $110,000 Active 187 DOM
-
2026-06-13days on market $110,000 Active 186 DOM
-
2026-06-12days on market $110,000 Active 185 DOM
-
2026-06-09days on market $110,000 Active 182 DOM
-
2026-06-08days on market $110,000 Active 181 DOM
-
2026-06-08days on market $110,000 Active 180 DOM
-
2026-06-03days on market $110,000 Active 176 DOM
-
2026-06-02remarks 699-char remark
-
2026-06-02days on market $110,000 Active 175 DOM
-
2026-06-01days on market $110,000 Active 174 DOM
-
2026-05-31days on market $110,000 Active 173 DOM
-
2026-05-06price $110,000
-
2026-04-07price $115,000
-
2026-01-21price $118,000
-
2025-12-09$120,000 Active
ⓘ Source: listings_history table (triggers on properties + properties_extension) + one-shot
backfill from property_details.listing_events for pre-trigger history.
Tax reassessment forecast WA · Resets to sale price
- Current annual tax
- $310 · $26/mo
- Projected year-2 tax
- $1,078 · $90/mo
- Expected delta
- +$768/yr (+$64/mo · 247.6%)
ⓘ Screening estimate from a state-policy table — verify with the county assessor before closing.
Climate risk First Street
- Flood 1/10 Low FEMA zone X · 0% chance over 30 yrs
- Wildfire 7/10 Severe
- Heat 4/10 Moderate 7 d/yr ≥94°F today · 15 d/yr by 30 yrs out
- Wind 1/10 Low
- Air quality 9/10 Extreme 17 unhealthy d/yr today · 19 by 30 yrs out
Nearby sold comps map
Loading sold comps map…
Walkable amenities ~0.75 mi
Loading nearby amenities…
Taxation est. · year 1
- Rental income
- $13,824
- − Mortgage interest
- −$6,162
- − Property taxes
- −$310
- − Insurance
- −$550
- − Repairs & maintenance
- −$1,106
- − Management
- −$1,106
- − Depreciation
- −$3,200
- Taxable income
- $1,390
- Est. tax owed @ 24.0%
- −$334
- After-tax cash flow
- $2,805/yr
For passive investors: Depreciation is non-cash, so a rental often shows a tax loss while cash-flowing — sheltering income. Rental losses are passive: they offset passive income freely, and up to $25,000/yr can offset ordinary (W-2) income if you actively participate and your MAGI is under $100k (phasing out to $0 by $150k); unused losses carry forward. On sale, claimed depreciation is recaptured at up to 25%, and gains may owe capital-gains tax (a 1031 exchange can defer both). Figures are a year-1 estimate at your 24.0% rate — not tax advice; consult a CPA.
Schools (NCES district)
- District
- Colville School District
- NCES district ID
- 5301630
- Math proficiency
- 52% ▼ -5.00%
- Reading proficiency
- 67% ▬ 0.00%
- Median HH income
- $43,060
- Composite
- 51.6/100
- National rank
- #3640
- State rank
- #75 of 291 in WA
Livability — Colville
- Score
- 78/100
- State rank
- #119
- US rank
- #2418
Category grades
Schools grade is shown separately in the Schools card above.
Census & demographics
- Census place
- Colville, WA
- Population (ZIP)
- 12,939
Population outlook (Stevens County) Hauer SSP2
- Today (2025)
- 43,696 people
- By 2030
- 43,203 · -1.1%
- By 2040
- 41,190 · -5.7%
- By 2050
- 38,231 · -12.5%
- By 2075
- 31,260 · -28.5%
- By 2100
- 22,931 · -47.5%
Race, ethnicity, and origin ACS 2023
- Neighborhood character
- Predominantly White (87%)
- Race & ethnicity
- White 87% Two or more races 9% Hispanic / Latino 5%
- Common ancestry
- Portuguese 4% Italian 4% Slovak 3%
- Foreign-born
- 1% · Canada
- Languages at home
- 98% English-only · Spanish 1%
Political lean MEDSL · Stevens
- 2024 margin
- Solid R (+44.1) · D 26.7% · R 70.8% · Other 2.5%
- 2008→2024 swing
- -23.4pp toward R · 2008: -20.7pp · 2024: -44.1pp
- All cycles
- 2024: R+44.1 2020: R+42.1 2016: R+40.8 2012: R+27.7 2008: R+20.7
Not yet ingested
- Civics
- —
Market trends
- HPI YoY
- ▼ -99.32%
- Current HPI
- 308.9195
- Rent YoY
- —
- Metro
- —
- State GDP YoY
- ▲ 4.65%
- F500 in state
- 22
Industry mix (Fortune 500 HQ in WA)
| Industry | F500 HQs | Revenue |
|---|---|---|
| Retail | 2 | $269B |
|
||
| Technology / Retail | 1 | $638B |
|
||
| Technology | 1 | $245B |
|
||
| Telecommunications | 1 | $38B |
|
||
| Food / Beverage | 1 | $36B |
|
||
| Automotive / Trucks | 1 | $34B |
|
||
Price history
-8.3% since first listed4 events — show timeline
- 2026-05-06 Price Changed $110,000 NWMLS as Distributed by MLS Grid
- 2026-04-07 Price Changed $115,000 NWMLS as Distributed by MLS Grid
- 2026-01-21 Price Changed $118,000 NWMLS as Distributed by MLS Grid
- 2025-12-09 Listed $120,000 NWMLS as Distributed by MLS Grid
Property tax history
-2.2%/yrLatest (2026): $310 · -1.0% YoY. Source: county tax records.
Cash-flow waterfall
monthlySold comps — $/sqft
last 12 mo · ≤1 miLoading sold comps…