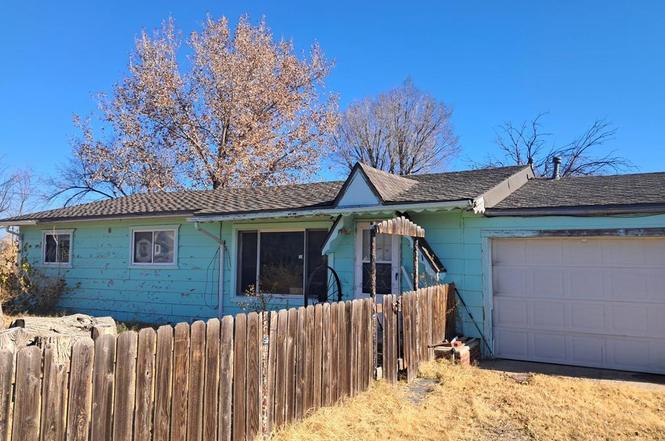
413 Main · North La Junta, CO
Flood risk No data
- FEMA flood zone
- —
- Chance of flooding over 30 yrs
- —
- Est. flood insurance / yr
- —
Fire risk No data
- Est. fire insurance / yr
- —
Heat risk No data
- Hot days now (above threshold)
- —
- Hot days in 30 yrs
- —
Wind risk No data
- Chance of severe wind over 30 yrs
- —
Air-quality risk No data
- Unhealthy air days now
- —
- Unhealthy air days in 30 yrs
- —
Risk factors via First Street. Map © Google.
Why this score? — see what drove the B- grade
The composite is a weighted blend of 9 inputs, each scored 0–100. Each bar is that input's sub-score; the figure is the points it added to the 100-point composite (weight × sub-score).
- Cash flow +28.3/30.0
- ARV discount +15.0/15.0
- DSCR +10.0/10.0
- 1% rule +6.6/10.0
- Livability +3.0/5.0
- Rent growth +2.5/5.0
- Condition / age +2.5/5.0
- Schools +1.3/10.0
- Appreciation +0.0/10.0
$99,500
🖨 Deal sheet 📄 Offer letter ✓ Due diligence
Listing remarks MLS
A lot of potential with this 3 bedroom house, 1 car garage and a fenced yard located in a Country Subdivision with the convenience of City Amenities.
Key facts
- Fenced area
- Garage type building
- Half an acre
Tags
Property features AI
Finance
- HOA & community: No association amenities
Exterior
- Parking: Attached garage; Detached garage; Total of 2 garage spaces
- Utilities: Public water; Public sewer
- Home design: Single-family residential; Frame construction with wood siding; Composition roof
- Construction: Frame construction; Wood siding; Composition roof; Basement
- Exterior features: Wood fencing; Corner, irregular lot; Yard shed
Interior
- Kitchen: Range; Oven; Dishwasher
- Bedrooms: 3 main-level bedrooms
- Flooring: Vinyl flooring
- Bathrooms: 1 full bathroom on main level
- Heating & cooling: Natural gas forced-air heating; Central air conditioning; Ceiling fans
- Interior features: Ceiling fans; Master bedroom on main floor; Wood-burning freestanding fireplace; Basement with sump pump
- Laundry & utility: Laundry on main level
Neighborhood map
What this means for you Summary
Snapshot
- This is a 3-bed/1.0-bath single-family listed at $100k.
Deal economics
- At list price, monthly cash flow is $319 ($4k/yr) — positive.
- The deal already cash-flows at list — no discount required.
- Meets the 1% rule at list price ($1k rent vs $100k).
- Recommended offer: $88k (12.0% below list) — sets the bar for market timing.
Location & tenants
- Location reads 59/100 on livability (#264 in CO) — a working-class tenant base; expect higher turnover. Strengths: cost of living A+, housing A+; Watch: employment C-, health & safety C-, schools F.
- East Otero School District No. R1 (town): math 7% / reading 26% proficiency, ranked #83 of 86 in CO (top 96%) — low school quality limits family demand, transient renter base, plan for 1-2y turnover; 65% free/reduced lunch — lower-income household profile, screen leases tightly.
- Market conditions: 84 active listings in the ZIP; 11 units permitted in Otero County in 2024 (0 in 5+ unit buildings).
Forward outlook
- Local home prices are declining (-3.0%/yr); year-one equity from $688 of loan paydown is wiped out by about $3k of value loss. Plan a longer hold.
- Otero County population projected at -17% by 2050 — secular population decline; favor cash flow + early exit over multi-decade hold.
- At projected returns (-3.0% appreciation + 3.0% rent growth), your $28k cash investment doubles in ~9 years — after that, you're playing with house money.
Negotiation context
- It's been on market 206 days — a 12% lower offer ($88k) is reasonable based on typical stale-listing flexibility.
- 2 sale attempts since 8y ago; this cycle's ask has dropped $8k (8%) from the opening price — seller is motivated, your offer sets the floor, not the list.
- Current owner paid $38k; list at $100k implies a 165% gain — meaningful room to come down on a strong offer.
Questions for the listing agent
- It's been on market 206 days. Have you received any prior offers? Is the seller open to a 12% concession, seller financing, or rate buy-down credit?
- Built in 1964 — when were the roof, HVAC, electrical panel, plumbing, and water heater last replaced?
- Why hasn't it sold? Are there any deal-killer items the seller is aware of (foundation, flood, title, zoning, code violations)?
- Is there a deadline driving the sale (1031 exchange, divorce, estate, relocation)? That informs how much negotiation room exists.
- Schools are F-rated, which usually means shorter tenancies and higher turnover. Who's the typical renter profile here, and what's been the actual vacancy rate?
- Crime grade is F in this area — have there been break-ins, vandalism, or insurance claims at this property in the last 3 years? What carrier currently insures it and at what premium?
- What's the average days-on-market for RENTAL listings here right now (not sales)? A rising rental-DOM trend means longer vacancies and softer asking-rent achievability than the comps imply.
- What's the recent tenant-quality profile in this submarket — average credit score on applications, eviction rate, late-payment / NSF rate, and stable-employment percentage? A property-management company in the area should have these aggregated.
- How much new for-sale + rental construction is in the pipeline within 1–3 miles? Heavy new supply typically softens prices + rents 12–24 months out; constrained supply supports both.
Investment metrics
- 1% rule
- 1.16% ✓
- Cap rate
- 10.14%
- Cash-on-cash
- 13.75%
- DSCR
- 1.61
- GRM
- 7.2
CMA / ARV
- ARV (on-the-fly)
- $161,784
- Comps found
- 3
Show comp detail 3 sales within ~0.75 mi
| Address | Dist | Beds/Ba | Sqft | Sold | Price | $/sf | Match |
|---|---|---|---|---|---|---|---|
| 607 N Main St | 0.20mi | 3/1.0 | 1,650 (+10%) | 13mo | $179,000 | $108 | 63 |
| 206 Melon | 0.50mi | 3/2.0 | 1,408 (-6%) | 6mo | $261,500 | $186 | 58 |
| 217 Olive Ave | 0.29mi | 3/2.0 | 1,710 (+14%) | 19mo | $120,000 | $70 | 43 |
Match score weights: distance 35% · size 25% · config 20% · recency 20%. Top-matched comps best support the ARV.
Projected returns pro-forma
-3.0% appreciation · 3.0% rent growth · sell at horizon
- IRR
- 3.9%
- Equity multiple
- 1.15×
- Total profit
- $4,175
- Equity at exit
- $14,836
- IRR
- 13.4%
- Equity multiple
- 2.06×
- Total profit
- $29,663
- Equity at exit
- $8,603
Cash invested: $27,860 (down + closing). Projections, not guarantees.
Landlord ↔ Tenant lean methodology
- Overall (STATE)
- 38 Tenant-Leaning
- State Colorado
- 38 Tenant-Leaning · D+4
- County
- — inherits STATE
- City
- — inherits STATE
ZIP-level market 81050
- Active inventory
- 84
- Price-to-rent
- 7.2×
Monthly cashflow live
- Estimated rent
- $1,158 medium interval (Pro) →
- Mortgage (P&I)
- −$522
- Tax from tax record
- −$32 /mo · $383/yr
- Insurance
- −$41
- HOA
- −$0
- Vacancy / Maint / Mgmt
- −$243
- Net cashflow
- $319
Break-even live
UW: 25.0% down · 7.5% · 30yr · 1.5% tax · 5.0% vac · 8.0% maint · 8.0% mgmt
Financing live
Cash to close
- Down payment
- $24,875
- Closing costs
- $2,985
- Reserves months
- —
- Total cash needed
- —
Loan-product check · same deal, 3 products live
Conventional
25% down · 7.5% · 30yr
- Down + closing
- —
- Monthly P&I
- —
- Monthly cashflow
- —
- DSCR
- —
- Eligible?
- —
Personal DTI + credit; lowest rate.
DSCR
20% down · 8.5% · 30yr
- Down + closing
- —
- Monthly P&I
- —
- Monthly cashflow
- —
- DSCR
- —
- Eligible?
- —
No personal income docs; deal must DSCR.
Hard money
10% down · 12.0% · 12mo
- Down + closing
- —
- Monthly P&I
- —
- Monthly cashflow
- —
- DSCR
- —
- Eligible?
- —
Short-term bridge; refi at stabilization.
Listing history 19 events
-
2026-06-18days on market $99,500 Active 206 DOM
-
2026-06-17days on market $99,500 Active 205 DOM
-
2026-06-16days on market $99,500 Active 204 DOM
-
2026-06-15days on market $99,500 Active 203 DOM
-
2026-06-13days on market $99,500 Active 201 DOM
-
2026-06-12days on market $99,500 Active 200 DOM
-
2026-06-09days on market $99,500 Active 197 DOM
-
2026-06-08days on market $99,500 Active 196 DOM
-
2026-06-07days on market $99,500 Active 195 DOM
-
2026-06-07days on market $99,500 Active 194 DOM
-
2026-06-04days on market $99,500 Active 191 DOM
-
2026-06-02days on market $99,500 Active 190 DOM
-
2026-06-01days on market $99,500 Active 189 DOM
-
2026-05-31days on market $99,500 Active 188 DOM
-
2026-05-31days on market $99,500 Active 187 DOM
-
2026-05-08price $99,500
-
2025-11-24$108,000 Active
-
2018-08-21soldstatus $37,501 149-char remark
Show marketing remark (149 chars)
A lot of potential with this 3 bedroom house, 1 car garage and a fenced yard located in a Country Subdivision with the convenience of City Amenities.
-
2018-07-19$30,000 149-char remark
Show marketing remark (149 chars)
A lot of potential with this 3 bedroom house, 1 car garage and a fenced yard located in a Country Subdivision with the convenience of City Amenities.
ⓘ Source: listings_history table (triggers on properties + properties_extension) + one-shot
backfill from property_details.listing_events for pre-trigger history.
Tax reassessment forecast CO · Resets to sale price
- Current annual tax
- $383 · $32/mo
- Projected year-2 tax
- $547 · $46/mo
- Expected delta
- +$164/yr (+$14/mo · 42.9%)
ⓘ Screening estimate from a state-policy table — verify with the county assessor before closing.
Nearby sold comps map
Loading sold comps map…
Walkable amenities ~0.75 mi
Loading nearby amenities…
Taxation est. · year 1
- Rental income
- $13,891
- − Mortgage interest
- −$5,574
- − Property taxes
- −$383
- − Insurance
- −$498
- − Repairs & maintenance
- −$1,111
- − Management
- −$1,111
- − Depreciation
- −$2,895
- Taxable income
- $2,320
- Est. tax owed @ 24.0%
- −$557
- After-tax cash flow
- $3,275/yr
For passive investors: Depreciation is non-cash, so a rental often shows a tax loss while cash-flowing — sheltering income. Rental losses are passive: they offset passive income freely, and up to $25,000/yr can offset ordinary (W-2) income if you actively participate and your MAGI is under $100k (phasing out to $0 by $150k); unused losses carry forward. On sale, claimed depreciation is recaptured at up to 25%, and gains may owe capital-gains tax (a 1031 exchange can defer both). Figures are a year-1 estimate at your 24.0% rate — not tax advice; consult a CPA.
Schools (NCES district)
- District
- East Otero School District No. R1
- NCES district ID
- 0805130
- Math proficiency
- 7% ▼ -2.00%
- Reading proficiency
- 26% ▲ 5.00%
- Median HH income
- $33,475
- Composite
- 13.36/100
- National rank
- #9534
- State rank
- #83 of 86 in CO
Livability — North La Junta
- Score
- 59/100
- State rank
- #264
- US rank
- #19718
Category grades
Schools grade is shown separately in the Schools card above.
Census & demographics
- Census place
- North La Junta, CO
- Population (ZIP)
- 9,774
Population outlook (Otero County) Hauer SSP2
- Today (2025)
- 17,363 people
- By 2030
- 16,776 · -3.4%
- By 2040
- 15,534 · -10.5%
- By 2050
- 14,467 · -16.7%
- By 2075
- 12,054 · -30.6%
- By 2100
- 9,392 · -45.9%
Race, ethnicity, and origin ACS 2023
- Neighborhood character
- Diverse neighborhood (Simpson 0.57)
- Race & ethnicity
- White 52% Hispanic / Latino 40% Two or more races 10% Native American 2% Black 1%
- Hispanic origin (detail)
- Mexican 34%
- Common ancestry
- Lithuanian 2% Iranian 2% Slovak 2%
- Foreign-born
- 4% · Canada
- Languages at home
- 85% English-only · Spanish 14%
Political lean MEDSL · Otero
- 2024 margin
- Strong R (+26.4) · D 35.5% · R 61.9% · Other 2.7%
- 2008→2024 swing
- -15.9pp toward R · 2008: -10.5pp · 2024: -26.4pp
- All cycles
- 2024: R+26.4 2020: R+22.5 2016: R+25.2 2012: R+9.3 2008: R+10.5
Not yet ingested
- Civics
- —
Market trends
- HPI YoY
- ▼ -188.44%
- Current HPI
- 232.984
- Rent YoY
- —
- Metro
- —
- State GDP YoY
- ▲ 1.95%
- F500 in state
- 14
Industry mix (Fortune 500 HQ in CO)
| Industry | F500 HQs | Revenue |
|---|---|---|
| Technology Distribution | 1 | $31B |
|
||
| Food / Agriculture | 1 | $18B |
|
||
| Packaging | 1 | $14B |
|
||
| Healthcare | 1 | $13B |
|
||
| Energy | 1 | $10B |
|
||
| Technology | 1 | $4B |
|
||
Price history
+231.7% since first listed4 events — show timeline
- 2026-05-08 Price Changed $99,500 PARMLS
- 2025-11-24 Listed $108,000 PARMLS
- 2018-08-21 Sold (MLS) $37,501 PARMLS
- 2018-07-19 Listed $30,000 PARMLS
Property tax history
-0.7%/yrLatest (2024): $383 · -1.3% YoY. Source: county tax records.
Cash-flow waterfall
monthlySold comps — $/sqft
last 12 mo · ≤1 miLoading sold comps…