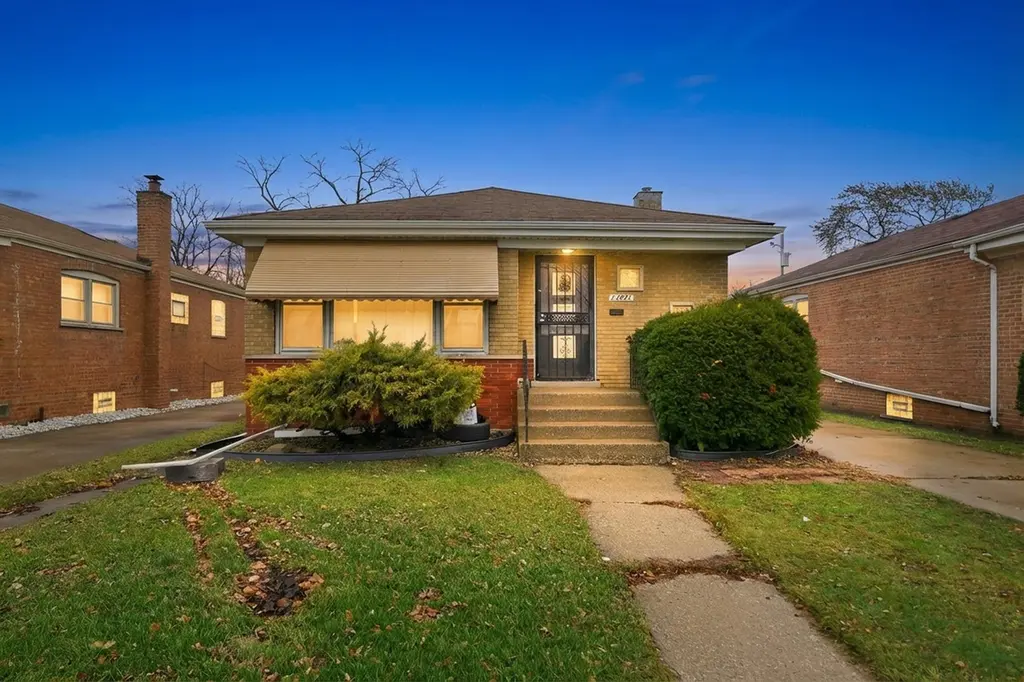
13921 S Stewart Ave · Riverdale, IL
Flood risk 1/10 · Minimal
- FEMA flood zone
- X (unshaded)
- Chance of flooding over 30 yrs
- 0.0%
- Est. flood insurance / yr
- $473 – $860
Fire risk 1/10 · Minimal
- Est. fire insurance / yr
- $804 – $1,492
Heat risk 3/10 · Minor
- Hot days now (above 101°F)
- 7 days/yr
- Hot days in 30 yrs
- 15 days/yr
Wind risk 2/10 · Minimal
- Chance of severe wind over 30 yrs
- —
Air-quality risk 4/10 · Minor
- Unhealthy air days now
- 4 days/yr
- Unhealthy air days in 30 yrs
- 5 days/yr
Risk factors via First Street. Map © Google.
Why this score? — see what drove the D grade
The composite is a weighted blend of 9 inputs, each scored 0–100. Each bar is that input's sub-score; the figure is the points it added to the 100-point composite (weight × sub-score).
- Cash flow +13.7/30.0
- ARV discount +8.2/15.0
- 1% rule +6.6/10.0
- Rent growth +4.5/5.0
- DSCR +4.1/10.0
- Livability +3.5/5.0
- Condition / age +2.5/5.0
- Schools +0.7/10.0
- Appreciation +0.0/10.0
$135,000
🖨 Deal sheet 📄 Offer letter ✓ Due diligence
Listing remarks
Solid brick home offering peace of mind and long-term value. This well-maintained property features a full brick exterior, providing durability, low maintenance, and timeless curb appeal. The home includes a long driveway that can accommodate 5+ vehicles, a rare and valuable feature for gatherings, multiple drivers, or work vehicles. The fully fenced backyard offers privacy and functional outdoor space, ideal for entertaining, pets, or everyday use. Inside, the property has been thoughtfully cared for, including a new furnace for efficient heating and lower utility costs and NEW WINDOWS. The basement has been professionally waterproofed and sealed, adding usable space and protection from mo
Key facts
- 5,318 sq ft lot
- Parking
- Built 1959
Property features AI
Finance
- Other: Commuter bus and commuter train access; school bus service available
- HOA & community: No master association fee required
Exterior
- Parking: Assigned parking (concrete); total of 1 parking space; Other parking features
- Utilities: Public water; Public sewer
- Home design: Detached single-family home; One-story; Fee simple ownership; Built approximately 61–70 years ago; Brick exterior
- Construction: Brick construction; Built before 1978
- Exterior features: Patio; Lot approximately 40 x 125 (less than 0.25 acre)
Interior
- Kitchen: Kitchen with eating area/table space (approx. 16 x 12)
- Bedrooms: Three bedrooms (all on the main level) — Master: 10 x 10; Bedroom 2: 10 x 9; Bedroom 3: 10 x 10
- Bathrooms: One full bathroom
- Heating & cooling: Forced air heating; Central air conditioning
- Interior features: Five total rooms; Unfinished full basement
- Laundry & utility: Laundry room
Neighborhood map
What this means for you Summary
Snapshot
- This is a 3-bed/1.0-bath single-family listed at $135k.
Deal economics
- At list price, monthly cash flow is $10 ($115/yr) — positive.
- The deal already cash-flows at list — no discount required.
- Meets the 1% rule at list price ($2k rent vs $135k).
- Recommended offer: $131k (3.0% below list) — sets the bar for market timing.
- Cap rate 6.4% vs local median 9.5% in Riverdale — below-typical yield; the buyer is paying a premium for something (appreciation thesis, condition, location) that the cap rate doesn't capture.
Location & tenants
- Location reads 69/100 on livability (#434 in IL) — a middle-class / working-renter tenant base. Strengths: commute A+, cost of living A+, housing A-; Watch: health & safety C-, schools F, crime F.
- Thornton Twp Hsd 205 (suburban): math 7% / reading 8% proficiency, ranked #594 of 620 in IL (top 96%) — low school quality limits family demand, transient renter base, plan for 1-2y turnover.
- Market conditions: Rents rising fast (+7.8%/yr); 76 active listings in the ZIP; 10 comparable units currently listed for rent nearby; rentals at typical pace (median 25d on market — plan ~3-4 weeks tenant-placement turnaround); lower-income renter base — watch delinquency; 6,272 units permitted in Cook County in 2024 (4,658 in 5+ unit buildings).
- At $1,569/mo this rent would consume 51% of the median local household income ($37k/yr) (locally 1868% of renters already pay >50% of income on rent) — very limited rent-growth headroom before tenants either downsize or default.
Forward outlook
- Local home prices are declining (-3.0%/yr); year-one equity from $933 of loan paydown is wiped out by about $4k of value loss. Plan a longer hold.
Negotiation context
- It's been on market 31 days — a 3% lower offer ($131k) is reasonable based on typical stale-listing flexibility.
- 7 sale attempts since 16y ago with the ask held roughly flat each time — persistent listings suggest the price (not the market) is what's stuck; bring a comps-based counter.
- Current owner paid $80k; list at $135k implies a 69% gain — meaningful room to come down on a strong offer.
Risks & watch-outs
- Watch-outs: property tax is 4.1% of price; built in 1959 — expect roof / HVAC / electrical / plumbing capex.
Questions for the listing agent
- It's been on market 31 days. Have you received any prior offers? Is the seller open to a 3% concession, seller financing, or rate buy-down credit?
- Built in 1959 — when were the roof, HVAC, electrical panel, plumbing, and water heater last replaced?
- Property tax is high relative to price — has the assessment been appealed recently, and will the sale trigger a re-assessment?
- Is there a deadline driving the sale (1031 exchange, divorce, estate, relocation)? That informs how much negotiation room exists.
- Schools are F-rated, which usually means shorter tenancies and higher turnover. Who's the typical renter profile here, and what's been the actual vacancy rate?
- Crime grade is F in this area — have there been break-ins, vandalism, or insurance claims at this property in the last 3 years? What carrier currently insures it and at what premium?
- The area grade is low — what's the realistic commute time and amenity access for the typical tenant pool here? Any planned neighborhood developments (good or bad) we should know about?
- What's the average days-on-market for RENTAL listings here right now (not sales)? A rising rental-DOM trend means longer vacancies and softer asking-rent achievability than the comps imply.
- What's the recent tenant-quality profile in this submarket — average credit score on applications, eviction rate, late-payment / NSF rate, and stable-employment percentage? A property-management company in the area should have these aggregated.
- How much new for-sale + rental construction is in the pipeline within 1–3 miles? Heavy new supply typically softens prices + rents 12–24 months out; constrained supply supports both.
Investment metrics
- 1% rule
- 1.16% ✓
- Cap rate
- 6.38%
- Cash-on-cash
- 0.30%
- DSCR
- 1.01
- GRM
- 7.2
CMA / ARV
- ARV (on-the-fly)
- $137,214
- Comps found
- 12
Show comp detail 12 sales within ~0.75 mi
| Address | Dist | Beds/Ba | Sqft | Sold | Price | $/sf | Match |
|---|---|---|---|---|---|---|---|
| 14235 S Dearborn St | 0.63mi | 3/1.5 | 1,091 (+0%) | 4mo | $80,000 | $73 | 66 |
| 14231 S Dearborn St | 0.61mi | 3/1.0 | 1,116 (+2%) | 3mo | $178,000 | $159 | 65 |
| 14322 S Wentworth Ave | 0.57mi | 2/1.0 (-1) | 1,078 (-1%) | 5mo | $136,000 | $126 | 62 |
| 14201 S Wentworth Ave | 0.43mi | 2/2.0 (-1) | 1,058 (-3%) | 4mo | $72,000 | $68 | 62 |
| 13709 S School St | 0.29mi | 4/1.0 (+1) | 1,200 (+10%) | 3mo | $188,000 | $157 | 62 |
| 302 W 145th St | 0.73mi | 3/2.0 | 1,087 (-0%) | 0mo | $250,000 | $230 | 61 |
| 14234 S Michigan Ave | 0.75mi | 3/1.0 | 1,102 (+1%) | 3mo | $114,000 | $103 | 61 |
| 13829 S State St | 0.51mi | 3/1.5 | 1,000 (-8%) | 2mo | $80,000 | $80 | 59 |
| 14135 S La Salle St | 0.45mi | 3/1.5 | 1,210 (+11%) | 1mo | $60,000 | $50 | 58 |
| 14129 S Michigan Ave | 0.70mi | 3/2.0 | 1,146 (+5%) | 4mo | $200,000 | $175 | 51 |
| 14231 S State St | 0.66mi | 2/1.0 (-1) | 1,000 (-8%) | 0mo | $145,000 | $145 | 50 |
| 13749 S Wabash Ave | 0.64mi | 3/1.0 | 945 (-13%) | 4mo | $30,000 | $32 | 45 |
Match score weights: distance 35% · size 25% · config 20% · recency 20%. Top-matched comps best support the ARV.
Projected returns pro-forma
-3.0% appreciation · 7.82% rent growth · sell at horizon
- IRR
- -8.9%
- Equity multiple
- 0.65×
- Total profit
- $-13,084
- Equity at exit
- $20,129
- IRR
- 7.3%
- Equity multiple
- 1.70×
- Total profit
- $26,397
- Equity at exit
- $11,672
Cash invested: $37,800 (down + closing). Projections, not guarantees.
Landlord ↔ Tenant lean methodology
- Overall (STATE)
- 43 Moderately Tenant-Leaning
- State Illinois
- 43 Moderately Tenant-Leaning · D+7
- County
- — inherits STATE
- City
- — inherits STATE
ZIP-level market 60827
- Home prices YoY
- -31.8%
- Rents YoY
- 7.8%
- Active inventory
- 76
- Price-to-rent
- 7.2×
Monthly cashflow live
- Estimated rent
- $1,569 high interval (Pro) →
- Mortgage (P&I)
- −$708
- Tax from tax record
- −$465 /mo · $5,585/yr
- Insurance
- −$56
- HOA
- −$0
- Vacancy / Maint / Mgmt
- −$329
- Net cashflow
- $10
Break-even live
UW: 25.0% down · 7.5% · 30yr · 1.5% tax · 5.0% vac · 8.0% maint · 8.0% mgmt
Financing live
Cash to close
- Down payment
- $33,750
- Closing costs
- $4,050
- Reserves months
- —
- Total cash needed
- —
Loan-product check · same deal, 3 products live
Conventional
25% down · 7.5% · 30yr
- Down + closing
- —
- Monthly P&I
- —
- Monthly cashflow
- —
- DSCR
- —
- Eligible?
- —
Personal DTI + credit; lowest rate.
DSCR
20% down · 8.5% · 30yr
- Down + closing
- —
- Monthly P&I
- —
- Monthly cashflow
- —
- DSCR
- —
- Eligible?
- —
No personal income docs; deal must DSCR.
Hard money
10% down · 12.0% · 12mo
- Down + closing
- —
- Monthly P&I
- —
- Monthly cashflow
- —
- DSCR
- —
- Eligible?
- —
Short-term bridge; refi at stabilization.
Rent comps 10 comps
| Address | Beds | Baths | Sqft | Rent | $/sqft | DOM | Units | Dist |
|---|---|---|---|---|---|---|---|---|
| 14015 S Stewart Ave Unit 2W Riverdale, IL | 2.0 | 1.0 | 800 | $1,400 | $1.75 | 24d | 1 | 0.13mi |
| 14101 S Atlantic Ave Riverdale, IL | 2.0 | 1.0 | 790 | $1,140 | $1.44 | 7d | 1 | 0.28mi |
| 13810 S La Salle St #1 Riverdale, IL | 3.0 | 1.0 | 800 | $1,550 | $1.94 | 2d | 1 | 0.29mi |
| 13708 S Wentworth Ave Riverdale, IL | 3.0 | 1.5 | 1500 | $2,200 | $1.47 | 22d | 1 | 0.33mi |
| 13604 S Wentworth Ave Riverdale, IL | 3.0 | 1.0 | 1100 | $1,200 | $1.09 | 24d | 1 | 0.43mi |
| 724 W 138th St Unit 3 Riverdale, IL | 2.0 | 1.0 | 800 | $1,250 | $1.56 | 18d | 1 | 0.48mi |
| 14124 Manor Ave Dolton, IL | 3.0 | 2.0 | 1440 | $2,390 | $1.66 | 24d | 1 | 0.88mi |
| 13841 Forest Ave Dolton, IL | 3.0 | 1.0 | 930 | $1,895 | $2.04 | 24d | 1 | 1.04mi |
| 14844 Wabash Ave Dolton, IL | 3.0 | 1.5 | 1277 | $2,320 | $1.82 | 24d | 1 | 1.30mi |
| 12827 S Morgan St Unit 1546010P Chicago, IL | 4.0 | 2.0 | 1022 | $4,677 | $4.58 | 12d | 1 | 1.47mi |
Listing history 30 events
-
2026-06-15days on market $135,000 Active 31 DOM
-
2026-06-13days on market $135,000 Active 29 DOM
-
2026-06-13days on market $135,000 Active 28 DOM
-
2026-06-09days on market $135,000 Active 25 DOM
-
2026-06-08days on market $135,000 Active 24 DOM
-
2026-06-07days on market $135,000 Active 23 DOM
-
2026-06-04days on market $135,000 Active 20 DOM
-
2026-06-03days on market $135,000 Active 19 DOM
-
2026-06-02days on market $135,000 Active 18 DOM
-
2026-06-01days on market $135,000 Active 17 DOM
-
2026-05-31days on market $135,000 Active 16 DOM
-
2026-05-15$135,000 Active
-
2026-05-15historical
-
2026-05-06Active
-
2026-05-06historical
-
2026-03-04price
-
2026-01-21Active
-
2026-01-21historical
-
2025-12-23Active
-
2018-11-07soldstatus $80,000
-
2018-10-25soldstatus $80,000 Closed Sale
-
2018-08-27historical Contingent
-
2018-08-21status Reactivated
-
2018-07-31historical Contingent
-
2018-07-30status Pending
-
2018-07-17$89,900 New
-
2010-05-13soldstatus $24,502 Closed Sale
-
2010-03-03status Pending
-
2010-02-19$20,000 New
-
2000-12-19soldstatus $77,000
ⓘ Source: listings_history table (triggers on properties + properties_extension) + one-shot
backfill from property_details.listing_events for pre-trigger history.
Tax reassessment forecast IL · Partial reset (capped growth)
- Current annual tax
- $5,585 · $465/mo
- Projected year-2 tax
- $5,585 · $465/mo
- Expected delta
- $0/yr ($0/mo · 0.0%)
ⓘ Screening estimate from a state-policy table — verify with the county assessor before closing.
Climate risk First Street
- Flood 1/10 Low FEMA zone X (unshaded) · 0% chance over 30 yrs
- Wildfire 1/10 Low
- Heat 3/10 Moderate 7 d/yr ≥101°F today · 15 d/yr by 30 yrs out
- Wind 2/10 Low
- Air quality 4/10 Moderate 4 unhealthy d/yr today · 5 by 30 yrs out
Nearby sold comps map
Loading sold comps map…
Walkable amenities ~0.75 mi
Loading nearby amenities…
Taxation est. · year 1
- Rental income
- $18,824
- − Mortgage interest
- −$7,562
- − Property taxes
- −$5,585
- − Insurance
- −$675
- − Repairs & maintenance
- −$1,506
- − Management
- −$1,506
- − Depreciation
- −$3,927
- Taxable loss
- −$1,938
- Est. tax savings @ 24.0%
- +$465
- After-tax cash flow
- $580/yr
For passive investors: Depreciation is non-cash, so a rental often shows a tax loss while cash-flowing — sheltering income. Rental losses are passive: they offset passive income freely, and up to $25,000/yr can offset ordinary (W-2) income if you actively participate and your MAGI is under $100k (phasing out to $0 by $150k); unused losses carry forward. On sale, claimed depreciation is recaptured at up to 25%, and gains may owe capital-gains tax (a 1031 exchange can defer both). Figures are a year-1 estimate at your 24.0% rate — not tax advice; consult a CPA.
Schools (NCES district)
- District
- Thornton Twp Hsd 205
- NCES district ID
- 1738970
- Math proficiency
- 7% ▬ 0.00%
- Reading proficiency
- 8% ▼ -2.00%
- Median HH income
- $43,392
- Composite
- 6.92/100
- National rank
- #9976
- State rank
- #594 of 620 in IL
Livability — Riverdale
- Score
- 69/100
- State rank
- #434
- US rank
- #8867
Category grades
Schools grade is shown separately in the Schools card above.
Census & demographics
- Census place
- Riverdale, IL
- County
- Cook County · 4,486,803 people
- City population
- 24,713
- Metro
- Chicago-Naperville-Elgin, IL-IN-WI
- Population (ZIP)
- 24,713
- Household income
- $37,217
- Rent vs Own
- Severe rent burden
- 1868.0
Population outlook (Cook County) Hauer SSP2
- Today (2025)
- 5,347,519 people
- By 2030
- 5,357,703 · +0.2%
- By 2040
- 5,324,924 · -0.4%
- By 2050
- 5,230,762 · -2.2%
- By 2075
- 4,785,735 · -10.5%
- By 2100
- 4,188,836 · -21.7%
Race, ethnicity, and origin ACS 2023
- Neighborhood character
- Predominantly Black (88%)
- Race & ethnicity
- Black 88% Two or more races 5% Hispanic / Latino 5% White 2%
- Common ancestry
- Iranian 1%
- Foreign-born
- 2% · Canada
- Languages at home
- 96% English-only · Spanish 3%
Political lean MEDSL · Cook
- 2024 margin
- Solid D (+42.0) · D 70.4% · R 28.4% · Other 1.2%
- 2008→2024 swing
- -11.4pp toward R · 2008: 53.4pp · 2024: 42.0pp
- All cycles
- 2024: D+42.0 2020: D+50.3 2016: D+53.0 2012: D+49.4 2008: D+53.4
Not yet ingested
- Civics
- —
Market trends
- HPI YoY
- ▼ -76.39%
- Current HPI
- 163.7725
- Rent YoY
- ▲ 7.82%
- Metro
- Chicago-Naperville-Elgin, IL-IN-WI
- State GDP YoY
- ▲ 1.59%
- F500 in state
- 60
Industry mix (Fortune 500 HQ in IL)
| Industry | F500 HQs | Revenue |
|---|---|---|
| Insurance | 4 | $201B |
|
||
| Consumer Goods | 4 | $87B |
|
||
| Industrial Machinery | 3 | $64B |
|
||
| Healthcare | 2 | $55B |
|
||
| Retail / Pharmacy | 1 | $148B |
|
||
| Agriculture / Food | 1 | $86B |
|
||
Price history
+75.3% since first listed19 events — show timeline
- 2026-05-15 Listed $135,000 MRED as Distributed by MLS Grid
- 2026-05-15 Listing Removed — MRED as Distributed by MLS Grid
- 2026-05-06 Listed — MRED as Distributed by MLS Grid
- 2026-05-06 Listing Removed — MRED as Distributed by MLS Grid
- 2026-03-04 Price Changed — MRED as Distributed by MLS Grid
- 2026-01-21 Listed — MRED as Distributed by MLS Grid
- 2026-01-21 Listing Removed — MRED as Distributed by MLS Grid
- 2025-12-23 Listed — MRED as Distributed by MLS Grid
- 2018-11-07 Sold (Public Records) $80,000 Public Records
- 2018-10-25 Sold (MLS) $80,000 MRED as Distributed by MLS Grid
- 2018-08-27 Contingent — MRED as Distributed by MLS Grid
- 2018-08-21 Relisted — MRED as Distributed by MLS Grid
- 2018-07-31 Contingent — MRED as Distributed by MLS Grid
- 2018-07-30 Pending — MRED as Distributed by MLS Grid
- 2018-07-17 Listed $89,900 MRED as Distributed by MLS Grid
- 2010-05-13 Sold (MLS) $24,502 MRED as Distributed by MLS Grid
- 2010-03-03 Pending — MRED as Distributed by MLS Grid
- 2010-02-19 Listed $20,000 MRED as Distributed by MLS Grid
- 2000-12-19 Sold (Public Records) $77,000 Public Records
Property tax history
+3.7%/yrLatest (2023): $5,585 · +123.4% YoY. Source: county tax records.
Cash-flow waterfall
monthlySold comps — $/sqft
last 12 mo · ≤1 miLoading sold comps…