None · Macedonia, OH
Flood risk 1/10 · Minimal
- FEMA flood zone
- X (unshaded)
- Chance of flooding over 30 yrs
- 0.0%
- Est. flood insurance / yr
- $507 – $1,088
Fire risk 1/10 · Minimal
- Est. fire insurance / yr
- $713 – $1,323
Heat risk 2/10 · Minimal
- Hot days now (above 96°F)
- 7 days/yr
- Hot days in 30 yrs
- 17 days/yr
Wind risk 1/10 · Minimal
- Chance of severe wind over 30 yrs
- —
Air-quality risk 2/10 · Minimal
- Unhealthy air days now
- 1 days/yr
- Unhealthy air days in 30 yrs
- 3 days/yr
Risk factors via First Street. Map © Google.
Why this score? — see what drove the A- grade
The composite is a weighted blend of 9 inputs, each scored 0–100. Each bar is that input's sub-score; the figure is the points it added to the 100-point composite (weight × sub-score).
- Cash flow +30.0/30.0
- ARV discount +15.0/15.0
- 1% rule +10.0/10.0
- DSCR +10.0/10.0
- Schools +6.6/10.0
- Livability +4.0/5.0
- Rent growth +2.5/5.0
- Condition / age +2.5/5.0
- Appreciation +0.0/10.0
$155,000
🖨 Deal sheet 📄 Offer letter ✓ Due diligence
Listing remarks MLS
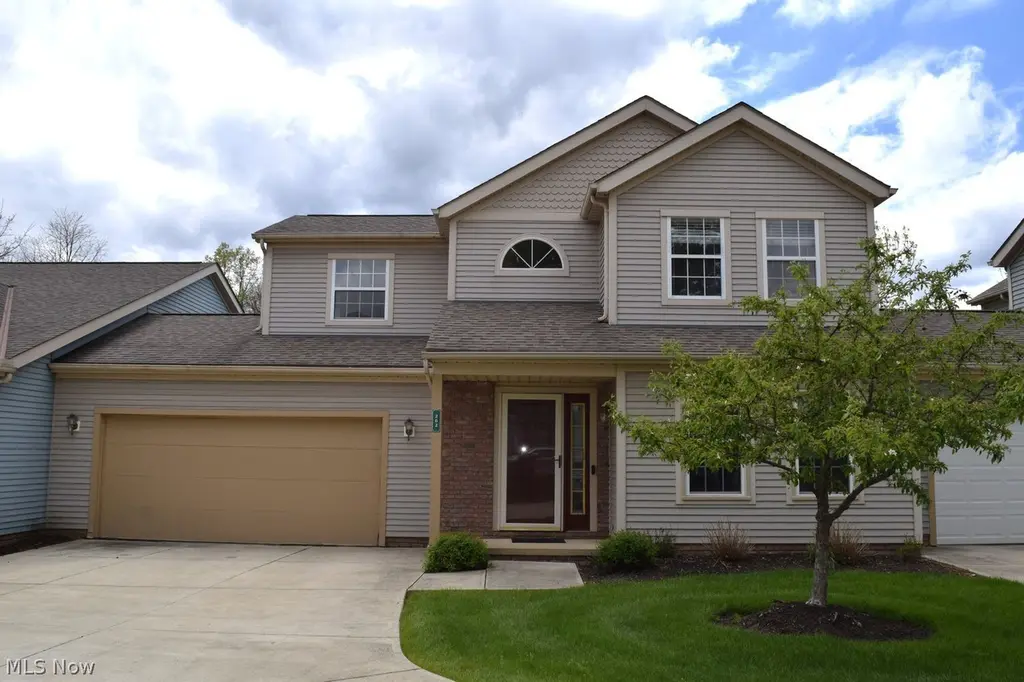
Maintenance Free Colonial Condo! Nice and cozy dinette. Formal dining room Sliders to rear deck with view of pond and wooded area. Kitchen with eating area. Master bedroom with vaulted ceiling and bathroom. Full bathroom upstairs. Great location! Close to highways and local shopping, movie theaters and restaurants. You'll love the location! This property is eligible under the Freddie Mac First Look Initiative through 2/18/2014. Listed and Sold with repairs condition. Homestead/Property assessments are unknown. Attachments, Proof of Buyers Funds, Certified Earnest Money Check made payable to Listing Company to be with ALL offers submitted.
Key facts
- 2,221 sq ft lot
- 2 garage spots
- Built 1996
Neighborhood map
What this means for you Summary
Snapshot
- This is a 3-bed/2.5-bath single-family listed at $155k.
Deal economics
- At list price, monthly cash flow is $2k ($21k/yr) — positive.
- The deal already cash-flows at list — no discount required.
- Meets the 1% rule at list price ($4k rent vs $155k).
- Cap rate 20.2% vs local median 3.4% in Macedonia — top-decile yield for the area; either an underpriced asset or a hidden risk that comps aren't pricing in. Stress-test before assuming the spread holds.
Location & tenants
- Location reads 80/100 on livability (#117 in OH, #1,729 nationally) — a professional / high-income tenant draw. Strengths: schools A+, crime A+, employment A+; Watch: amenities F, commute F.
- Nordonia Hills City (suburban): math 72% / reading 79% proficiency, ranked #71 of 656 in OH (top 11%) — strong family-tenant draw, lease renewals of 3-5y typical; only 17% free/reduced lunch — higher-income household profile.
- Market conditions: 29 active listings in the ZIP; 2 comparable units currently listed for rent nearby; solid renter incomes; 1,114 units permitted in Summit County in 2024 (397 in 5+ unit buildings).
- At $4,139/mo this rent would consume 46% of the median local household income ($108k/yr) (locally 19% of renters already pay >50% of income on rent) — very limited rent-growth headroom before tenants either downsize or default.
Forward outlook
- Local home prices are declining (-3.0%/yr); year-one equity from $1k of loan paydown is wiped out by about $5k of value loss. Plan a longer hold.
- Summit County population projected to shrink 6% by 2050 — rents likely to lag national; underwrite the cash flow, not the appreciation.
- At projected returns (-3.0% appreciation + 3.0% rent growth), your $43k cash investment doubles in ~3 years — after that, you're playing with house money.
Negotiation context
- Only 1 days on market — expect competitive offers; lowballing is unlikely to land.
- 6 sale attempts since 21y ago with the ask held roughly flat each time — persistent listings suggest the price (not the market) is what's stuck; bring a comps-based counter.
- Current owner paid $113k; 37% above their basis — modest negotiation headroom, anchor on the comps not their cost.
Questions for the listing agent
- What does the HOA fee cover, when was the last increase, and are there any pending special assessments or reserve-fund shortfalls?
- Is there a deadline driving the sale (1031 exchange, divorce, estate, relocation)? That informs how much negotiation room exists.
- Schools are A-rated — typically a magnet for longer-tenancy family renters. What's the average tenant stay here, and is there a school-zone premium baked into asking?
- What's the average days-on-market for RENTAL listings here right now (not sales)? A rising rental-DOM trend means longer vacancies and softer asking-rent achievability than the comps imply.
- What's the recent tenant-quality profile in this submarket — average credit score on applications, eviction rate, late-payment / NSF rate, and stable-employment percentage? A property-management company in the area should have these aggregated.
- How much new for-sale + rental construction is in the pipeline within 1–3 miles? Heavy new supply typically softens prices + rents 12–24 months out; constrained supply supports both.
Investment metrics
- 1% rule
- 2.67% ✓
- Cap rate
- 20.16%
- Cash-on-cash
- 49.53%
- DSCR
- 3.20
- GRM
- 3.1
CMA / ARV
- ARV (on-the-fly)
- $288,288
- Comps found
- 12
Show comp detail 12 sales within ~0.75 mi
| Address | Dist | Beds/Ba | Sqft | Sold | Price | $/sf | Match |
|---|---|---|---|---|---|---|---|
| 262 Finchfield Cir | 0.00mi | 3/2.5 | 1,638 (0%) | 0mo | $155,000 | $95 | 100 |
| 8613 Larkspur Ln | 0.18mi | 3/2.5 | 1,602 (-2%) | 2mo | $265,000 | $165 | 86 |
| 8633 Redtail Ct | 0.12mi | 3/2.0 | 1,523 (-7%) | 1mo | $268,000 | $176 | 80 |
| 8690 Foxwood Cir | 0.23mi | 3/2.0 | 1,729 (+6%) | 1mo | $265,000 | $153 | 77 |
| 8712 Elmdale Trce | 0.24mi | 3/2.0 | 1,536 (-6%) | 2mo | $256,000 | $167 | 75 |
| 300 Eagleton Ct | 0.30mi | 3/2.0 | 1,733 (+6%) | 0mo | $396,000 | $229 | 74 |
| 264 Finchfield Cir | 0.02mi | 2/2.0 (-1) | 1,492 (-9%) | 4mo | $249,900 | $167 | 74 |
| 8794 Basswood Pl | 0.34mi | 3/2.0 | 1,768 (+8%) | 2mo | $275,000 | $156 | 67 |
| 8539 Primrose Ln | 0.37mi | 3/3.0 | 1,772 (+8%) | 3mo | $380,000 | $214 | 65 |
| 691 Jaystone Pl | 0.45mi | 3/2.0 | 1,816 (+11%) | 1mo | $362,500 | $200 | 58 |
| 293 Beechwood Dr | 0.68mi | 3/2.0 | 1,702 (+4%) | 3mo | $325,000 | $191 | 57 |
| 47 Beechwood Dr | 0.69mi | 4/2.0 (+1) | 1,394 (-15%) | 5mo | $320,000 | $230 | 31 |
Match score weights: distance 35% · size 25% · config 20% · recency 20%. Top-matched comps best support the ARV.
Projected returns pro-forma
-3.0% appreciation · 3.0% rent growth · sell at horizon
- IRR
- 47.3%
- Equity multiple
- 3.06×
- Total profit
- $89,277
- Equity at exit
- $23,111
- IRR
- 53.0%
- Equity multiple
- 6.21×
- Total profit
- $225,909
- Equity at exit
- $13,402
Cash invested: $43,400 (down + closing). Projections, not guarantees.
Landlord ↔ Tenant lean methodology
- Overall (STATE)
- 73 Landlord-Friendly
- State Ohio
- 73 Landlord-Friendly · R+6
- County
- — inherits STATE
- City
- — inherits STATE
ZIP-level market 44056
- Active inventory
- 29
- Price-to-rent
- 3.1×
Monthly cashflow live
- Estimated rent
- $4,139 medium interval (Pro) →
- Mortgage (P&I)
- −$813
- Tax from tax record
- −$303 /mo · $3,639/yr
- Insurance
- −$65
- HOA
- −$298
- Vacancy / Maint / Mgmt
- −$869
- Net cashflow
- $1,791
Break-even live
UW: 25.0% down · 7.5% · 30yr · 1.5% tax · 5.0% vac · 8.0% maint · 8.0% mgmt
Financing live
Cash to close
- Down payment
- $38,750
- Closing costs
- $4,650
- Reserves months
- —
- Total cash needed
- —
Loan-product check · same deal, 3 products live
Conventional
25% down · 7.5% · 30yr
- Down + closing
- —
- Monthly P&I
- —
- Monthly cashflow
- —
- DSCR
- —
- Eligible?
- —
Personal DTI + credit; lowest rate.
DSCR
20% down · 8.5% · 30yr
- Down + closing
- —
- Monthly P&I
- —
- Monthly cashflow
- —
- DSCR
- —
- Eligible?
- —
No personal income docs; deal must DSCR.
Hard money
10% down · 12.0% · 12mo
- Down + closing
- —
- Monthly P&I
- —
- Monthly cashflow
- —
- DSCR
- —
- Eligible?
- —
Short-term bridge; refi at stabilization.
Rent comps 2 comps
| Address | Beds | Baths | Sqft | Rent | $/sqft | DOM | Units | Dist |
|---|---|---|---|---|---|---|---|---|
| 201 Eaton Ridge Dr Northfield, OH | 1.0–2.0 | 1.0–2.0 | 956 | $1,679 | $1.76 | 1d | 6 | 0.78mi |
| 185 Heights Ave Unit 1496098P Northfield, OH | 4.0 | 2.0 | 1603 | $6,547 | $4.08 | 1d | 1 | 1.27mi |
HOA detail
- Monthly dues
- $298 · $3,576/yr
Listing history 14 events
-
2026-05-03status Pending
-
2026-05-02$155,000 Active
-
2014-08-12soldstatus $112,900 646-char remark
Show marketing remark (646 chars)
Maintenance Free Colonial Condo! Nice and cozy dinette. Formal dining room Sliders to rear deck with view of pond and wooded area. Kitchen with eating area. Master bedroom with vaulted ceiling and bathroom. Full bathroom upstairs. Great location! Close to highways and local shopping, movie theaters and restaurants. You'll love the location! This property is eligible under the Freddie Mac First Look Initiative through 2/18/2014. Listed and Sold with repairs condition. Homestead/Property assessments are unknown. Attachments, Proof of Buyers Funds, Certified Earnest Money Check made payable to Listing Company to be with ALL offers submitted.
-
2014-06-26historical 646-char remark
Show marketing remark (646 chars)
Maintenance Free Colonial Condo! Nice and cozy dinette. Formal dining room Sliders to rear deck with view of pond and wooded area. Kitchen with eating area. Master bedroom with vaulted ceiling and bathroom. Full bathroom upstairs. Great location! Close to highways and local shopping, movie theaters and restaurants. You'll love the location! This property is eligible under the Freddie Mac First Look Initiative through 2/18/2014. Listed and Sold with repairs condition. Homestead/Property assessments are unknown. Attachments, Proof of Buyers Funds, Certified Earnest Money Check made payable to Listing Company to be with ALL offers submitted.
-
2014-01-29$112,900 646-char remark
Show marketing remark (646 chars)
Maintenance Free Colonial Condo! Nice and cozy dinette. Formal dining room Sliders to rear deck with view of pond and wooded area. Kitchen with eating area. Master bedroom with vaulted ceiling and bathroom. Full bathroom upstairs. Great location! Close to highways and local shopping, movie theaters and restaurants. You'll love the location! This property is eligible under the Freddie Mac First Look Initiative through 2/18/2014. Listed and Sold with repairs condition. Homestead/Property assessments are unknown. Attachments, Proof of Buyers Funds, Certified Earnest Money Check made payable to Listing Company to be with ALL offers submitted.
-
2011-11-15historical
-
2010-11-15$139,900
-
2010-05-08historical
-
2009-05-10$169,900
-
2008-06-19historical
-
2007-06-18$169,900
-
2005-04-18soldstatus $174,000
-
2005-04-18soldstatus $174,000
-
2005-01-30$179,900
ⓘ Source: listings_history table (triggers on properties + properties_extension) + one-shot
backfill from property_details.listing_events for pre-trigger history.
Tax reassessment forecast OH · Partial reset (capped growth)
- Current annual tax
- $3,639 · $303/mo
- Projected year-2 tax
- $3,639 · $303/mo
- Expected delta
- $0/yr ($0/mo · 0.0%)
ⓘ Screening estimate from a state-policy table — verify with the county assessor before closing.
Climate risk First Street
- Flood 1/10 Low FEMA zone X (unshaded) · 0% chance over 30 yrs
- Wildfire 1/10 Low
- Heat 2/10 Low 7 d/yr ≥96°F today · 17 d/yr by 30 yrs out
- Wind 1/10 Low
- Air quality 2/10 Low 1 unhealthy d/yr today · 3 by 30 yrs out
Nearby sold comps map
Loading sold comps map…
Walkable amenities ~0.75 mi
Loading nearby amenities…
Taxation est. · year 1
- Rental income
- $49,668
- − Mortgage interest
- −$8,682
- − Property taxes
- −$3,639
- − Insurance
- −$775
- − Repairs & maintenance
- −$3,973
- − Management
- −$3,973
- − HOA
- −$3,576
- − Depreciation
- −$4,509
- Taxable income
- $20,540
- Est. tax owed @ 24.0%
- −$4,930
- After-tax cash flow
- $16,564/yr
For passive investors: Depreciation is non-cash, so a rental often shows a tax loss while cash-flowing — sheltering income. Rental losses are passive: they offset passive income freely, and up to $25,000/yr can offset ordinary (W-2) income if you actively participate and your MAGI is under $100k (phasing out to $0 by $150k); unused losses carry forward. On sale, claimed depreciation is recaptured at up to 25%, and gains may owe capital-gains tax (a 1031 exchange can defer both). Figures are a year-1 estimate at your 24.0% rate — not tax advice; consult a CPA.
Schools (NCES district)
- District
- Nordonia Hills City
- NCES district ID
- 3905004
- Math proficiency
- 72% ▼ -9.00%
- Reading proficiency
- 79% ▼ -3.00%
- Median HH income
- $74,658
- Composite
- 66.26/100
- National rank
- #428
- State rank
- #71 of 656 in OH
Livability — Macedonia
- Score
- 80/100
- State rank
- #117
- US rank
- #1729
Category grades
Schools grade is shown separately in the Schools card above.
Census & demographics
- Census place
- Macedonia, OH
- County
- Summit · 539,389 people
- City population
- 12,142
- Metro
- Akron, OH
- Population (ZIP)
- 12,142
- Household income
- $108,059
- Rent vs Own
- Severe rent burden
- 19.3
Population outlook (Summit County) Hauer SSP2
- Today (2025)
- 546,583 people
- By 2030
- 544,028 · -0.5%
- By 2040
- 531,363 · -2.8%
- By 2050
- 514,923 · -5.8%
- By 2075
- 481,765 · -11.9%
- By 2100
- 432,265 · -20.9%
Race, ethnicity, and origin ACS 2023
- Neighborhood character
- Predominantly White (77%)
- Race & ethnicity
- White 77% Black 12% Asian 7% Two or more races 4% Hispanic / Latino 2%
- Common ancestry
- Romanian 10% Scotch-Irish 1% Slovak 1%
- Foreign-born
- 6% · Vietnam, Canada
- Languages at home
- 93% English-only · Other Indo-European 3% Vietnamese 1% Arabic 1%
Political lean MEDSL · Summit
- 2024 margin
- Lean D (+7.0) · D 53.0% · R 46.0%
- 2008→2024 swing
- -9.6pp toward R · 2008: 16.6pp · 2024: 7.0pp
- All cycles
- 2024: D+7.0 2020: D+9.6 2016: D+8.2 2012: D+14.8 2008: D+16.6
Not yet ingested
- Civics
- —
Market trends
- HPI YoY
- ▼ -117.35%
- Current HPI
- 199.0231
- Rent YoY
- —
- Metro
- —
- State GDP YoY
- ▲ 1.98%
- F500 in state
- 48
Industry mix (Fortune 500 HQ in OH)
| Industry | F500 HQs | Revenue |
|---|---|---|
| Insurance | 3 | $145B |
|
||
| Industrial Machinery | 3 | $49B |
|
||
| Financial Services | 3 | $24B |
|
||
| Consumer Goods | 2 | $93B |
|
||
| Aerospace / Defense | 2 | $47B |
|
||
| Utilities | 2 | $33B |
|
||
Price history
-13.8% since first listed14 events — show timeline
- 2026-05-03 Pending — MLSNOW
- 2026-05-02 Listed $155,000 MLSNOW
- 2014-08-12 Sold (MLS) $112,900 MLSNOW
- 2014-06-26 Listing Removed — MLSNOW
- 2014-01-29 Listed $112,900 MLSNOW
- 2011-11-15 Listing Removed — MLSNOW
- 2010-11-15 Listed $139,900 MLSNOW
- 2010-05-08 Listing Removed — MLSNOW
- 2009-05-10 Listed $169,900 MLSNOW
- 2008-06-19 Listing Removed — MLSNOW
- 2007-06-18 Listed $169,900 MLSNOW
- 2005-04-18 Sold (Public Records) $174,000 Public Records
- 2005-04-18 Sold (MLS) $174,000 MLSNOW
- 2005-01-30 Listed $179,900 MLSNOW
Property tax history
-2.2%/yrLatest (2025): $3,639 · +11.7% YoY. Source: county tax records.
Cash-flow waterfall
monthlySold comps — $/sqft
last 12 mo · ≤1 miLoading sold comps…