 Triplex
12029 Washington Pl · Los Angeles, CA
Flood risk 6/10 · Moderate
- FEMA flood zone
- X (unshaded)
- Chance of flooding over 30 yrs
- 0.94%
- Est. flood insurance / yr
- $507 – $1,088
Fire risk 1/10 · Minimal
- Est. fire insurance / yr
- $659 – $1,223
Heat risk 5/10 · Moderate
- Hot days now (above 85°F)
- 7 days/yr
- Hot days in 30 yrs
- 20 days/yr
Wind risk 1/10 · Minimal
- Chance of severe wind over 30 yrs
- —
Air-quality risk 4/10 · Minor
- Unhealthy air days now
- 6 days/yr
- Unhealthy air days in 30 yrs
- 7 days/yr
Risk factors via First Street. Map © Google.
Why this score? — see what drove the D- grade
The composite is a weighted blend of 9 inputs, each scored 0–100. Each bar is that input's sub-score; the figure is the points it added to the 100-point composite (weight × sub-score).
- ARV discount +15.0/15.0
- Cash flow +7.4/30.0
- Schools +3.6/10.0
- Livability +3.4/5.0
- Rent growth +2.5/5.0
- Condition / age +2.5/5.0
- DSCR +1.5/10.0
- 1% rule +1.3/10.0
- Appreciation +0.0/10.0
$1,250,000
🖨 Deal sheet (PDF) 📄 Offer letter ✓ Due diligence
Multi-family units
County records classify this as Multi-Family (2-4 Unit). Listing-text estimate: 3 units. confirmed
Listing remarks
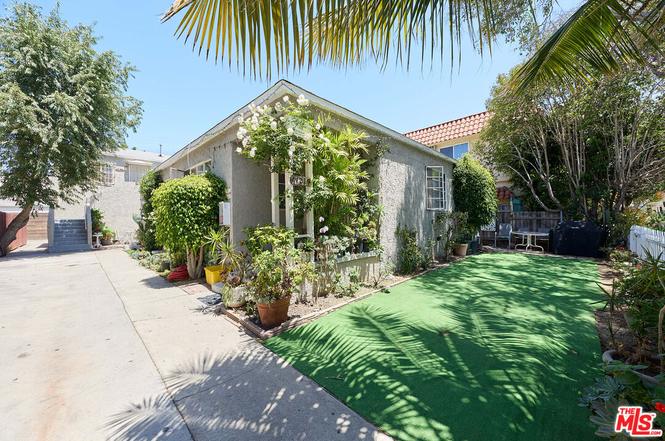
Framed by a charming white picket fence and mature palms, this bright Mar Vista triplex presents a premier Westside investment opportunity with substantial value-add potential. The property features an ideal unit mix consisting of one 2-bedroom home and two 1-bedroom units, complemented by an attached garage generating additional income. Fully occupied and professionally managed, the property offers immediate, stable cash flow with exceptional long-term upside. Current rents sit approximately one-third below market value, representing a projected 52% increase in rental income upon unit turnover. Major capital improvements have already been addressed, including a brand-new main sewer line co
Key facts
- Attached garage
- White picket fence
- Mature palms
Tags
Property features AI
Finance
- Other: Listed as rent controlled; Offered in as-is condition
- Financial info: Gross income: $61,410; Gross operating income: $63,458; Net operating income: $50,288; Total annual expenses: $13,170; Cap rate: 4.02%; Gross rent multiplier: 20.4; Vacancy rate reported as 0%; Rents by unit (actual): Unit 1 $1,625; Unit 2 $2,351; Unit 3 $1,225; Projected rents: Unit 1 $3,000; Unit 2 $2,400; Unit 3 $2,400
- HOA & community: Complex contains 3 units
Exterior
- Parking: Assigned attached garage; 3 covered parking spaces (total 3 parking spaces)
- Home design: Residential income property (triplex); One building containing 3 units; Mixed split-level and single-level configuration; Faces south
- Exterior features: No additional structures; Zoned LAR3
Interior
- Kitchen: Dishwasher
- Bedrooms: Unit 1: 2 bedrooms; Unit 2: 1 bedroom; Unit 3: 1 bedroom
- Bathrooms: Unit 1: 1 bath; Unit 2: 1 bath; Unit 3: 1 bath
- Heating & cooling: Solar heating; Other heating (unspecified); No central cooling
- Interior features: Attached common walls (multi-unit); Property faces south; Split level and one-level layouts present
Neighborhood map
What this means for you Summary
Snapshot
- This is a 1×2bd/1.0ba + 2×1bd/1.0ba units multifamily listed at $1.25M.
Deal economics
- At list price, monthly cash flow is $-2k ($-19k/yr) — negative. Per door: $-537/mo.
- To cash-flow at today's rent, offer at most $965k (22.8% below list).
- To meet the 1% rule (rent ≥ 1% of price), the offer needs to be $786k (37.1% below list).
- Recommended offer: $786k (37.1% below list) — sets the bar for 1% rule.
- Cap rate 4.7% vs local median 2.1% in Los Angeles — top-decile yield for the area; either an underpriced asset or a hidden risk that comps aren't pricing in. Stress-test before assuming the spread holds.
Location & tenants
- Location reads 68/100 on livability (#273 in CA) — a middle-class / working-renter tenant base. Strengths: amenities A+, commute A+, employment B; Watch: health & safety C-, crime F, cost of living F.
- Los Angeles Unified (urban): math 29% / reading 54% proficiency, ranked #223 of 517 in CA (top 43%) — families likely to look elsewhere, expect single-tenant / working-renter base with shorter leases; 67% free/reduced lunch — lower-income household profile, screen leases tightly.
- Zoned schools: Grand View Boulevard Elementary (541 students, 60% FRL); Marina Del Rey Middle (412 students, 91% FRL); Venice Senior High (math 33% / reading 64%, grade D, #373 of 1,170 statewide, top 32%, 2,107 students, 69% FRL).
- Market conditions: Rents soft (-0.1%/yr); 158 active listings in the ZIP; 38 comparable units currently listed for rent nearby; rentals at typical pace (median 27d on market — plan ~3-4 weeks tenant-placement turnaround); 45% of comp listings sitting > 30 days — soft ceiling on asking rent; high-income renter base; 19,697 units permitted in Los Angeles County in 2024 (9,426 in 5+ unit buildings).
- At $7,860/mo this rent would consume 83% of the median local household income ($114k/yr) (locally 3174% of renters already pay >50% of income on rent) — very limited rent-growth headroom before tenants either downsize or default.
Forward outlook
- Local home prices are declining (-3.0%/yr); year-one equity from $9k of loan paydown is wiped out by about $38k of value loss. Plan a longer hold.
- Los Angeles County population projected at +9% by 2050 — modest demand growth; plan on rents tracking national, not racing it.
Negotiation context
- Only 4 days on market — expect competitive offers; lowballing is unlikely to land.
- 19 sale attempts since 23y ago with the ask held roughly flat each time — persistent listings suggest the price (not the market) is what's stuck; bring a comps-based counter.
- Current owner paid $500k; list at $1.25M implies a 150% gain — meaningful room to come down on a strong offer.
Risks & watch-outs
- Watch-outs: built in 1950 — expect roof / HVAC / electrical / plumbing capex.
- Climate carrying-cost: major flood risk; extreme-heat days projected 7→20/yr by 2055 (HVAC capex compounding) — expect insurance premiums to compound above CPI over the hold.
Questions for the listing agent
- What do current leases actually rent for vs. the listed asking? Can we see a recent rent roll and the last 12 months of T-12 income?
- Can we see the unit-by-unit rent roll, current vacancy, and any below-market leases? What's the average tenancy length?
- What capital expenditures (roof, boiler, parking lot, exteriors) have been made in the last 5 years, and what's planned in the next 2?
- Built in 1950 — when were the roof, HVAC, electrical panel, plumbing, and water heater last replaced?
- Is there a deadline driving the sale (1031 exchange, divorce, estate, relocation)? That informs how much negotiation room exists.
- Schools are D-rated, which usually means shorter tenancies and higher turnover. Who's the typical renter profile here, and what's been the actual vacancy rate?
- Crime grade is F in this area — have there been break-ins, vandalism, or insurance claims at this property in the last 3 years? What carrier currently insures it and at what premium?
- The area grade is low — what's the realistic commute time and amenity access for the typical tenant pool here? Any planned neighborhood developments (good or bad) we should know about?
- What's the average days-on-market for RENTAL listings here right now (not sales)? A rising rental-DOM trend means longer vacancies and softer asking-rent achievability than the comps imply.
- What's the recent tenant-quality profile in this submarket — average credit score on applications, eviction rate, late-payment / NSF rate, and stable-employment percentage? A property-management company in the area should have these aggregated.
- How much new apartment / multifamily construction is in the pipeline within 1–3 miles? Heavy new supply (>2% of stock underway) typically softens rents 12–24 months out; light construction supports rent growth.
Investment metrics
- 1% rule
- 0.63% ✗
- Cap rate
- 4.75%
- Cash-on-cash
- -5.53%
- DSCR
- 0.75
- GRM
- 13.3
CMA / ARV
- ARV (on-the-fly)
- $1,922,528
- Comps found
- 1
Show comp detail 1 sale within ~0.75 mi
| Address | Dist | Beds/Ba | Sqft | Sold | Price | $/sf | Match |
|---|---|---|---|---|---|---|---|
| 4038 Rosabell St | 0.67mi | 5/4.0 (+1) | 2,460 (+5%) | 19mo | $2,025,000 | $823 | 35 |
Match score weights: distance 35% · size 25% · config 20% · recency 20%. Top-matched comps best support the ARV.
Projected returns pro-forma
-3.0% appreciation · 0.0% rent growth · sell at horizon
- IRR
- -28.8%
- Equity multiple
- 0.06×
- Total profit
- $-328,619
- Equity at exit
- $186,379
- IRR
- -43.5%
- Equity multiple
- -0.45×
- Total profit
- $-508,909
- Equity at exit
- $108,077
Cash invested: $350,000 (down + closing). Projections, not guarantees.
Landlord ↔ Tenant lean methodology
- Overall (CITY)
- 0 Strongly Tenant-Friendly
- State California
- 18 Strongly Tenant-Friendly · D+13
- County
- — inherits STATE
- City Los Angeles
- 0 Strongly Tenant-Friendly · D+22
ZIP-level market 90066
- Rents YoY
- -0.1%
- Active inventory
- 158
- Price-to-rent
- 38.4×
Monthly cashflow live
- Estimated rent
- $7,860 high interval (Pro) →
- Mortgage (P&I)
- −$6,555
- Tax from tax record
- −$745 /mo · $8,941/yr
- Insurance
- −$521
- HOA
- −$0
- Vacancy / Maint / Mgmt
- −$1,651
- Net cashflow
- $-1,612
Break-even live
Sensitivity live
| Price | -10% $-904 | -5% $-1,258 | +0% $-1,612 | +5% $-1,965 | +10% $-2,319 |
|---|---|---|---|---|---|
| Rent | -10% $-2,233 | -5% $-1,922 | +0% $-1,612 | +5% $-1,301 | +10% $-991 |
| Rate | -1.0pp $-982 | -0.5pp $-1,294 | base $-1,612 | +0.5pp $-1,936 | +1.0pp $-2,265 |
3-unit breakdown (identical units grouped — click to expand)
| Units | Beds | Baths | Est. rent |
|---|---|---|---|
| 1× unit | 2 | 1 | $2,712 |
| 2× units | 1 | 1 | $5,148 |
| #2 | 1 | 1 | $2,574 |
| #3 | 1 | 1 | $2,574 |
| Total (3 units) | $7,860 | ||
UW: 25.0% down · 7.5% · 30yr · 1.5% tax · 5.0% vac · 8.0% maint · 8.0% mgmt
Financing live
Cash to close
- Down payment
- $312,500
- Closing costs
- $37,500
- Reserves months
- —
- Total cash needed
- —
Loan-product check · same deal, 3 products live
Conventional
25% down · 7.5% · 30yr
- Down + closing
- —
- Monthly P&I
- —
- Monthly cashflow
- —
- DSCR
- —
- Eligible?
- —
Personal DTI + credit; lowest rate.
DSCR
20% down · 8.5% · 30yr
- Down + closing
- —
- Monthly P&I
- —
- Monthly cashflow
- —
- DSCR
- —
- Eligible?
- —
No personal income docs; deal must DSCR.
Hard money
10% down · 12.0% · 12mo
- Down + closing
- —
- Monthly P&I
- —
- Monthly cashflow
- —
- DSCR
- —
- Eligible?
- —
Short-term bridge; refi at stabilization.
Rent comps 38 comps
| Address | Beds | Baths | Sqft | Rent | $/sqft | DOM | Units | Dist |
|---|---|---|---|---|---|---|---|---|
| 11924 W Washington Blvd Los Angeles, CA | 3.0 | 1.0–2.0 | 1127 | $6,504 | $5.77 | 1d | 6 | 0.47mi |
| 12600 Mitchell Ave Los Angeles, CA | 3.0 | 2.0 | 1656 | $9,750 | $5.89 | 45d | 1 | 0.49mi |
| 3932 Minerva Ave Los Angeles, CA | 4.0 | 4.0 | 2193 | $10,000 | $4.56 | 5d | 1 | 0.55mi |
| 3932 Minerva Ave Los Angeles, CA | 4.0 | 4.0 | 2193 | $12,500 | $5.70 | 26d | 1 | 0.55mi |
| 12706 Pacific Ave Los Angeles, CA | 3.0 | 3.5 | 2098 | $8,500 | $4.05 | 45d | 1 | 0.61mi |
| 3783 Stewart Ave Los Angeles, CA | 3.0 | 2.0 | 2174 | $11,000 | $5.06 | 45d | 1 | 0.63mi |
| 4118 Wade St Los Angeles, CA | 3.0 | 3.5 | 2271 | $11,995 | $5.28 | 45d | 1 | 0.64mi |
| 4041 Sawtelle Blvd Unit C Los Angeles, CA | 3.0 | 3.0 | 1718 | $6,800 | $3.96 | 45d | 1 | 0.68mi |
| 12111 Wagner St Culver City, CA | 4.0 | 3.0 | 2225 | $6,900 | $3.10 | 9d | 1 | 0.83mi |
| 12111 Wagner St Culver City, CA | 4.0 | 3.0 | 2225 | $6,900 | $3.10 | 45d | 1 | 0.83mi |
| 4455 S Slauson Ave Culver City, CA | 4.0 | 5.0 | 1800 | $5,363 | $2.98 | 7d | 1 | 0.83mi |
| 12106 Wagner St Culver City, CA | 5.0 | 3.0 | 2247 | $7,100 | $3.16 | 26d | 1 | 0.83mi |
| 3655 May St Los Angeles, CA | 4.0 | 3.0 | 2496 | $11,500 | $4.61 | 5d | 1 | 0.85mi |
| 4720 Marshall Dr Culver City, CA | 3.0 | 3.0 | 1700 | $8,995 | $5.29 | 1d | 1 | 0.91mi |
| 4720 Marshall Dr Culver City, CA | 3.0 | 3.0 | 1592 | $8,995 | $5.65 | 45d | 1 | 0.91mi |
| 3846 Bentley Ave Unit 2 Culver City, CA | 3.0 | 2.5 | 1982 | $7,250 | $3.66 | 45d | 1 | 1.03mi |
| 3846 Bentley Ave Unit 4 Culver City, CA | 3.0 | 2.5 | 1900 | $7,499 | $3.95 | 45d | 1 | 1.03mi |
| 3838 Tilden Ave Culver City, CA | 3.0 | 3.5 | 2590 | $6,495 | $2.51 | 26d | 1 | 1.09mi |
| 4711 Purdue Ave Culver City, CA | 5.0 | 3.0 | 2300 | $7,300 | $3.17 | 17d | 1 | 1.10mi |
| 4922 S Centinela Ave Unit 3 Los Angeles, CA | 3.0 | 3.5 | 1700 | $5,099 | $3.00 | 45d | 1 | 1.12mi |
| 3533 Tuller Ave Los Angeles, CA | 4.0 | 3.0 | 2638 | $6,700 | $2.54 | 9d | 1 | 1.13mi |
| 4905 Coolidge Ave Culver City, CA | 4.0 | 2.0 | 1862 | $5,495 | $2.95 | 26d | 1 | 1.16mi |
| 4905 Coolidge Ave Culver City, CA | 4.0 | 2.0 | 1862 | $5,995 | $3.22 | 45d | 1 | 1.16mi |
| 11033 Barman Ave Culver City, CA | 4.0 | 3.0 | 2300 | $6,700 | $2.91 | 23d | 1 | 1.27mi |
| 10963 Lindblade St Culver City, CA | 3.0 | 2.0 | 1600 | $7,900 | $4.94 | 1d | 1 | 1.29mi |
| 12668 Rose Ave Los Angeles, CA | 4.0 | 3.0 | 2535 | $14,875 | $5.87 | 4d | 1 | 1.31mi |
| 3808 College Ave #1 Culver City, CA | 3.0 | 3.5 | 2250 | $8,995 | $4.00 | 45d | 1 | 1.31mi |
| 49381 McConnell Ave Los Angeles, CA | 3.0 | 2.5 | 1858 | $6,200 | $3.34 | 45d | 1 | 1.33mi |
| 13461 Beach Ave Unit C Marina Del Rey, CA | 5.0 | 5.5 | 2168 | $6,275 | $2.89 | 45d | 1 | 1.34mi |
| 13461 Beach Ave Unit 134635 Marina Del Rey, CA | 5.0 | 5.5 | 2168 | $6,275 | $2.89 | 20d | 1 | 1.34mi |
| 13463 Beach Ave Unit 13463 Marina Del Rey, CA | 4.0 | 4.5 | 1672 | $5,868 | $3.51 | 45d | 1 | 1.34mi |
| 13488 Maxella Ave Marina del Rey, CA | 3.0 | 1.0–2.0 | 1175 | $6,608 | $5.62 | 1d | 12 | 1.39mi |
| 2440 Penmar Ave Unit 2 Venice, CA | 3.0 | 2.5 | 2000 | $4,500 | $2.25 | 45d | 1 | 1.43mi |
| 2432 Penmar Ave #201 Venice, CA | 4.0 | 3.5 | 3000 | $10,994 | $3.66 | 26d | 1 | 1.43mi |
| 2432 Penmar Ave Venice, CA | 4.0 | 4.0 | 3000 | $10,474 | $3.49 | 20d | 1 | 1.43mi |
| 2435 Penmar Ave Venice, CA | 4.0 | 4.5 | 2672 | $15,000 | $5.61 | 5d | 1 | 1.46mi |
| 2306 Penmar Ave Venice, CA | 4.0 | 4.0 | 2032 | $10,800 | $5.31 | 24d | 1 | 1.48mi |
| 10767 Oregon Ave Culver City, CA | 4.0 | 3.0 | 3152 | $9,250 | $2.93 | 45d | 1 | 1.49mi |
Listing history 3 events
-
2026-06-21days on market $1,250,000 Active 4 DOM
-
2026-06-18remarks 699-char remark
-
2026-06-18$1,250,000 Active 1 DOM
ⓘ Source: listings_history table (triggers on properties + properties_extension) + one-shot
backfill from property_details.listing_events for pre-trigger history.
Tax reassessment forecast CA · Resets to sale price
- Current annual tax
- $8,941 · $745/mo
- Projected year-2 tax
- $9,500 · $792/mo
- Expected delta
- +$559/yr (+$47/mo · 6.3%)
ⓘ Screening estimate from a state-policy table — verify with the county assessor before closing.
Climate risk First Street
- Flood 6/10 Major FEMA zone X (unshaded) · 94% chance over 30 yrs
- Wildfire 1/10 Low
- Heat 5/10 Major 7 d/yr ≥85°F today · 20 d/yr by 30 yrs out
- Wind 1/10 Low
- Air quality 4/10 Moderate 6 unhealthy d/yr today · 7 by 30 yrs out
Nearby sold comps map
Loading sold comps map…
Walkable amenities ~0.75 mi
Loading nearby amenities…
Taxation est. · year 1
- Rental income
- $94,320
- − Mortgage interest
- −$70,019
- − Property taxes
- −$8,941
- − Insurance
- −$6,250
- − Repairs & maintenance
- −$7,546
- − Management
- −$7,546
- − Depreciation
- −$36,364
- Taxable loss
- −$42,345
- Est. tax savings @ 24.0%
- +$10,163
- After-tax cash flow
- $-9,177/yr
For passive investors: Depreciation is non-cash, so a rental often shows a tax loss while cash-flowing — sheltering income. Rental losses are passive: they offset passive income freely, and up to $25,000/yr can offset ordinary (W-2) income if you actively participate and your MAGI is under $100k (phasing out to $0 by $150k); unused losses carry forward. On sale, claimed depreciation is recaptured at up to 25%, and gains may owe capital-gains tax (a 1031 exchange can defer both). Figures are a year-1 estimate at your 24.0% rate — not tax advice; consult a CPA.
Schools (NCES district)
- District
- Los Angeles Unified
- NCES district ID
- 0622710
- Math proficiency
- 29% ▼ -4.00%
- Reading proficiency
- 54% ▲ 10.00%
- Median HH income
- $50,403
- Composite
- 35.67/100
- National rank
- #4875
- State rank
- #223 of 517 in CA
Livability — Los Angeles
- Score
- 68/100
- State rank
- #273
- US rank
- #9237
Category grades
Schools grade is shown separately in the Schools card above.
Census & demographics
- Census place
- Los Angeles, CA
- County
- Los Angeles County · 9,444,647 people
- City population
- 3,838,149
- Metro
- Los Angeles-Long Beach-Anaheim, CA
- Population (ZIP)
- 56,740
- Household income
- $114,141
- Rent vs Own
- Severe rent burden
- 3174.0
Population outlook (Los Angeles County) Hauer SSP2
- Today (2025)
- 10,940,515 people
- By 2030
- 11,256,481 · +2.9%
- By 2040
- 11,729,929 · +7.2%
- By 2050
- 11,948,407 · +9.2%
- By 2075
- 11,818,114 · +8.0%
- By 2100
- 10,842,928 · -0.9%
Race, ethnicity, and origin ACS 2023
- Neighborhood character
- Diverse neighborhood (Simpson 0.68)
- Race & ethnicity
- White 48% Hispanic / Latino 25% Asian 16% Two or more races 13% Black 5%
- Hispanic origin (detail)
- Mexican 18%
- Common ancestry
- Italian 3% Romanian 3% Scotch-Irish 2%
- Foreign-born
- 25% · Canada, China, South Korea
- Languages at home
- 63% English-only · Spanish 19% Other Indo-European 4% Chinese 4%
Political lean MEDSL · Los Angeles
- 2024 margin
- Solid D (+32.9) · D 64.8% · R 31.9% · Other 3.3%
- 2008→2024 swing
- -7.4pp toward R · 2008: 40.4pp · 2024: 32.9pp
- All cycles
- 2024: D+32.9 2020: D+44.2 2016: D+48.0 2012: D+40.0 2008: D+40.4
Not yet ingested
- Civics
- —
Market trends
- HPI YoY
- ▼ -1200.36%
- Current HPI
- 466.5309
- Rent YoY
- ▼ -0.08%
- Metro
- Los Angeles-Long Beach-Anaheim, CA
- State GDP YoY
- ▲ 3.21%
- F500 in state
- 116
Industry mix (Fortune 500 HQ in CA)
| Industry | F500 HQs | Revenue |
|---|---|---|
| Technology | 27 | $1,492B |
|
||
| Financial Services | 3 | $174B |
|
||
| Retail | 3 | $44B |
|
||
| Insurance | 3 | $26B |
|
||
| Media / Entertainment | 2 | $115B |
|
||
| Pharmaceuticals / Biotech | 2 | $62B |
|
||
Price history
+290.6% since first listed42 events — show timeline
- 2026-06-17 Listed $1,250,000 TheMLS
- 2023-10-23 Rental Removed $2,195 APPFOLIO
- 2023-09-21 Price Changed $2,195 APPFOLIO
- 2023-09-13 Price Changed $2,395 APPFOLIO
- 2023-09-10 Listed for Rent $2,095 APPFOLIO
- 2021-07-20 Listed — TheMLS
- 2021-04-21 Listed — TheMLS
- 2020-07-29 Listed — TheMLS
- 2019-05-27 Listing Removed — CRMLS
- 2019-05-27 Listing Removed — SDMLS
- 2019-01-26 Price Changed $1,300,000 CRMLS
- 2018-12-27 Listed $1,400,000 CRMLS
- 2018-12-27 Listed $1,300,000 SDMLS
- 2018-12-05 Listing Removed — SDMLS
- 2018-12-05 Delisted — TheMLS
- 2018-11-14 Relisted — TheMLS
- 2018-11-13 Delisted — TheMLS
- 2018-10-05 Price Changed — TheMLS
- 2018-09-27 Listed $1,480,000 SDMLS
- 2018-09-27 Listed — TheMLS
- 2018-09-11 Listing Removed — SDMLS
- 2018-09-11 Delisted — TheMLS
- 2018-08-23 Price Changed — TheMLS
- 2018-08-14 Listed $1,560,000 SDMLS
- 2018-08-14 Listed — TheMLS
- 2016-03-08 Listing Removed — SDMLS
- 2016-03-08 Delisted — TheMLS
- 2015-10-21 Listed — TheMLS
- 2015-10-21 Listed $1,100,000 SDMLS
- 2015-10-20 Listing Removed — SDMLS
- 2015-10-20 Delisted — TheMLS
- 2015-06-08 Listed — TheMLS
- 2015-05-25 Listed $1,100,000 SDMLS
- 2007-12-22 Delisted — TheMLS
- 2007-12-22 Listing Removed — CRMLS
- 2007-07-26 Listed $959,000 CRMLS
- 2007-06-22 Listed — TheMLS
- 2003-10-24 Sold (MLS) $500,000 TheMLS
- 2003-10-20 Sold (Public Records) $500,000 Public Records
- 2003-08-06 Delisted — TheMLS
- 2003-07-12 Listed $499,000 TheMLS
- 1988-12-28 Sold (Public Records) $320,000 Public Records
Property tax history
+1.6%/yrLatest (2025): $8,941 · +1.4% YoY. Source: county tax records.
Cash-flow waterfall
monthlySold comps — $/sqft
last 12 mo · ≤1 miLoading sold comps…