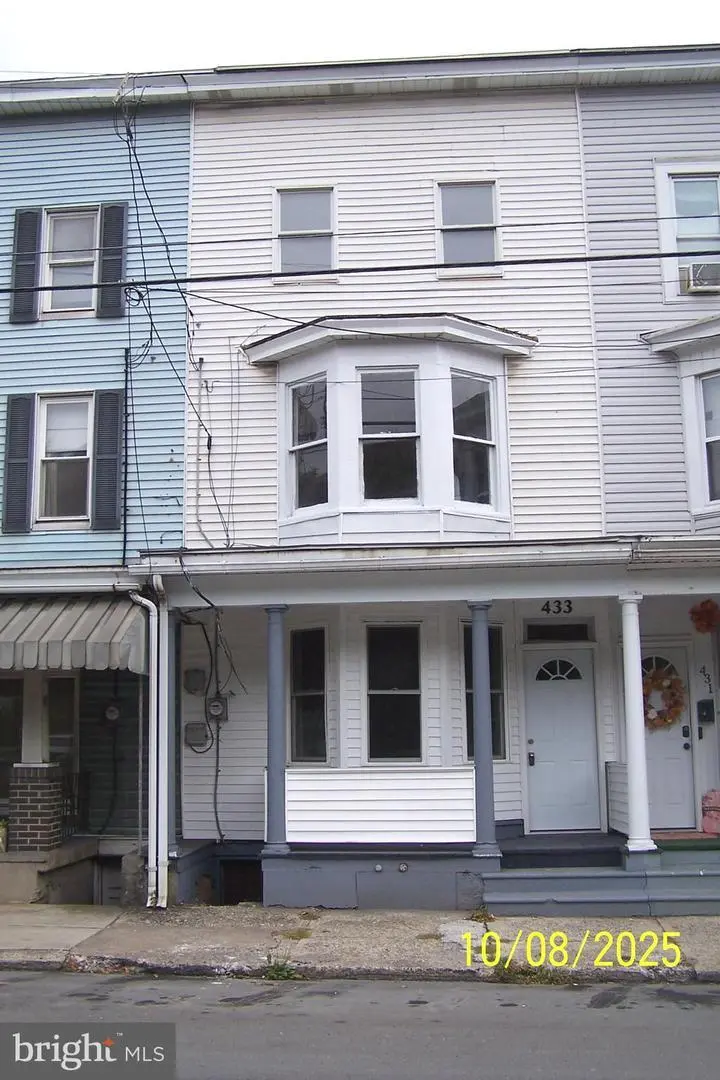
433 N Railroad St · Tamaqua, PA
Flood risk 6/10 · Moderate
- FEMA flood zone
- X (unshaded)
- Chance of flooding over 30 yrs
- 0.72%
- Est. flood insurance / yr
- $473 – $860
Fire risk 3/10 · Minor
- Est. fire insurance / yr
- $511 – $949
Heat risk 4/10 · Minor
- Hot days now (above 95°F)
- 8 days/yr
- Hot days in 30 yrs
- 17 days/yr
Wind risk 4/10 · Minor
- Chance of severe wind over 30 yrs
- 9.0%
Air-quality risk 2/10 · Minimal
- Unhealthy air days now
- 1 days/yr
- Unhealthy air days in 30 yrs
- 2 days/yr
Risk factors via First Street. Map © Google.
Why this score? — see what drove the D- grade
The composite is a weighted blend of 9 inputs, each scored 0–100. Each bar is that input's sub-score; the figure is the points it added to the 100-point composite (weight × sub-score).
- Cash flow +16.5/30.0
- DSCR +5.1/10.0
- Livability +4.0/5.0
- 1% rule +3.9/10.0
- Schools +3.6/10.0
- Rent growth +2.5/5.0
- Condition / age +2.5/5.0
- ARV discount +0.0/15.0
- Appreciation +0.0/10.0
$149,900
🖨 Deal sheet 📄 Offer letter ✓ Due diligence
Listing remarks MLS
Tamaqua 4 BR home with additional finished unheated room that could be 5th bedroom, office, or large walk in closet. .. you decide! Home was done from top to bottom freshly painted, plank laminate floors, & newer windows. First level laundry with washer & dryer & kitchen has stainless steel glass top range, refrigerator, microwave & dishwasher. Fenced yard and carpeted front & rear porches. OHW heat , 100 AMP service. Close to downtown, playgrounds, Community Art Center. Ask about free college for Tamaqua graduates at LCCC.
Key facts
- Fenced yard
- First level laundry
- Built 1915
Tags
Neighborhood map
What this means for you Summary
Snapshot
- This is a 4-bed/1.0-bath single-family listed at $150k.
Deal economics
- At list price, monthly cash flow is $87 ($1k/yr) — positive.
- The deal already cash-flows at list — no discount required.
- To meet the 1% rule (rent ≥ 1% of price), the offer needs to be $133k (11.0% below list).
- Recommended offer: $132k (12.0% below list) — sets the bar for market timing.
Location & tenants
- Location reads 80/100 on livability (#209 in PA, #1,844 nationally) — a professional / high-income tenant draw. Strengths: amenities A+, cost of living A+, housing A+; Watch: commute D+, employment F.
- Tamaqua Area SD (rural): math 31% / reading 53% proficiency, ranked #331 of 539 in PA (top 61%) — families likely to look elsewhere, expect single-tenant / working-renter base with shorter leases.
- Market conditions: 75 active listings in the ZIP; 5 comparable units currently listed for rent nearby; rentals at typical pace (median 23d on market — plan ~3-4 weeks tenant-placement turnaround); 40% of comp listings sitting > 30 days — soft ceiling on asking rent; 169 units permitted in Schuylkill County in 2024 (0 in 5+ unit buildings).
Forward outlook
- Local home prices are declining (-3.0%/yr); year-one equity from $1k of loan paydown is wiped out by about $4k of value loss. Plan a longer hold.
- Schuylkill County population projected at -16% by 2050 — secular population decline; favor cash flow + early exit over multi-decade hold.
Negotiation context
- It's been on market 231 days — a 12% lower offer ($132k) is reasonable based on typical stale-listing flexibility.
- 3 sale attempts; this cycle's ask has dropped $10k (6%) from the opening price — seller is motivated, your offer sets the floor, not the list.
- Current owner paid $15k; list at $150k implies a 899% gain — meaningful room to come down on a strong offer.
Risks & watch-outs
- Watch-outs: built in 1915 — expect roof / HVAC / electrical / plumbing capex.
- Climate carrying-cost: major flood risk — expect insurance premiums to compound above CPI over the hold.
Questions for the listing agent
- It's been on market 231 days. Have you received any prior offers? Is the seller open to a 12% concession, seller financing, or rate buy-down credit?
- Built in 1915 — when were the roof, HVAC, electrical panel, plumbing, and water heater last replaced?
- Why hasn't it sold? Are there any deal-killer items the seller is aware of (foundation, flood, title, zoning, code violations)?
- Is there a deadline driving the sale (1031 exchange, divorce, estate, relocation)? That informs how much negotiation room exists.
- The area grade is low — what's the realistic commute time and amenity access for the typical tenant pool here? Any planned neighborhood developments (good or bad) we should know about?
- What's the average days-on-market for RENTAL listings here right now (not sales)? A rising rental-DOM trend means longer vacancies and softer asking-rent achievability than the comps imply.
- What's the recent tenant-quality profile in this submarket — average credit score on applications, eviction rate, late-payment / NSF rate, and stable-employment percentage? A property-management company in the area should have these aggregated.
- How much new for-sale + rental construction is in the pipeline within 1–3 miles? Heavy new supply typically softens prices + rents 12–24 months out; constrained supply supports both.
Investment metrics
- 1% rule
- 0.89% ✗
- Cap rate
- 6.99%
- Cash-on-cash
- 2.49%
- DSCR
- 1.11
- GRM
- 9.4
CMA / ARV
- ARV (median comp)
- $101,446
- List price
- $149,900
- Delta
- 47.76%
- Verdict
- OVERPRICED
- Comps
- 20 within 1.0 mi
Show comp detail 12 sales within ~0.75 mi
| Address | Dist | Beds/Ba | Sqft | Sold | Price | $/sf | Match |
|---|---|---|---|---|---|---|---|
| 500 Pine St | 0.06mi | 4/2.5 | 1,935 (+12%) | 2mo | $213,000 | $110 | 70 |
| 101 Clay St | 0.25mi | 4/2.0 | 1,652 (-5%) | 9mo | $215,000 | $130 | 69 |
| 514 W Washington St | 0.08mi | 3/1.0 (-1) | 1,530 (-12%) | 3mo | $240,000 | $157 | 69 |
| 238 Brown St | 0.32mi | 4/1.0 | 1,502 (-13%) | 3mo | $108,000 | $72 | 60 |
| 259 Clay St | 0.37mi | 3/1.0 (-1) | 1,850 (+7%) | 8mo | $65,000 | $35 | 60 |
| 110 N Lehigh St | 0.53mi | 3/1.5 (-1) | 1,680 (-3%) | 7mo | $107,500 | $64 | 57 |
| 104 Gay St | 0.46mi | 5/1.0 (+1) | 1,656 (-4%) | 13mo | $55,000 | $33 | 55 |
| 233 N Lehigh St | 0.46mi | 4/1.5 | 1,580 (-9%) | 13mo | $155,000 | $98 | 51 |
| 238 W Rowe St | 0.42mi | 4/1.5 | 1,482 (-14%) | 4mo | $67,500 | $46 | 50 |
| 242 N Lehigh St | 0.48mi | 3/1.5 (-1) | 1,584 (-9%) | 9mo | $220,000 | $139 | 48 |
| 63 S Nescopec St | 0.52mi | 5/1.0 (+1) | 1,898 (+10%) | 12mo | $150,000 | $79 | 45 |
| 444 Hazle St | 0.63mi | 3/1.5 (-1) | 1,952 (+13%) | 12mo | $228,900 | $117 | 33 |
Match score weights: distance 35% · size 25% · config 20% · recency 20%. Top-matched comps best support the ARV.
Projected returns pro-forma
-3.0% appreciation · 3.0% rent growth · sell at horizon
- IRR
- -12.4%
- Equity multiple
- 0.55×
- Total profit
- $-18,765
- Equity at exit
- $22,351
- IRR
- -3.3%
- Equity multiple
- 0.78×
- Total profit
- $-9,287
- Equity at exit
- $12,961
Cash invested: $41,972 (down + closing). Projections, not guarantees.
Landlord ↔ Tenant lean methodology
- Overall (STATE)
- 62 Landlord-Friendly
- State Pennsylvania
- 62 Landlord-Friendly · EVEN
- County
- — inherits STATE
- City
- — inherits STATE
ZIP-level market 18252
- Home prices YoY
- -15.4%
- Active inventory
- 75
- Price-to-rent
- 9.4×
Monthly cashflow live
- Estimated rent
- $1,334 high interval (Pro) →
- Mortgage (P&I)
- −$786
- Tax from tax record
- −$119 /mo · $1,423/yr
- Insurance
- −$62
- HOA
- −$0
- Vacancy / Maint / Mgmt
- −$280
- Net cashflow
- $87
Break-even live
UW: 25.0% down · 7.5% · 30yr · 1.5% tax · 5.0% vac · 8.0% maint · 8.0% mgmt
Financing live
Cash to close
- Down payment
- $37,475
- Closing costs
- $4,497
- Reserves months
- —
- Total cash needed
- —
Loan-product check · same deal, 3 products live
Conventional
25% down · 7.5% · 30yr
- Down + closing
- —
- Monthly P&I
- —
- Monthly cashflow
- —
- DSCR
- —
- Eligible?
- —
Personal DTI + credit; lowest rate.
DSCR
20% down · 8.5% · 30yr
- Down + closing
- —
- Monthly P&I
- —
- Monthly cashflow
- —
- DSCR
- —
- Eligible?
- —
No personal income docs; deal must DSCR.
Hard money
10% down · 12.0% · 12mo
- Down + closing
- —
- Monthly P&I
- —
- Monthly cashflow
- —
- DSCR
- —
- Eligible?
- —
Short-term bridge; refi at stabilization.
Rent comps 5 comps
| Address | Beds | Baths | Sqft | Rent | $/sqft | DOM | Units | Dist |
|---|---|---|---|---|---|---|---|---|
| 223 Schuylkill Ave Tamaqua, PA | 3.0 | 1.0 | 1100 | $1,050 | $0.95 | 43d | 1 | 0.25mi |
| 201 Market St Tamaqua, PA | 5.0 | 1.0 | 1600 | $1,500 | $0.94 | 23d | 1 | 0.35mi |
| 234 Mauch Chunk St Unit 2 Tamaqua, PA | 3.0 | 1.0 | 1100 | $1,425 | $1.30 | 23d | 1 | 0.37mi |
| 128 E Broad St Unit 128B Tamaqua, PA | 3.0 | 1.0 | 1623 | $1,450 | $0.89 | 43d | 1 | 0.42mi |
| 435 E Union St Tamaqua, PA | 3.0 | 1.0 | 1560 | $1,275 | $0.82 | 14d | 1 | 0.44mi |
Listing history 9 events
-
2026-05-01historical
-
2026-02-20price $149,900 559-char remark
Show marketing remark (559 chars)
Tamaqua 4 BR home with additional finished unheated room that could be 5th bedroom, office, or large walk in closet. .. you decide! Home was done from top to bottom freshly painted, plank laminate floors, & newer windows. First level laundry with washer & dryer & kitchen has stainless steel glass top range, refrigerator, microwave & dishwasher. Fenced yard and carpeted front & rear porches. OHW heat , 100 AMP service. Close to downtown, playgrounds, Community Art Center. Ask about free college for Tamaqua graduates at LCCC.
-
2025-11-15historical
-
2025-11-10$159,900 Active
-
2025-10-25$159,900 Active
-
2025-10-20price $159,900 559-char remark
Show marketing remark (559 chars)
Tamaqua 4 BR home with additional finished unheated room that could be 5th bedroom, office, or large walk in closet. .. you decide! Home was done from top to bottom freshly painted, plank laminate floors, & newer windows. First level laundry with washer & dryer & kitchen has stainless steel glass top range, refrigerator, microwave & dishwasher. Fenced yard and carpeted front & rear porches. OHW heat , 100 AMP service. Close to downtown, playgrounds, Community Art Center. Ask about free college for Tamaqua graduates at LCCC.
-
2025-10-10$174,900 Active 559-char remark
Show marketing remark (559 chars)
Tamaqua 4 BR home with additional finished unheated room that could be 5th bedroom, office, or large walk in closet. .. you decide! Home was done from top to bottom freshly painted, plank laminate floors, & newer windows. First level laundry with washer & dryer & kitchen has stainless steel glass top range, refrigerator, microwave & dishwasher. Fenced yard and carpeted front & rear porches. OHW heat , 100 AMP service. Close to downtown, playgrounds, Community Art Center. Ask about free college for Tamaqua graduates at LCCC.
-
1991-04-04soldstatus $15,000
-
1990-12-28soldstatus $12,732
ⓘ Source: listings_history table (triggers on properties + properties_extension) + one-shot
backfill from property_details.listing_events for pre-trigger history.
Tax reassessment forecast PA · Partial reset (capped growth)
- Current annual tax
- $1,423 · $119/mo
- Projected year-2 tax
- $1,896 · $158/mo
- Expected delta
- +$473/yr (+$39/mo · 33.2%)
ⓘ Screening estimate from a state-policy table — verify with the county assessor before closing.
Climate risk First Street
- Flood 6/10 Major FEMA zone X (unshaded) · 72% chance over 30 yrs
- Wildfire 3/10 Moderate
- Heat 4/10 Moderate 8 d/yr ≥95°F today · 17 d/yr by 30 yrs out
- Wind 4/10 Moderate 9% chance of damaging wind over 30 yrs
- Air quality 2/10 Low 1 unhealthy d/yr today · 2 by 30 yrs out
Nearby sold comps map
Loading sold comps map…
Walkable amenities ~0.75 mi
Loading nearby amenities…
Taxation est. · year 1
- Rental income
- $16,013
- − Mortgage interest
- −$8,397
- − Property taxes
- −$1,423
- − Insurance
- −$750
- − Repairs & maintenance
- −$1,281
- − Management
- −$1,281
- − Depreciation
- −$4,361
- Taxable loss
- −$1,479
- Est. tax savings @ 24.0%
- +$355
- After-tax cash flow
- $1,400/yr
For passive investors: Depreciation is non-cash, so a rental often shows a tax loss while cash-flowing — sheltering income. Rental losses are passive: they offset passive income freely, and up to $25,000/yr can offset ordinary (W-2) income if you actively participate and your MAGI is under $100k (phasing out to $0 by $150k); unused losses carry forward. On sale, claimed depreciation is recaptured at up to 25%, and gains may owe capital-gains tax (a 1031 exchange can defer both). Figures are a year-1 estimate at your 24.0% rate — not tax advice; consult a CPA.
Schools (NCES district)
- District
- Tamaqua Area SD
- NCES district ID
- 4223220
- Math proficiency
- 31% ▼ -9.00%
- Reading proficiency
- 53% ▼ -8.00%
- Median HH income
- $45,184
- Composite
- 35.61/100
- National rank
- #4893
- State rank
- #331 of 539 in PA
Livability — Tamaqua
- Score
- 80/100
- State rank
- #209
- US rank
- #1844
Category grades
Schools grade is shown separately in the Schools card above.
Census & demographics
- Census place
- Tamaqua, PA
- Population (ZIP)
- 11,065
Population outlook (Schuylkill County) Hauer SSP2
- Today (2025)
- 137,447 people
- By 2030
- 133,121 · -3.1%
- By 2040
- 124,172 · -9.7%
- By 2050
- 115,611 · -15.9%
- By 2075
- 100,796 · -26.7%
- By 2100
- 86,667 · -36.9%
Race, ethnicity, and origin ACS 2023
- Neighborhood character
- Predominantly White (87%)
- Race & ethnicity
- White 87% Hispanic / Latino 9% Two or more races 8%
- Hispanic origin (detail)
- Mexican 3% Puerto Rican 3% Salvadoran 2%
- Common ancestry
- Romanian 11% Iranian 3% Polish 2%
- Foreign-born
- 2% · Canada, Dominican Republic
- Languages at home
- 97% English-only · Spanish 2%
Political lean MEDSL · Schuylkill
- 2024 margin
- Solid R (+42.1) · D 28.5% · R 70.6%
- 2008→2024 swing
- -33.4pp toward R · 2008: -8.7pp · 2024: -42.1pp
- All cycles
- 2024: R+42.1 2020: R+39.9 2016: R+43.4 2012: R+13.4 2008: R+8.7
Not yet ingested
- Civics
- —
Market trends
- HPI YoY
- ▼ -35.53%
- Current HPI
- 194.8976
- Rent YoY
- —
- Metro
- —
- State GDP YoY
- ▲ 1.68%
- F500 in state
- 34
Industry mix (Fortune 500 HQ in PA)
| Industry | F500 HQs | Revenue |
|---|---|---|
| Healthcare | 2 | $309B |
|
||
| Insurance | 2 | $27B |
|
||
| Telecommunications / Media | 1 | $124B |
|
||
| Industrial Distribution | 1 | $22B |
|
||
| Financial Services | 1 | $20B |
|
||
| Chemicals / Materials | 1 | $18B |
|
||
Price history
+1077.3% since first listed9 events — show timeline
- 2026-05-01 Listing Removed — GLVRMLS
- 2026-02-20 Price Changed $149,900 BRIGHT MLS
- 2025-11-15 Listing Removed — GLVRMLS
- 2025-11-10 Listed $159,900 GLVRMLS
- 2025-10-25 Listed $159,900 GLVRMLS
- 2025-10-20 Price Changed $159,900 BRIGHT MLS
- 2025-10-10 Listed $174,900 BRIGHT MLS
- 1991-04-04 Sold (Public Records) $15,000 Public Records
- 1990-12-28 Sold (Public Records) $12,732 Public Records
Property tax history
+2.7%/yrLatest (2025): $1,423 · +7.9% YoY. Source: county tax records.
Cash-flow waterfall
monthlySold comps — $/sqft
last 12 mo · ≤1 miLoading sold comps…