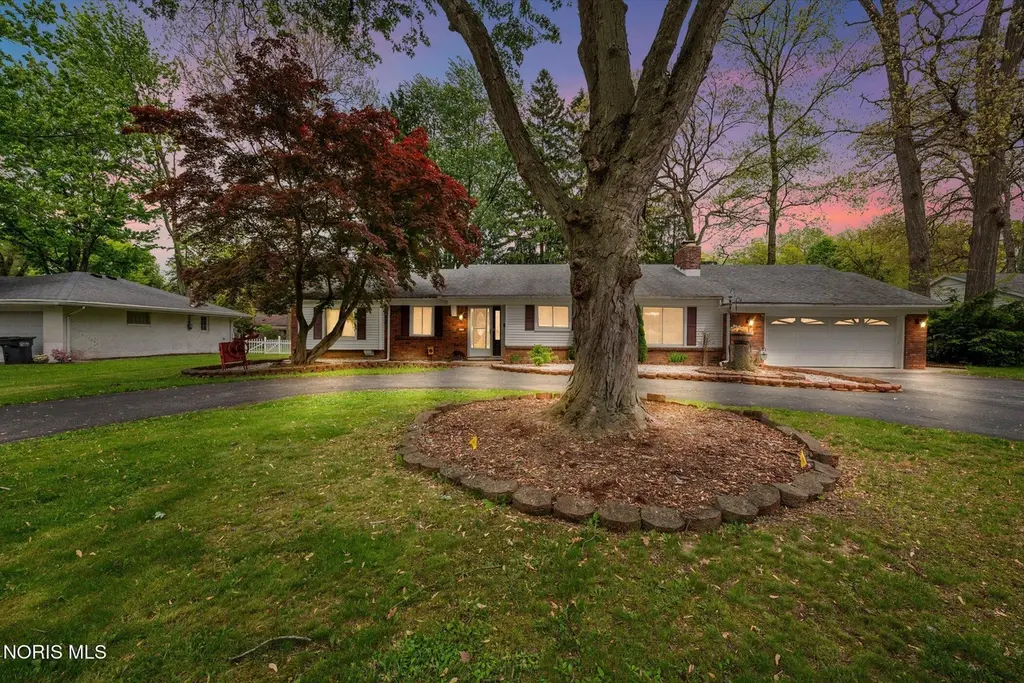
3658 Lauderdale Dr · Toledo, OH
Flood risk 1/10 · Minimal
- FEMA flood zone
- X (unshaded)
- Chance of flooding over 30 yrs
- 0.0%
- Est. flood insurance / yr
- $507 – $1,088
Fire risk 1/10 · Minimal
- Est. fire insurance / yr
- $713 – $1,323
Heat risk 3/10 · Minor
- Hot days now (above 100°F)
- 7 days/yr
- Hot days in 30 yrs
- 16 days/yr
Wind risk 2/10 · Minimal
- Chance of severe wind over 30 yrs
- —
Air-quality risk 2/10 · Minimal
- Unhealthy air days now
- 1 days/yr
- Unhealthy air days in 30 yrs
- 1 days/yr
Risk factors via First Street. Map © Google.
Why this score? — see what drove the C- grade
The composite is a weighted blend of 9 inputs, each scored 0–100. Each bar is that input's sub-score; the figure is the points it added to the 100-point composite (weight × sub-score).
- Cash flow +19.5/30.0
- ARV discount +8.5/15.0
- DSCR +6.2/10.0
- Schools +5.9/10.0
- 1% rule +5.4/10.0
- Livability +3.3/5.0
- Rent growth +3.1/5.0
- Condition / age +2.5/5.0
- Appreciation +0.0/10.0
$259,900
🖨 Deal sheet 📄 Offer letter ✓ Due diligence
Listing remarks MLS
REO Property. Property Sold AS-IS W/O Repair, Warranty or Seller Disclosure. The Listing Broker & Seller make no guarantees, warranties or representations as to the accuracy of information contained herein. Buyer or Buyer's Agent is responsible for utility activation related to inspections. Water activation not authorized; air pressure test only.
Key facts
- 0.25 acre lot
- 2 garage spots
- Built 1959
Property features AI
Exterior
- Parking: Attached garage with 2 spaces; Total parking for 6 vehicles; Asphalt surfaces and circular driveway
- Utilities: Public water; Sanitary sewer; 100 amp electric service with circuit breakers; Cable available and connected; Natural gas available and connected; Internet and WiFi available and connected
- Home design: Single-family residence (house); One story
- Construction: Brick and vinyl siding exterior; Shingle roof; Crawl space foundation; Year built (from public records)
- Exterior features: Deck; Privacy fencing; Level lot
Interior
- Kitchen: Electric oven; Electric range; Range hood; Dishwasher; Refrigerator; Garbage disposal
- Bedrooms: Bedroom 2 on main level with ceiling fan(s) and carpet; Bedroom 3 on main level with carpet; Additional main-level bedroom with walk-in closet
- Flooring: Carpet; Ceramic tile; Laminate
- Bathrooms: 2 full bathrooms
- Heating & cooling: Central heating (forced air) with natural gas; Central air conditioning; Ceiling fans
- Interior features: Entrance foyer; Walk-in closet(s); Ceiling fan(s); Crown molding; Tray ceiling(s); Primary bathroom; Sliding doors; Wood burning stove fireplace in living room
- Laundry & utility: Washer and dryer included; Laundry located on main level and in garage; Water heater
Neighborhood map
What this means for you Summary
Snapshot
- This is a 3-bed/2.0-bath single-family listed at $260k.
Deal economics
- At list price, monthly cash flow is $296 ($4k/yr) — positive.
- The deal already cash-flows at list — no discount required.
- Meets the 1% rule at list price ($3k rent vs $260k).
- Recommended offer: $256k (1.5% below list) — sets the bar for market timing.
Location & tenants
- Location reads 66/100 on livability (#645 in OH) — a middle-class / working-renter tenant base. Strengths: cost of living A+, housing A+, health & safety A+; Watch: amenities C-, crime F, commute F.
- Sylvania Schools (suburban): math 63% / reading 71% proficiency, ranked #157 of 656 in OH (top 24%) — acceptable for families but not a draw, mixed tenant base, ~2y average lease; only 18% free/reduced lunch — higher-income household profile.
- Zoned schools: Stranahan Elementary School (math 52% / reading 63%, grade C+, #721 of 1,584 statewide, top 46%, 528 students, 32% FRL); Sylvania Southview High School (math 53% / reading 74%, grade B-, #196 of 781 statewide, top 25%, 1,107 students, 22% FRL).
- Market conditions: Rents rising (+2.6%/yr); 114 active listings in the ZIP; 3 comparable units currently listed for rent nearby; rentals at typical pace (median 23d on market — plan ~3-4 weeks tenant-placement turnaround); 415 units permitted in Lucas County in 2024 (122 in 5+ unit buildings).
- At $2,690/mo this rent would consume 56% of the median local household income ($58k/yr) (locally 1683% of renters already pay >50% of income on rent) — very limited rent-growth headroom before tenants either downsize or default.
Forward outlook
- Local home prices are declining (-3.0%/yr); year-one equity from $2k of loan paydown is wiped out by about $8k of value loss. Plan a longer hold.
- Lucas County population projected at -16% by 2050 — secular population decline; favor cash flow + early exit over multi-decade hold.
Negotiation context
- It's been on market 23 days — a 2% lower offer ($256k) is reasonable based on typical stale-listing flexibility.
- 2 sale attempts since 12y ago with the ask held roughly flat each time — persistent listings suggest the price (not the market) is what's stuck; bring a comps-based counter.
- Current owner paid $81k; list at $260k implies a 222% gain — meaningful room to come down on a strong offer.
Risks & watch-outs
- Watch-outs: built in 1959 — expect roof / HVAC / electrical / plumbing capex.
Questions for the listing agent
- Built in 1959 — when were the roof, HVAC, electrical panel, plumbing, and water heater last replaced?
- Is there a deadline driving the sale (1031 exchange, divorce, estate, relocation)? That informs how much negotiation room exists.
- Schools are D-rated, which usually means shorter tenancies and higher turnover. Who's the typical renter profile here, and what's been the actual vacancy rate?
- Crime grade is F in this area — have there been break-ins, vandalism, or insurance claims at this property in the last 3 years? What carrier currently insures it and at what premium?
- What's the average days-on-market for RENTAL listings here right now (not sales)? A rising rental-DOM trend means longer vacancies and softer asking-rent achievability than the comps imply.
- What's the recent tenant-quality profile in this submarket — average credit score on applications, eviction rate, late-payment / NSF rate, and stable-employment percentage? A property-management company in the area should have these aggregated.
- How much new for-sale + rental construction is in the pipeline within 1–3 miles? Heavy new supply typically softens prices + rents 12–24 months out; constrained supply supports both.
Investment metrics
- 1% rule
- 1.04% ✓
- Cap rate
- 7.66%
- Cash-on-cash
- 4.88%
- DSCR
- 1.22
- GRM
- 8.1
CMA / ARV
- ARV (median comp)
- $265,894
- List price
- $259,900
- Delta
- -2.25%
- Verdict
- FAIR
- Comps
- 20 within 1.0 mi
Show comp detail 12 sales within ~0.75 mi
| Address | Dist | Beds/Ba | Sqft | Sold | Price | $/sf | Match |
|---|---|---|---|---|---|---|---|
| 4537 Belfair Ct | 0.26mi | 4/2.0 (+1) | 1,989 (-4%) | 9mo | $275,000 | $138 | 69 |
| 3439 Shakespeare Ln | 0.29mi | 3/2.5 | 2,207 (+7%) | 6mo | $435,000 | $197 | 68 |
| 3520 Scarsborough Rd | 0.38mi | 3/2.0 | 1,937 (-6%) | 8mo | $330,352 | $171 | 66 |
| 3628 Chesterton Dr | 0.12mi | 4/2.5 (+1) | 2,291 (+11%) | 4mo | $367,900 | $161 | 66 |
| 4108 Partridge Ln | 0.50mi | 4/2.5 (+1) | 2,126 (+3%) | 3mo | $325,000 | $153 | 62 |
| 3221 Talmadge Rd | 0.60mi | 4/2.5 (+1) | 2,131 (+3%) | 6mo | $285,000 | $134 | 54 |
| 4632 Beaconsfield Ct | 0.60mi | 4/2.5 (+1) | 2,001 (-3%) | 7mo | $339,900 | $170 | 54 |
| 3724 Talmadge Rd | 0.45mi | 3/1.5 | 2,368 (+15%) | 1mo | $235,000 | $99 | 52 |
| 4225 Talwood Ln | 0.50mi | 3/2.0 | 1,778 (-14%) | 7mo | $175,000 | $98 | 48 |
| 4910 W Sylvania Ave | 0.56mi | 3/1.5 | 1,802 (-13%) | 5mo | $275,000 | $153 | 47 |
| 4225 Graceway Dr | 0.52mi | 4/3.0 (+1) | 2,285 (+11%) | 7mo | $242,000 | $106 | 43 |
| 4311 Garden Estates Dr | 0.72mi | 3/2.5 | 1,792 (-13%) | 6mo | $320,000 | $179 | 37 |
Match score weights: distance 35% · size 25% · config 20% · recency 20%. Top-matched comps best support the ARV.
Projected returns pro-forma
-3.0% appreciation · 2.59% rent growth · sell at horizon
- IRR
- -9.2%
- Equity multiple
- 0.67×
- Total profit
- $-24,322
- Equity at exit
- $38,752
- IRR
- -0.2%
- Equity multiple
- 0.98×
- Total profit
- $-1,173
- Equity at exit
- $22,471
Cash invested: $72,772 (down + closing). Projections, not guarantees.
Landlord ↔ Tenant lean methodology
- Overall (STATE)
- 73 Landlord-Friendly
- State Ohio
- 73 Landlord-Friendly · R+6
- County
- — inherits STATE
- City
- — inherits STATE
ZIP-level market 43615
- Home prices YoY
- -31.9%
- Rents YoY
- 2.6%
- Active inventory
- 114
- Price-to-rent
- 8.1×
Monthly cashflow live
- Estimated rent
- $2,690 medium interval (Pro) →
- Mortgage (P&I)
- −$1,363
- Tax from tax record
- −$358 /mo · $4,300/yr
- Insurance
- −$108
- HOA
- −$0
- Vacancy / Maint / Mgmt
- −$565
- Net cashflow
- $296
Break-even live
UW: 25.0% down · 7.5% · 30yr · 1.5% tax · 5.0% vac · 8.0% maint · 8.0% mgmt
Financing live
Cash to close
- Down payment
- $64,975
- Closing costs
- $7,797
- Reserves months
- —
- Total cash needed
- —
Loan-product check · same deal, 3 products live
Conventional
25% down · 7.5% · 30yr
- Down + closing
- —
- Monthly P&I
- —
- Monthly cashflow
- —
- DSCR
- —
- Eligible?
- —
Personal DTI + credit; lowest rate.
DSCR
20% down · 8.5% · 30yr
- Down + closing
- —
- Monthly P&I
- —
- Monthly cashflow
- —
- DSCR
- —
- Eligible?
- —
No personal income docs; deal must DSCR.
Hard money
10% down · 12.0% · 12mo
- Down + closing
- —
- Monthly P&I
- —
- Monthly cashflow
- —
- DSCR
- —
- Eligible?
- —
Short-term bridge; refi at stabilization.
Rent comps 3 comps
| Address | Beds | Baths | Sqft | Rent | $/sqft | DOM | Units | Dist |
|---|---|---|---|---|---|---|---|---|
| 4808 Penridge Rd Toledo, OH | 4.0 | 2.5 | 2313 | $3,500 | $1.51 | 13d | 1 | 0.32mi |
| 4842 Larkhaven Dr Toledo, OH | 3.0 | 3.0 | 1594 | $2,400 | $1.51 | 23d | 1 | 1.25mi |
| 3238 Van Fleet Pkwy Toledo, OH | 3.0 | 2.0 | 1725 | $1,985 | $1.15 | 43d | 1 | 1.47mi |
Listing history 19 events
-
2026-06-13statusdays on market $259,900 Pending 23 DOM
-
2026-06-10days on market $259,900 Contingent 22 DOM
-
2026-06-09days on market $259,900 Contingent 21 DOM
-
2026-06-08days on market $259,900 Contingent 20 DOM
-
2026-06-07days on market $259,900 Contingent 19 DOM
-
2026-06-03days on market $259,900 Contingent 15 DOM
-
2026-06-02days on market $259,900 Contingent 14 DOM
-
2026-06-01days on market $259,900 Contingent 13 DOM
-
2026-05-31days on market $259,900 Contingent 12 DOM
-
2026-05-30days on market $259,900 Contingent 11 DOM
-
2026-05-16historical $259,900 790-char remark
-
2026-05-13price $63,000 355-char remark
Show marketing remark (355 chars)
REO Property. Property Sold AS-IS W/O Repair, Warranty or Seller Disclosure. The Listing Broker & Seller make no guarantees, warranties or representations as to the accuracy of information contained herein. Buyer or Buyer's Agent is responsible for utility activation related to inspections. Water activation not authorized; air pressure test only.
-
2014-04-22soldstatus $80,764 355-char remark
Show marketing remark (355 chars)
REO Property. Property Sold AS-IS W/O Repair, Warranty or Seller Disclosure. The Listing Broker & Seller make no guarantees, warranties or representations as to the accuracy of information contained herein. Buyer or Buyer's Agent is responsible for utility activation related to inspections. Water activation not authorized; air pressure test only.
-
2014-04-09price $80,764 355-char remark
Show marketing remark (355 chars)
REO Property. Property Sold AS-IS W/O Repair, Warranty or Seller Disclosure. The Listing Broker & Seller make no guarantees, warranties or representations as to the accuracy of information contained herein. Buyer or Buyer's Agent is responsible for utility activation related to inspections. Water activation not authorized; air pressure test only.
-
2014-03-27$63,000 355-char remark
Show marketing remark (355 chars)
REO Property. Property Sold AS-IS W/O Repair, Warranty or Seller Disclosure. The Listing Broker & Seller make no guarantees, warranties or representations as to the accuracy of information contained herein. Buyer or Buyer's Agent is responsible for utility activation related to inspections. Water activation not authorized; air pressure test only.
-
1996-08-12soldstatus $135,000
-
1994-03-18soldstatus $125,000
-
1988-02-17soldstatus $90,000
-
1976-05-10soldstatus $56,300
ⓘ Source: listings_history table (triggers on properties + properties_extension) + one-shot
backfill from property_details.listing_events for pre-trigger history.
Tax reassessment forecast OH · Partial reset (capped growth)
- Current annual tax
- $4,300 · $358/mo
- Projected year-2 tax
- $4,300 · $358/mo
- Expected delta
- $0/yr ($0/mo · 0.0%)
ⓘ Screening estimate from a state-policy table — verify with the county assessor before closing.
Climate risk First Street
- Flood 1/10 Low FEMA zone X (unshaded) · 0% chance over 30 yrs
- Wildfire 1/10 Low
- Heat 3/10 Moderate 7 d/yr ≥100°F today · 16 d/yr by 30 yrs out
- Wind 2/10 Low
- Air quality 2/10 Low 1 unhealthy d/yr today · 1 by 30 yrs out
Nearby sold comps map
Loading sold comps map…
Walkable amenities ~0.75 mi
Loading nearby amenities…
Taxation est. · year 1
- Rental income
- $32,283
- − Mortgage interest
- −$14,558
- − Property taxes
- −$4,300
- − Insurance
- −$1,300
- − Repairs & maintenance
- −$2,583
- − Management
- −$2,583
- − Depreciation
- −$7,561
- Taxable loss
- −$601
- Est. tax savings @ 24.0%
- +$144
- After-tax cash flow
- $3,693/yr
For passive investors: Depreciation is non-cash, so a rental often shows a tax loss while cash-flowing — sheltering income. Rental losses are passive: they offset passive income freely, and up to $25,000/yr can offset ordinary (W-2) income if you actively participate and your MAGI is under $100k (phasing out to $0 by $150k); unused losses carry forward. On sale, claimed depreciation is recaptured at up to 25%, and gains may owe capital-gains tax (a 1031 exchange can defer both). Figures are a year-1 estimate at your 24.0% rate — not tax advice; consult a CPA.
Schools (NCES district)
- District
- Sylvania Schools
- NCES district ID
- 3904487
- Math proficiency
- 63% ▼ -12.00%
- Reading proficiency
- 71% ▼ -6.00%
- Median HH income
- $71,949
- Composite
- 58.95/100
- National rank
- #967
- State rank
- #157 of 656 in OH
Livability — Toledo
- Score
- 66/100
- State rank
- #645
- US rank
- #11442
Category grades
Schools grade is shown separately in the Schools card above.
Census & demographics
- Census place
- Toledo, OH
- County
- Lucas County · 380,724 people
- City population
- 280,811
- Metro
- Toledo, OH
- Population (ZIP)
- 40,146
- Household income
- $57,713
- Rent vs Own
- Severe rent burden
- 1683.0
Population outlook (Lucas County) Hauer SSP2
- Today (2025)
- 420,751 people
- By 2030
- 410,187 · -2.5%
- By 2040
- 384,019 · -8.7%
- By 2050
- 355,125 · -15.6%
- By 2075
- 291,683 · -30.7%
- By 2100
- 233,670 · -44.5%
Race, ethnicity, and origin ACS 2023
- Neighborhood character
- Majority White (62%)
- Race & ethnicity
- White 62% Black 26% Two or more races 6% Hispanic / Latino 4% Asian 3%
- Common ancestry
- Romanian 7% Lithuanian 3% Slovak 2%
- Foreign-born
- 5% · China, Canada
- Languages at home
- 93% English-only · Arabic 2% Spanish 1% Chinese 1%
Political lean MEDSL · Lucas
- 2024 margin
- D (+12.6) · D 55.8% · R 43.2%
- 2008→2024 swing
- -18.9pp toward R · 2008: 31.4pp · 2024: 12.6pp
- All cycles
- 2024: D+12.6 2020: D+16.8 2016: D+17.4 2012: D+30.4 2008: D+31.4
Not yet ingested
- Civics
- —
Market trends
- HPI YoY
- ▼ -96.44%
- Current HPI
- 205.95
- Rent YoY
- ▲ 2.59%
- Metro
- Toledo, OH
- State GDP YoY
- ▲ 1.98%
- F500 in state
- 48
Industry mix (Fortune 500 HQ in OH)
| Industry | F500 HQs | Revenue |
|---|---|---|
| Insurance | 3 | $145B |
|
||
| Industrial Machinery | 3 | $49B |
|
||
| Financial Services | 3 | $24B |
|
||
| Consumer Goods | 2 | $93B |
|
||
| Aerospace / Defense | 2 | $47B |
|
||
| Utilities | 2 | $33B |
|
||
Price history
+361.6% since first listed12 events — show timeline
- 2026-06-11 Pending — NORIS
- 2026-05-26 Contingent — NORIS
- 2026-05-19 Listed $259,900 NORIS
- 2026-05-16 Coming Soon $259,900 NORIS
- 2026-05-13 Price Changed $63,000 NORIS
- 2014-04-22 Sold (MLS) $80,764 NORIS
- 2014-04-09 Price Changed $80,764 NORIS
- 2014-03-27 Listed $63,000 NORIS
- 1996-08-12 Sold (Public Records) $135,000 Public Records
- 1994-03-18 Sold (Public Records) $125,000 Public Records
- 1988-02-17 Sold (Public Records) $90,000 Public Records
- 1976-05-10 Sold (Public Records) $56,300 Public Records
Property tax history
+2.3%/yrLatest (2025): $4,300 · +2.2% YoY. Source: county tax records.
Cash-flow waterfall
monthlySold comps — $/sqft
last 12 mo · ≤1 miLoading sold comps…