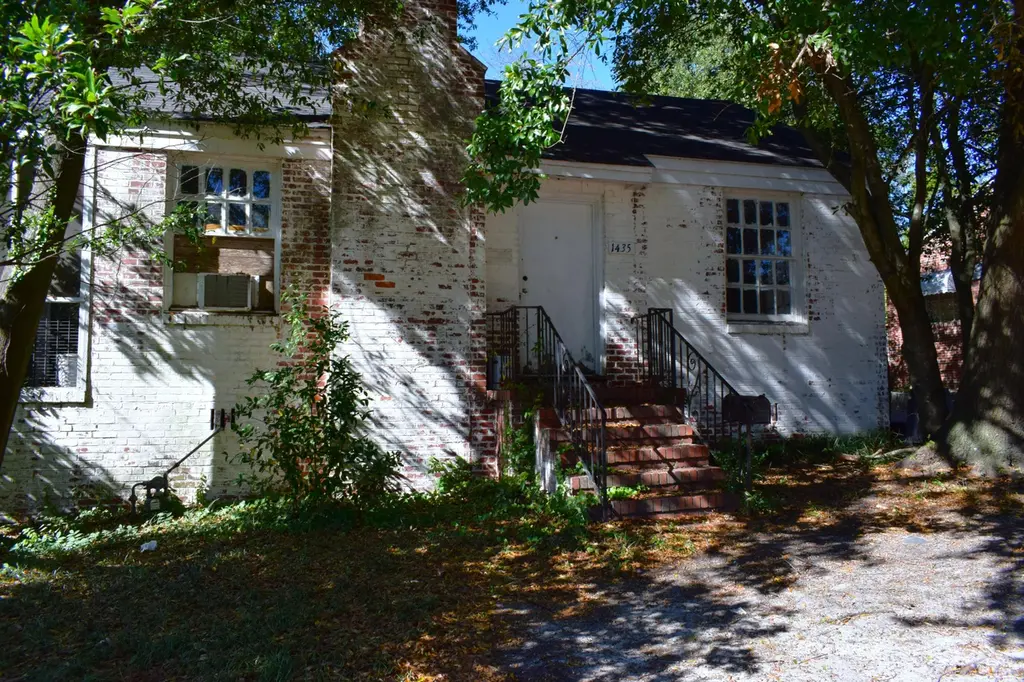
1435 Troupe St · Augusta-Richmond County consolidated government (balance), GA
Flood risk 1/10 · Minimal
- FEMA flood zone
- X (unshaded)
- Chance of flooding over 30 yrs
- 0.0%
- Est. flood insurance / yr
- $507 – $1,088
Fire risk 1/10 · Minimal
- Est. fire insurance / yr
- $963 – $1,789
Heat risk 7/10 · Major
- Hot days now (above 108°F)
- 7 days/yr
- Hot days in 30 yrs
- 16 days/yr
Wind risk 6/10 · Moderate
- Chance of severe wind over 30 yrs
- 72.0%
Air-quality risk 4/10 · Minor
- Unhealthy air days now
- 4 days/yr
- Unhealthy air days in 30 yrs
- 4 days/yr
Risk factors via First Street. Map © Google.
Why this score? — see what drove the C+ grade
The composite is a weighted blend of 9 inputs, each scored 0–100. Each bar is that input's sub-score; the figure is the points it added to the 100-point composite (weight × sub-score).
- Cash flow +25.0/30.0
- ARV discount +15.0/15.0
- DSCR +8.1/10.0
- 1% rule +6.7/10.0
- Rent growth +3.6/5.0
- Livability +2.5/5.0
- Condition / age +2.5/5.0
- Schools +1.3/10.0
- Appreciation +0.0/10.0
$120,000
🖨 Deal sheet 📄 Offer letter ✓ Due diligence
Listing remarks
Incredible investment opportunity in Augusta! Seller is offering THREE properties (1433, 1435 & 1437 Troupe) with a special bulk purchase price of 300,000 available only when all three properties are bought together under one contract. If purchased individually, each property will be sold at its full list price with no package discount. All properties are being sold strictly AS-IS; seller will make no repairs, provide no credits, and offer no concessions. Ideal for investors, rehabbers, and portfolio builders looking for strong upside potential.
Key facts
- 0.28 acre lot
- Built 1942
Neighborhood map
What this means for you Summary
Snapshot
- This is a 3-bed/1.0-bath single-family listed at $120k.
Deal economics
- At list price, monthly cash flow is $261 ($3k/yr) — positive.
- The deal already cash-flows at list — no discount required.
- Meets the 1% rule at list price ($1k rent vs $120k).
- Cap rate 8.9% vs local median 5.3% in Augusta-Richmond County consolidated government (balance) — top-decile yield for the area; either an underpriced asset or a hidden risk that comps aren't pricing in. Stress-test before assuming the spread holds.
Location & tenants
- Location reads: area grade C — affects rentability + tenant quality, not the cash-flow math above.
- Richmond County (urban): math 12% / reading 20% proficiency, ranked #154 of 174 in GA (top 88%) — low school quality limits family demand, transient renter base, plan for 1-2y turnover; 72% free/reduced lunch — lower-income household profile, screen leases tightly.
- Zoned schools: Monte Sano Elementary School (math 2% / reading 8%, grade F, #1,160 of 1,228 statewide, top 98%, 410 students, 98% FRL); Academy of Richmond County High School (math 2% / reading 17%, grade F, #365 of 424 statewide, top 88%, 1,141 students, 98% FRL) — zoned schools average 98% FRL vs 72% district-wide (26 pts higher); higher-poverty schools than district average — tighter screening recommended.
- Market conditions: Rents rising fast (+4.3%/yr); 222 active listings in the ZIP; 40 comparable units currently listed for rent nearby; rentals lingering (median 44d on market — plan ~5-8 weeks vacancy on turnover, expect pricing pressure); 58% of comp listings sitting > 30 days — soft ceiling on asking rent; 561 units permitted in Richmond County in 2024 (0 in 5+ unit buildings).
- This rent runs 36% of the median local income ($47k/yr) — at the standard rent-burdened threshold; future hikes will face affordability resistance.
Forward outlook
- Local home prices are declining (-3.0%/yr); year-one equity from $830 of loan paydown is wiped out by about $4k of value loss. Plan a longer hold.
- Richmond County population projected to shrink 5% by 2050 — rents likely to lag national; underwrite the cash flow, not the appreciation.
- At projected returns (-3.0% appreciation + 4.3% rent growth), your $34k cash investment doubles in ~10 years — after that, you're playing with house money.
Negotiation context
- Only 0 days on market — expect competitive offers; lowballing is unlikely to land.
- 4 sale attempts with the ask held roughly flat each time — persistent listings suggest the price (not the market) is what's stuck; bring a comps-based counter.
- Current owner paid $44k; list at $120k implies a 173% gain — meaningful room to come down on a strong offer.
Risks & watch-outs
- Watch-outs: built in 1942 — expect roof / HVAC / electrical / plumbing capex.
- Climate carrying-cost: major wind risk, 72% chance of damaging wind over 30y; extreme-heat days projected 7→16/yr by 2055 (HVAC capex compounding) — expect insurance premiums to compound above CPI over the hold.
Questions for the listing agent
- Built in 1942 — when were the roof, HVAC, electrical panel, plumbing, and water heater last replaced?
- Is there a deadline driving the sale (1031 exchange, divorce, estate, relocation)? That informs how much negotiation room exists.
- What's the average days-on-market for RENTAL listings here right now (not sales)? A rising rental-DOM trend means longer vacancies and softer asking-rent achievability than the comps imply.
- What's the recent tenant-quality profile in this submarket — average credit score on applications, eviction rate, late-payment / NSF rate, and stable-employment percentage? A property-management company in the area should have these aggregated.
- How much new for-sale + rental construction is in the pipeline within 1–3 miles? Heavy new supply typically softens prices + rents 12–24 months out; constrained supply supports both.
Investment metrics
- 1% rule
- 1.17% ✓
- Cap rate
- 8.90%
- Cash-on-cash
- 9.32%
- DSCR
- 1.41
- GRM
- 7.1
CMA / ARV
- ARV (on-the-fly)
- $179,280
- Comps found
- 12
Show comp detail 12 sales within ~0.75 mi
| Address | Dist | Beds/Ba | Sqft | Sold | Price | $/sf | Match |
|---|---|---|---|---|---|---|---|
| 1608 Pendleton Rd | 0.25mi | 3/1.0 | 1,078 (-0%) | 1mo | $184,900 | $172 | 87 |
| 1510 Pendleton Rd | 0.14mi | 2/1.0 (-1) | 1,094 (+1%) | 3mo | $161,495 | $148 | 84 |
| 1516 Johns Rd | 0.32mi | 2/1.0 (-1) | 1,119 (+4%) | 1mo | $149,000 | $133 | 73 |
| 1541 Heath St | 0.47mi | 2/1.0 (-1) | 1,037 (-4%) | 4mo | $175,000 | $169 | 63 |
| 1703 Holly Hill Rd | 0.32mi | 3/1.0 | 1,228 (+14%) | 3mo | $203,900 | $166 | 60 |
| 2048 Wharton Dr | 0.70mi | 3/1.0 | 1,050 (-3%) | 5mo | $124,500 | $119 | 59 |
| 2139 Whitney South Dr | 0.73mi | 2/2.0 (-1) | 1,075 (-0%) | 4mo | $190,000 | $177 | 53 |
| 1611 Pendleton Rd | 0.26mi | 2/2.0 (-1) | 1,242 (+15%) | 2mo | $189,000 | $152 | 52 |
| 1765 Kissingbower Rd | 0.70mi | 2/1.0 (-1) | 1,140 (+6%) | 4mo | $155,000 | $136 | 50 |
| 1745 Berkeley Rd | 0.67mi | 2/2.0 (-1) | 1,140 (+6%) | 2mo | $217,500 | $191 | 49 |
| 1802 Wrighstboro Rd Rd | 0.75mi | 2/2.0 (-1) | 1,114 (+3%) | 5mo | $122,880 | $110 | 47 |
| 1752 Pine Tree Rd | 0.57mi | 2/1.5 (-1) | 1,218 (+13%) | 2mo | $213,000 | $175 | 43 |
Match score weights: distance 35% · size 25% · config 20% · recency 20%. Top-matched comps best support the ARV.
Projected returns pro-forma
-3.0% appreciation · 4.29% rent growth · sell at horizon
- IRR
- -0.7%
- Equity multiple
- 0.97×
- Total profit
- $-940
- Equity at exit
- $17,892
- IRR
- 10.3%
- Equity multiple
- 1.85×
- Total profit
- $28,501
- Equity at exit
- $10,375
Cash invested: $33,600 (down + closing). Projections, not guarantees.
Landlord ↔ Tenant lean methodology
- Overall (STATE)
- 90 Strongly Landlord-Friendly
- State Georgia
- 90 Strongly Landlord-Friendly · R+3
- County
- — inherits STATE
- City
- — inherits STATE
ZIP-level market 30904
- Rents YoY
- 4.3%
- Active inventory
- 222
- Price-to-rent
- 7.1×
Monthly cashflow live
- Estimated rent
- $1,404 high interval (Pro) →
- Mortgage (P&I)
- −$629
- Tax from tax record
- −$169 /mo · $2,026/yr
- Insurance
- −$50
- HOA
- −$0
- Vacancy / Maint / Mgmt
- −$295
- Net cashflow
- $261
Break-even live
UW: 25.0% down · 7.5% · 30yr · 1.5% tax · 5.0% vac · 8.0% maint · 8.0% mgmt
Financing live
Cash to close
- Down payment
- $30,000
- Closing costs
- $3,600
- Reserves months
- —
- Total cash needed
- —
Loan-product check · same deal, 3 products live
Conventional
25% down · 7.5% · 30yr
- Down + closing
- —
- Monthly P&I
- —
- Monthly cashflow
- —
- DSCR
- —
- Eligible?
- —
Personal DTI + credit; lowest rate.
DSCR
20% down · 8.5% · 30yr
- Down + closing
- —
- Monthly P&I
- —
- Monthly cashflow
- —
- DSCR
- —
- Eligible?
- —
No personal income docs; deal must DSCR.
Hard money
10% down · 12.0% · 12mo
- Down + closing
- —
- Monthly P&I
- —
- Monthly cashflow
- —
- DSCR
- —
- Eligible?
- —
Short-term bridge; refi at stabilization.
Rent comps 40 comps
| Address | Beds | Baths | Sqft | Rent | $/sqft | DOM | Units | Dist |
|---|---|---|---|---|---|---|---|---|
| 1506 Pendleton Rd Augusta, GA | 2.0 | 1.0 | 1026 | $1,300 | $1.27 | 44d | 1 | 0.10mi |
| 1506 Pendleton Rd Augusta, GA | 2.0 | 1.0 | 1026 | $1,300 | $1.27 | 23d | 1 | 0.10mi |
| 2219 Archer Augusta, GA | 2.0 | 2.0 | 1103 | $1,495 | $1.36 | 44d | 1 | 0.16mi |
| 2221 Archer LN Augusta, GA | 2.0 | 2.0 | 1103 | $1,495 | $1.36 | 44d | 1 | 0.17mi |
| 1509 Troupe St Augusta, GA | 3.0 | 2.0 | 1200 | $1,695 | $1.41 | 14d | 1 | 0.18mi |
| 1432 Heard Ave Augusta, GA | 3.0 | 2.0 | 1278 | $1,500 | $1.17 | 44d | 1 | 0.22mi |
| 1613 Pendleton Rd Augusta, GA | 3.0 | 2.0 | 1418 | $1,695 | $1.20 | 14d | 1 | 0.26mi |
| 1508 Heard Ave Augusta, GA | 3.0 | 2.0 | 1314 | $1,400 | $1.07 | 44d | 1 | 0.28mi |
| 2031 Wrightsboro Rd Augusta, GA | 2.0 | 2.0 | 1240 | $1,750 | $1.41 | 44d | 1 | 0.35mi |
| 2198 Central Ave Unit D Augusta, GA | 2.0 | 1.0 | 900 | $950 | $1.06 | 23d | 1 | 0.35mi |
| 1712 Kissingbower Rd Augusta, GA | 2.0 | 1.0 | 1072 | $1,400 | $1.31 | 14d | 1 | 0.37mi |
| 1719 Kissingbower Rd Augusta, GA | 2.0 | 1.0 | 1185 | $1,195 | $1.01 | 21d | 1 | 0.39mi |
| 1526 Heath St Augusta, GA | 2.0 | 1.0 | 900 | $1,250 | $1.39 | 44d | 1 | 0.44mi |
| 1545 Heath St Unit B Augusta, GA | 2.0 | 1.0 | 832 | $650 | $0.78 | 44d | 1 | 0.44mi |
| 1545 Heath St Augusta, GA | 2.0 | 1.0 | 832 | $650 | $0.78 | 44d | 1 | 0.44mi |
| 1112 Troupe St Augusta, GA | 2.0 | 1.0 | 1035 | $1,100 | $1.06 | 23d | 1 | 0.46mi |
| 1110 Troupe St Augusta, GA | 2.0 | 1.0 | 1035 | $1,100 | $1.06 | 23d | 1 | 0.46mi |
| 2224 Queens Way Augusta, GA | 2.0 | 1.0 | 1239 | $995 | $0.80 | 44d | 1 | 0.51mi |
| 1912 Richmond Ave Unit 1912 Augusta, GA | 2.0 | 1.0 | 812 | $1,195 | $1.47 | 14d | 1 | 0.54mi |
| 1328 Baker Ave Augusta, GA | 2.0 | 1.0 | 761 | $975 | $1.28 | 44d | 1 | 0.59mi |
| 1530 Whitney St Unit A Augusta, GA | 2.0 | 1.0 | 960 | $925 | $0.96 | 44d | 1 | 0.60mi |
| 1610 Cornell Dr Augusta, GA | 3.0 | 1.0 | 1025 | $1,100 | $1.07 | 44d | 1 | 0.61mi |
| 1610 Cornell Dr Augusta, GA | 3.0 | 1.0 | 1025 | $1,100 | $1.07 | 23d | 1 | 0.61mi |
| 1313 Wilson St Apt C Augusta, GA | 2.0 | 2.0 | 900 | $1,350 | $1.50 | 44d | 1 | 0.66mi |
| 2219 Walden Dr Unit A6 Augusta, GA | 2.0 | 1.0 | 800 | $850 | $1.06 | 23d | 1 | 0.70mi |
| 2201 Walden Dr Augusta, GA | 2.0 | 1.0 | 1063 | $1,100 | $1.03 | 44d | 1 | 0.71mi |
| 2201 Walden Dr Unit DRIVEB2 Augusta, GA | 2.0 | 1.5 | 1063 | $1,100 | $1.03 | 44d | 1 | 0.71mi |
| 2201 Walden Dr Unit DRIVEA2 Augusta, GA | 2.0 | 1.5 | 1063 | $1,050 | $0.99 | 44d | 1 | 0.71mi |
| 936 Hickman Rd Unit 3 Augusta, GA | 2.0 | 2.0 | 875 | $1,195 | $1.37 | 14d | 1 | 0.73mi |
| 1750 Essie McIntyre Blvd Augusta, GA | 2.0 | 1.0 | 720 | $950 | $1.32 | 44d | 1 | 0.76mi |
| 1549 Craig St Unit 00 1559 Augusta, GA | 3.0 | 3.0 | 1359 | $1,600 | $1.18 | 44d | 1 | 0.76mi |
| 2120 Whitney South Dr Augusta, GA | 2.0 | 2.0 | 1118 | $1,500 | $1.34 | 44d | 1 | 0.77mi |
| 2120 Whitney South Dr Augusta, GA | 2.0 | 2.0 | 1118 | $1,500 | $1.34 | 44d | 1 | 0.77mi |
| 2476 McDowell St Augusta, GA | 2.0 | 1.5 | 1000 | $2,500 | $2.50 | 14d | 1 | 0.79mi |
| 1804 Central Ave Augusta, GA | 2.0 | 1.0 | 1200 | $1,100 | $0.92 | 23d | 1 | 0.79mi |
| 2240 Walden Dr Augusta, GA | 3.0 | 2.0 | 1107 | $1,495 | $1.35 | 23d | 1 | 0.83mi |
| 2726 Landing Loop Dr Augusta, GA | 3.0 | 2.0 | 1008 | $1,025 | $1.02 | 44d | 1 | 0.86mi |
| 19 Trapp Ct Unit 19 Augusta, GA | 2.0 | 1.5 | 1050 | $995 | $0.95 | 44d | 1 | 0.87mi |
| 1239 Holden Dr Augusta, GA | 3.0 | 1.0 | 816 | $1,095 | $1.34 | 14d | 1 | 0.93mi |
| 1712 Morgan St Augusta, GA | 3.0 | 1.0 | 1209 | $1,330 | $1.10 | 23d | 1 | 0.93mi |
Listing history 12 events
-
2026-02-27status Pending
-
2026-02-27historical
-
2026-02-27historical
-
2025-12-03$120,000 Active
-
2025-12-03$120,000
-
2025-10-28historical
-
2025-07-07historical
-
2025-06-11price $150,000
-
2025-06-11price $150,000
-
2025-05-26$370,000 New
-
2025-05-26$370,000 Active
-
1983-05-01soldstatus $44,000
ⓘ Source: listings_history table (triggers on properties + properties_extension) + one-shot
backfill from property_details.listing_events for pre-trigger history.
Tax reassessment forecast GA · Resets to sale price
- Current annual tax
- $2,026 · $169/mo
- Projected year-2 tax
- $2,026 · $169/mo
- Expected delta
- $0/yr ($0/mo · 0.0%)
ⓘ Screening estimate from a state-policy table — verify with the county assessor before closing.
Climate risk First Street
- Flood 1/10 Low FEMA zone X (unshaded) · 0% chance over 30 yrs
- Wildfire 1/10 Low
- Heat 7/10 Severe 7 d/yr ≥108°F today · 16 d/yr by 30 yrs out
- Wind 6/10 Major 72% chance of damaging wind over 30 yrs
- Air quality 4/10 Moderate 4 unhealthy d/yr today · 4 by 30 yrs out
Nearby sold comps map
Loading sold comps map…
Walkable amenities ~0.75 mi
Loading nearby amenities…
Taxation est. · year 1
- Rental income
- $16,848
- − Mortgage interest
- −$6,722
- − Property taxes
- −$2,026
- − Insurance
- −$600
- − Repairs & maintenance
- −$1,348
- − Management
- −$1,348
- − Depreciation
- −$3,491
- Taxable income
- $1,314
- Est. tax owed @ 24.0%
- −$315
- After-tax cash flow
- $2,817/yr
For passive investors: Depreciation is non-cash, so a rental often shows a tax loss while cash-flowing — sheltering income. Rental losses are passive: they offset passive income freely, and up to $25,000/yr can offset ordinary (W-2) income if you actively participate and your MAGI is under $100k (phasing out to $0 by $150k); unused losses carry forward. On sale, claimed depreciation is recaptured at up to 25%, and gains may owe capital-gains tax (a 1031 exchange can defer both). Figures are a year-1 estimate at your 24.0% rate — not tax advice; consult a CPA.
Schools (NCES district)
- District
- Richmond County
- NCES district ID
- 1304380
- Math proficiency
- 12% ▼ -9.00%
- Reading proficiency
- 20% ▼ -6.00%
- Median HH income
- $38,069
- Composite
- 13.43/100
- National rank
- #9524
- State rank
- #154 of 174 in GA
Livability — Augusta-Richmond County consolidated government (balance)
No livability data for this city. (Only ~50 U.S. cities are tracked.)
Census & demographics
- Census place
- Augusta-Richmond County consolidated government (balance), GA
- County
- Richmond County · 190,917 people
- City population
- 154,035
- Metro
- Augusta-Richmond County, GA-SC
- Population (ZIP)
- 23,400
- Household income
- $46,696
- Rent vs Own
- Severe rent burden
- 1594.0
Population outlook (Richmond County) Hauer SSP2
- Today (2025)
- 200,753 people
- By 2030
- 200,232 · -0.3%
- By 2040
- 196,813 · -2.0%
- By 2050
- 190,347 · -5.2%
- By 2075
- 172,496 · -14.1%
- By 2100
- 146,284 · -27.1%
Race, ethnicity, and origin ACS 2023
- Neighborhood character
- Diverse neighborhood (Simpson 0.61)
- Race & ethnicity
- Black 47% White 41% Hispanic / Latino 6% Two or more races 6% Asian 2%
- Hispanic origin (detail)
- Mexican 1%
- Common ancestry
- Italian 1% Slovak 1% Romanian 1%
- Foreign-born
- 3% · Canada, South Korea, Jamaica
- Languages at home
- 93% English-only · Spanish 4% Korean 1%
Political lean MEDSL · Richmond
- 2024 margin
- Solid D (+36.1) · D 67.8% · R 31.7%
- 2008→2024 swing
- +4.3pp toward D · 2008: 31.8pp · 2024: 36.1pp
- All cycles
- 2024: D+36.1 2020: D+37.2 2016: D+32.4 2012: D+33.8 2008: D+31.8
Not yet ingested
- Civics
- —
Market trends
- HPI YoY
- ▼ -211.97%
- Current HPI
- 199.0807
- Rent YoY
- ▲ 4.29%
- Metro
- Augusta-Richmond County, GA-SC
- State GDP YoY
- ▲ 2.66%
- F500 in state
- 28
Industry mix (Fortune 500 HQ in GA)
| Industry | F500 HQs | Revenue |
|---|---|---|
| Paper / Packaging | 2 | $29B |
|
||
| Retail | 1 | $160B |
|
||
| Transportation / Logistics | 1 | $91B |
|
||
| Airlines | 1 | $62B |
|
||
| Consumer Goods | 1 | $47B |
|
||
| Utilities | 1 | $25B |
|
||
Price history
+172.7% since first listed12 events — show timeline
- 2026-02-27 Pending — Hive MLS
- 2026-02-27 Listing Removed — Hive MLS
- 2026-02-27 Listing Removed — Hive MLS
- 2025-12-03 Listed $120,000 Hive MLS
- 2025-12-03 Listed $120,000 Hive MLS
- 2025-10-28 Listing Removed — GAMLS
- 2025-07-07 Listing Removed — FMLS
- 2025-06-11 Price Changed $150,000 FMLS
- 2025-06-11 Price Changed $150,000 GAMLS
- 2025-05-26 Listed $370,000 FMLS
- 2025-05-26 Listed $370,000 GAMLS
- 1983-05-01 Sold (Public Records) $44,000 Public Records
Property tax history
+3.8%/yrLatest (2025): $2,026 · +10.5% YoY. Source: county tax records.
Cash-flow waterfall
monthlySold comps — $/sqft
last 12 mo · ≤1 miLoading sold comps…