 🏗️ New Construction
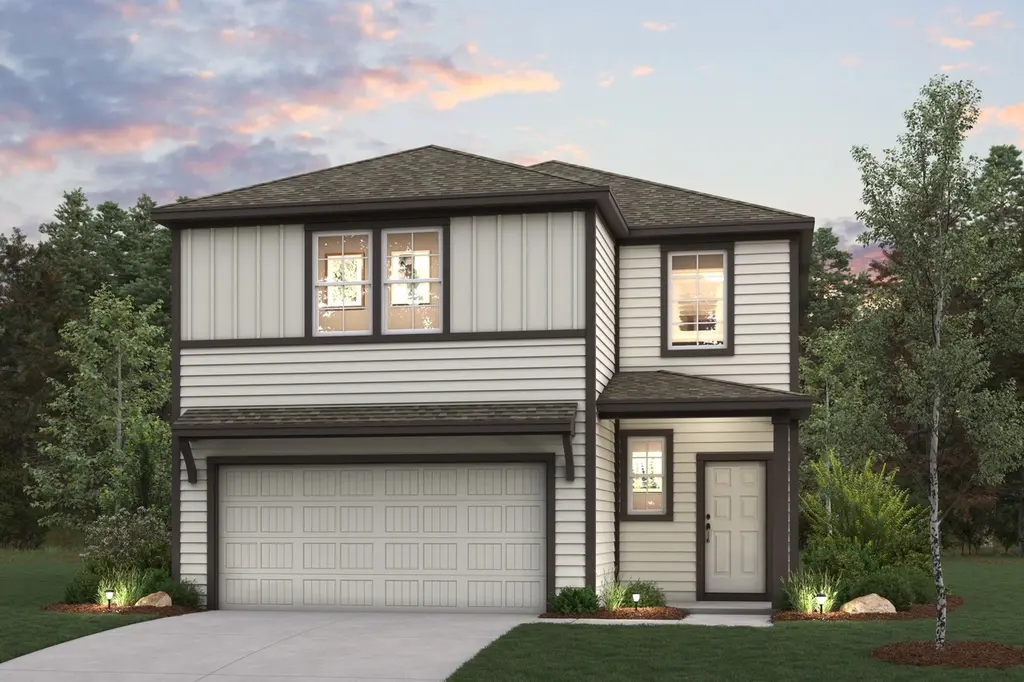
BRISTOL Plan · Pattison, TX
Flood risk 6/10 · Moderate
- FEMA flood zone
- X (unshaded)
- Chance of flooding over 30 yrs
- 0.7%
- Est. flood insurance / yr
- $507 – $1,088
Fire risk 5/10 · Moderate
- Est. fire insurance / yr
- $1,222 – $2,270
Heat risk 8/10 · Major
- Hot days now (above 111°F)
- 7 days/yr
- Hot days in 30 yrs
- 22 days/yr
Wind risk 9/10 · Severe
- Chance of severe wind over 30 yrs
- 99.0%
Air-quality risk 2/10 · Minimal
- Unhealthy air days now
- 1 days/yr
- Unhealthy air days in 30 yrs
- 1 days/yr
Risk factors via First Street. Map © Google.
Why this score? — see what drove the F grade
The composite is a weighted blend of 9 inputs, each scored 0–100. Each bar is that input's sub-score; the figure is the points it added to the 100-point composite (weight × sub-score).
- ARV discount +7.5/15.0
- Cash flow +6.9/30.0
- Condition / age +4.0/5.0
- Livability +3.2/5.0
- Rent growth +2.2/5.0
- Schools +2.0/10.0
- 1% rule +1.8/10.0
- DSCR +1.1/10.0
- Appreciation +0.0/10.0
$299,990
🖨 Deal sheet (PDF) 📄 Offer letter ✓ Due diligence
Listing remarks MLS
The two-story Bristol floor plan is the answer for the home buyer looking for a spacious home to meet their needs. The primary suite is privately situated on the first floor, separate from the secondary bedrooms in the home. The 5th bedroom is also located on the first floor, offering flexibility in how to use the space - if not an additional bedroom, a home office or nursery are some ideas that come to mind! Combined formals with an island kitchen make the Bristol a modern open-concept design that is so popular with today's home buyer. And the upstairs gameroom offers a secondary entertainment space for the home.
Key facts
- Island kitchen
- Primary suite
- Upstairs gameroom
Tags
Neighborhood map
What this means for you Summary
Snapshot
- This is a 5-bed/2.5-bath single-family listed at $300k. Condition is rated good.
Deal economics
- At list price, monthly cash flow is $-547 ($-7k/yr) — negative.
- To cash-flow at today's rent, offer at most $283k (5.6% below list).
- To meet the 1% rule (rent ≥ 1% of price), the offer needs to be $248k (17.4% below list).
- Recommended offer: $248k (17.4% below list) — sets the bar for 1% rule.
Location & tenants
- Location reads 63/100 on livability (#876 in TX) — a middle-class / working-renter tenant base. Strengths: housing A+, crime A, cost of living A; Watch: amenities F, commute F, health & safety F.
- Royal ISD (rural): math 23% / reading 23% proficiency, ranked #744 of 826 in TX (top 90%) — low school quality limits family demand, transient renter base, plan for 1-2y turnover; 77% free/reduced lunch — lower-income household profile, screen leases tightly.
- Zoned schools: Royal El (math 27% / reading 20%, grade F, #3,247 of 4,322 statewide, top 76%, 762 students, 78% FRL); Royal J H (math 22% / reading 23%, grade F, #1,341 of 1,662 statewide, top 82%, 593 students, 73% FRL); Royal H S (math 17% / reading 26%, grade F, #1,377 of 1,632 statewide, top 85%, 842 students, 71% FRL) — zoned schools at 74% FRL track the district average.
- Market conditions: Rents soft (-1.0%/yr); 1014 active listings in the ZIP; solid renter incomes; 483 units permitted in Waller County in 2024 (89 in 5+ unit buildings).
- This rent runs 35% of the median local income ($84k/yr) — at the standard rent-burdened threshold; future hikes will face affordability resistance.
Forward outlook
- Local home prices are declining (-3.0%/yr); year-one equity from $3k of loan paydown is wiped out by about $11k of value loss. Plan a longer hold.
- Waller County population projected at +62% by 2050 — long-run rental-demand tailwind backs the buy-and-hold thesis.
Negotiation context
- It's been on market 67 days — a 6% lower offer ($282k) is reasonable based on typical stale-listing flexibility.
Risks & watch-outs
- Climate carrying-cost: major flood risk; severe wind risk, 99% chance of damaging wind over 30y; moderate wildfire risk; extreme-heat days projected 7→22/yr by 2055 (HVAC capex compounding) — expect insurance premiums to compound above CPI over the hold.
Questions for the listing agent
- What do current leases actually rent for vs. the listed asking? Can we see a recent rent roll and the last 12 months of T-12 income?
- It's been on market 67 days. Have you received any prior offers? Is the seller open to a 17% concession, seller financing, or rate buy-down credit?
- Why hasn't it sold? Are there any deal-killer items the seller is aware of (foundation, flood, title, zoning, code violations)?
- Is there a deadline driving the sale (1031 exchange, divorce, estate, relocation)? That informs how much negotiation room exists.
- Schools are F-rated, which usually means shorter tenancies and higher turnover. Who's the typical renter profile here, and what's been the actual vacancy rate?
- The area grade is low — what's the realistic commute time and amenity access for the typical tenant pool here? Any planned neighborhood developments (good or bad) we should know about?
- What's the average days-on-market for RENTAL listings here right now (not sales)? A rising rental-DOM trend means longer vacancies and softer asking-rent achievability than the comps imply.
- What's the recent tenant-quality profile in this submarket — average credit score on applications, eviction rate, late-payment / NSF rate, and stable-employment percentage? A property-management company in the area should have these aggregated.
- How much new for-sale + rental construction is in the pipeline within 1–3 miles? Heavy new supply typically softens prices + rents 12–24 months out; constrained supply supports both.
Investment metrics
- 1% rule
- 0.68% ✗
- Cap rate
- 4.48%
- Cash-on-cash
- -6.47%
- DSCR
- 0.71
- GRM
- 12.2
CMA / ARV
- ARV (median comp)
- $362,325
- List price
- $299,990
- Delta
- -17.20%
- Verdict
- UNDERPRICED
- Comps
- 20 within 2.0 mi
Projected returns pro-forma
-3.0% appreciation · 0.0% rent growth · sell at horizon
- IRR
- -30.8%
- Equity multiple
- 0.01×
- Total profit
- $-100,789
- Equity at exit
- $54,024
- IRR
- -53.6%
- Equity multiple
- -0.58×
- Total profit
- $-160,548
- Equity at exit
- $31,327
Cash invested: $101,451 (down + closing). Projections, not guarantees.
Landlord ↔ Tenant lean methodology
- Overall (STATE)
- 87 Strongly Landlord-Friendly
- State Texas
- 87 Strongly Landlord-Friendly · R+5
- County
- — inherits STATE
- City
- — inherits STATE
ZIP-level market 77423
- Rents YoY
- -1.0%
- Active inventory
- 1014
- Price-to-rent
- 10.1×
Monthly cashflow live
- Estimated rent
- $2,477 medium interval (Pro) →
- Mortgage (P&I)
- −$1,900
- Tax est. 1.5%
- −$453 /mo · $5,435/yr
- Insurance
- −$151
- HOA
- −$0
- Vacancy / Maint / Mgmt
- −$520
- Net cashflow
- $-547
Break-even live
Sensitivity live
| Price | -10% $-297 | -5% $-422 | +0% $-547 | +5% $-672 | +10% $-798 |
|---|---|---|---|---|---|
| Rent | -10% $-743 | -5% $-645 | +0% $-547 | +5% $-449 | +10% $-352 |
| Rate | -1.0pp $-365 | -0.5pp $-455 | base $-547 | +0.5pp $-641 | +1.0pp $-737 |
UW: 25.0% down · 7.5% · 30yr · 1.5% tax · 5.0% vac · 8.0% maint · 8.0% mgmt
Financing live
Cash to close
- Down payment
- $90,581
- Closing costs
- $10,870
- Reserves months
- —
- Total cash needed
- —
Loan-product check · same deal, 3 products live
Conventional
25% down · 7.5% · 30yr
- Down + closing
- —
- Monthly P&I
- —
- Monthly cashflow
- —
- DSCR
- —
- Eligible?
- —
Personal DTI + credit; lowest rate.
DSCR
20% down · 8.5% · 30yr
- Down + closing
- —
- Monthly P&I
- —
- Monthly cashflow
- —
- DSCR
- —
- Eligible?
- —
No personal income docs; deal must DSCR.
Hard money
10% down · 12.0% · 12mo
- Down + closing
- —
- Monthly P&I
- —
- Monthly cashflow
- —
- DSCR
- —
- Eligible?
- —
Short-term bridge; refi at stabilization.
Listing history 15 events
-
2026-06-21days on market $299,990 Active 67 DOM
-
2026-06-18days on market $299,990 Active 64 DOM
-
2026-06-17days on market $299,990 Active 63 DOM
-
2026-06-16days on market $299,990 Active 62 DOM
-
2026-06-15days on market $299,990 Active 61 DOM
-
2026-06-13days on market $299,990 Active 59 DOM
-
2026-06-10days on market $299,990 Active 55 DOM
-
2026-06-08days on market $299,990 Active 54 DOM
-
2026-06-07days on market $299,990 Active 53 DOM
-
2026-06-04days on market $299,990 Active 50 DOM
-
2026-06-03days on market $299,990 Active 49 DOM
-
2026-06-02days on market $299,990 Active 48 DOM
-
2026-06-01days on market $299,990 Active 47 DOM
-
2026-05-31days on market $299,990 Active 46 DOM
-
2026-04-15$299,990 Active 621-char remark
Show marketing remark (621 chars)
The two-story Bristol floor plan is the answer for the home buyer looking for a spacious home to meet their needs. The primary suite is privately situated on the first floor, separate from the secondary bedrooms in the home. The 5th bedroom is also located on the first floor, offering flexibility in how to use the space - if not an additional bedroom, a home office or nursery are some ideas that come to mind! Combined formals with an island kitchen make the Bristol a modern open-concept design that is so popular with today's home buyer. And the upstairs gameroom offers a secondary entertainment space for the home.
ⓘ Source: listings_history table (triggers on properties + properties_extension) + one-shot
backfill from property_details.listing_events for pre-trigger history.
Climate risk First Street
- Flood 6/10 Major FEMA zone X (unshaded) · 70% chance over 30 yrs
- Wildfire 5/10 Major
- Heat 8/10 Severe 7 d/yr ≥111°F today · 22 d/yr by 30 yrs out
- Wind 9/10 Extreme 99% chance of damaging wind over 30 yrs
- Air quality 2/10 Low 1 unhealthy d/yr today · 1 by 30 yrs out
Nearby sold comps map
Loading sold comps map…
Walkable amenities ~0.75 mi
Loading nearby amenities…
Taxation est. · year 1
- Rental income
- $29,722
- − Mortgage interest
- −$20,296
- − Property taxes
- −$5,435
- − Insurance
- −$1,812
- − Repairs & maintenance
- −$2,378
- − Management
- −$2,378
- − Depreciation
- −$10,540
- Taxable loss
- −$13,117
- Est. tax savings @ 24.0%
- +$3,148
- After-tax cash flow
- $-3,419/yr
For passive investors: Depreciation is non-cash, so a rental often shows a tax loss while cash-flowing — sheltering income. Rental losses are passive: they offset passive income freely, and up to $25,000/yr can offset ordinary (W-2) income if you actively participate and your MAGI is under $100k (phasing out to $0 by $150k); unused losses carry forward. On sale, claimed depreciation is recaptured at up to 25%, and gains may owe capital-gains tax (a 1031 exchange can defer both). Figures are a year-1 estimate at your 24.0% rate — not tax advice; consult a CPA.
Condition & rehab AI · 2 photos
The Bristol floor plan is a well-maintained and move-in-ready home with good condition and potential for further value enhancement through minor upgrades.
Value-add opportunities
- Both Painting the exterior and interior walls — Fresh paint can enhance curb appeal and interior aesthetics.
- Both Landscaping improvements — Enhanced landscaping can improve curb appeal and attract more potential buyers/tenants.
- Resale Upgrading the flooring in the bathrooms — Modern flooring can significantly increase the home's resale value.
- Resale Upgrading the kitchen appliances — Modern appliances can increase the home's appeal to potential buyers.
- Both Upgrading the lighting fixtures — Modern lighting can improve the home's curb appeal and interior aesthetics.
- Both Upgrading the HVAC system — A more efficient HVAC system can improve comfort and energy efficiency, attracting more potential buyers/tenants.
- Both Upgrading the windows — Upgraded windows can improve energy efficiency and curb appeal.
- Both Upgrading the exterior siding — Fresh siding can improve curb appeal and increase the home's resale value.
- Both Upgrading the landscaping — A well-maintained and aesthetically pleasing landscape can attract more potential buyers/tenants and increase the home's resale value.
Renovation cost estimate screening
Value-add ROI direction
- Both Painting the exterior and interior walls — Fresh paint can enhance curb appeal and interior aesthetics. ↑
- Both Landscaping improvements — Enhanced landscaping can improve curb appeal and attract more potential buyers/tenants. ↑
- Resale Upgrading the flooring in the bathrooms — Modern flooring can significantly increase the home's resale value. ↑
- Resale Upgrading the kitchen appliances — Modern appliances can increase the home's appeal to potential buyers. ↑
- Both Upgrading the lighting fixtures — Modern lighting can improve the home's curb appeal and interior aesthetics. ↑
- Both Upgrading the HVAC system — A more efficient HVAC system can improve comfort and energy efficiency, attracting more potential buyers/tenants. ↑
- Both Upgrading the windows — Upgraded windows can improve energy efficiency and curb appeal. ↑
- Both Upgrading the exterior siding — Fresh siding can improve curb appeal and increase the home's resale value. ↑
- Both Upgrading the landscaping — A well-maintained and aesthetically pleasing landscape can attract more potential buyers/tenants and increase the home's resale value. ↑
ⓘ Cost ranges are severity-bucket heuristics (US national rule-of-thumb). Get contractor quotes + a written scope before underwriting a rehab budget.
Schools (NCES district)
- District
- Royal ISD
- NCES district ID
- 4838190
- Math proficiency
- 23% ▼ -11.00%
- Reading proficiency
- 23% ▼ -6.00%
- Median HH income
- $41,059
- Composite
- 19.55/100
- National rank
- #8760
- State rank
- #744 of 826 in TX
Livability — Pattison
- Score
- 63/100
- State rank
- #876
- US rank
- #15789
Category grades
Schools grade is shown separately in the Schools card above.
Census & demographics
- County
- Waller County · 18,767 people
- Metro
- Houston-The Woodlands-Sugar Land, TX
- Population (ZIP)
- 18,767
- Household income
- $84,490
- Rent vs Own
- Severe rent burden
- 20.0
Population outlook (Waller County) Hauer SSP2
- Today (2025)
- 60,772 people
- By 2030
- 67,616 · +11.3%
- By 2040
- 82,283 · +35.4%
- By 2050
- 98,276 · +61.7%
- By 2075
- 142,860 · +135.1%
- By 2100
- 175,596 · +188.9%
Race, ethnicity, and origin ACS 2023
- Neighborhood character
- Diverse neighborhood (Simpson 0.64)
- Race & ethnicity
- Hispanic / Latino 41% White 41% Black 14% Two or more races 13% Asian 2% Native American 1%
- Hispanic origin (detail)
- Mexican 30% Cuban 2%
- Common ancestry
- Lithuanian 2% Italian 2% Slovak 1%
- Foreign-born
- 17% · Canada, China, Dominican Republic
- Languages at home
- 65% English-only · Spanish 32% French/Haitian/Cajun 1% Other Indo-European 1%
Political lean MEDSL · Waller
- 2024 margin
- Strong R (+25.0) · D 37.0% · R 62.0% · Other 1.0%
- 2008→2024 swing
- -17.9pp toward R · 2008: -7.2pp · 2024: -25.0pp
- All cycles
- 2024: R+25.0 2020: R+26.7 2016: R+28.6 2012: R+17.6 2008: R+7.2
Not yet ingested
- Civics
- —
Market trends
- HPI YoY
- ▼ -125.28%
- Current HPI
- 204.8709
- Rent YoY
- ▼ -1.01%
- Metro
- Houston-The Woodlands-Sugar Land, TX
- State GDP YoY
- ▲ 3.95%
- F500 in state
- 110
Industry mix (Fortune 500 HQ in TX)
| Industry | F500 HQs | Revenue |
|---|---|---|
| Energy | 16 | $1,198B |
|
||
| Technology | 5 | $198B |
|
||
| Engineering / Construction | 4 | $72B |
|
||
| Energy Services | 3 | $60B |
|
||
| Utilities | 3 | $41B |
|
||
| Healthcare | 2 | $330B |
|
||
Price history
1 event — show timeline
- 2026-04-15 Listed $299,990 Zillow
Cash-flow waterfall
monthlySold comps — $/sqft
last 12 mo · ≤1 miLoading sold comps…