 Multi-family
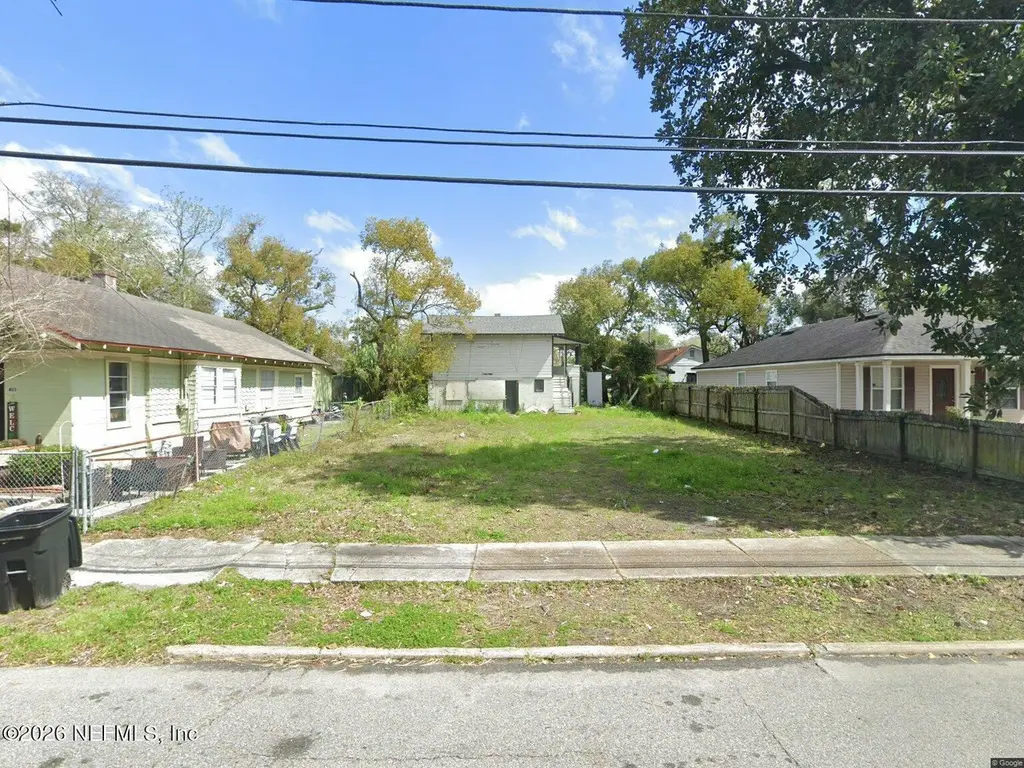
409 Crystal St · Jacksonville, FL
Flood risk 1/10 · Minimal
- FEMA flood zone
- X (unshaded)
- Chance of flooding over 30 yrs
- 0.0%
- Est. flood insurance / yr
- $507 – $1,088
Fire risk 2/10 · Minimal
- Est. fire insurance / yr
- $947 – $1,759
Heat risk 9/10 · Severe
- Hot days now (above 107°F)
- 7 days/yr
- Hot days in 30 yrs
- 20 days/yr
Wind risk 9/10 · Severe
- Chance of severe wind over 30 yrs
- 99.0%
Air-quality risk 5/10 · Moderate
- Unhealthy air days now
- 7 days/yr
- Unhealthy air days in 30 yrs
- 7 days/yr
Risk factors via First Street. Map © Google.
Why this score? — see what drove the B- grade
The composite is a weighted blend of 9 inputs, each scored 0–100. Each bar is that input's sub-score; the figure is the points it added to the 100-point composite (weight × sub-score).
- Cash flow +26.5/30.0
- DSCR +9.0/10.0
- ARV discount +7.5/15.0
- 1% rule +6.7/10.0
- Appreciation +6.7/10.0
- Livability +4.2/5.0
- Schools +3.9/10.0
- Rent growth +2.9/5.0
- Condition / age +2.5/5.0
$85,000
🖨 Deal sheet 📄 Offer letter ✓ Due diligence
Multi-family units
County records classify this as Multi-Family (5+ Unit). Listing-text estimate: 1 unit. estimate disagrees with records
5+ unit building — per-unit beds/baths from public records are typically unavailable; the breakdown below (if shown) is an estimate from the listing text.
Listing remarks
Investor Special! Great opportunity to renovate and add value to this duplex in Jacksonville. Ideal for investors looking to expand their portfolio, generate rental income, or pursue a fix-and-hold strategy. Property needs updates and repairs but offers strong potential for increased cash flow and appreciation. Conveniently located near downtown Jacksonville, major highways, shopping, schools, and employment centers. With two units and plenty of upside, this property is a blank canvas ready for your vision. Property is being sold As-Is. Buyer to verify all information, measurements, zoning, and intended use. Don't miss this chance to transform a value-add property into a profitable investme
Key facts
- Employment centers
- Shopping
- Schools
Tags
Property features AI
Finance
- HOA & community: Not a senior community
Exterior
- Parking: Other parking
- Utilities: Electricity available; Sewer available
- Home design: Single Family Residence; Used for residential purposes
- Exterior features: Residential single-family home; No private pool
Interior
- Bedrooms: 1 bedroom
- Bathrooms: 1 full bathroom
- Heating & cooling: No heating; No cooling
- Interior features: No built-in appliances listed
Neighborhood map
What this means for you Summary
Snapshot
- This is a 1-bed/1.0-bath multifamily listed at $85k.
Deal economics
- At list price, monthly cash flow is $224 ($3k/yr) — positive.
- The deal already cash-flows at list — no discount required.
- Meets the 1% rule at list price ($997 rent vs $85k).
- Recommended offer: $84k (1.5% below list) — sets the bar for market timing.
- Cap rate 9.5% vs local median 4.0% in Jacksonville — top-decile yield for the area; either an underpriced asset or a hidden risk that comps aren't pricing in. Stress-test before assuming the spread holds.
Location & tenants
- Location reads 83/100 on livability (#50 in FL, #911 nationally) — a professional / high-income tenant draw. Strengths: amenities A+, commute A+, housing A+.
- Duval (urban): math 46% / reading 45% proficiency, ranked #48 of 73 in FL (top 66%) — families likely to look elsewhere, expect single-tenant / working-renter base with shorter leases.
- Market conditions: Rents rising (+1.7%/yr); 172 active listings in the ZIP; 40 comparable units currently listed for rent nearby; rentals at typical pace (median 17d on market — plan ~3-4 weeks tenant-placement turnaround); lower-income renter base — watch delinquency; 6,503 units permitted in Duval County in 2024 (1,131 in 5+ unit buildings).
- This rent runs 34% of the median local income ($35k/yr) — at the standard rent-burdened threshold; future hikes will face affordability resistance.
Forward outlook
- In year one you build about $3k of equity ($588 loan paydown + $3k appreciation (3.4% local appreciation)).
- Duval County population projected at +19% by 2050 — long-run rental-demand tailwind backs the buy-and-hold thesis.
- At projected returns (3.4% appreciation + 1.7% rent growth), your $24k cash investment doubles in ~4 years — after that, you're playing with house money.
- By year 10, paydown + projected appreciation supports a ~$34k cash-out refi (75% LTV) — recoverable capital for the next deal without selling this one.
Negotiation context
- It's been on market 19 days — a 2% lower offer ($84k) is reasonable based on typical stale-listing flexibility.
Risks & watch-outs
- Watch-outs: built in 1951 — expect roof / HVAC / electrical / plumbing capex.
- Climate carrying-cost: severe wind risk, 99% chance of damaging wind over 30y; extreme-heat days projected 7→20/yr by 2055 (HVAC capex compounding) — expect insurance premiums to compound above CPI over the hold.
Questions for the listing agent
- Built in 1951 — when were the roof, HVAC, electrical panel, plumbing, and water heater last replaced?
- Is there a deadline driving the sale (1031 exchange, divorce, estate, relocation)? That informs how much negotiation room exists.
- Schools are B-rated — typically a magnet for longer-tenancy family renters. What's the average tenant stay here, and is there a school-zone premium baked into asking?
- What's the average days-on-market for RENTAL listings here right now (not sales)? A rising rental-DOM trend means longer vacancies and softer asking-rent achievability than the comps imply.
- What's the recent tenant-quality profile in this submarket — average credit score on applications, eviction rate, late-payment / NSF rate, and stable-employment percentage? A property-management company in the area should have these aggregated.
- How much new apartment / multifamily construction is in the pipeline within 1–3 miles? Heavy new supply (>2% of stock underway) typically softens rents 12–24 months out; light construction supports rent growth.
Investment metrics
- 1% rule
- 1.17% ✓
- Cap rate
- 9.46%
- Cash-on-cash
- 11.31%
- DSCR
- 1.50
- GRM
- 7.1
CMA / ARV
No comps found within radius.
Projected returns pro-forma
3.41% appreciation · 1.7% rent growth · sell at horizon
- IRR
- 18.3%
- Equity multiple
- 2.06×
- Total profit
- $25,111
- Equity at exit
- $40,211
- IRR
- 18.7%
- Equity multiple
- 3.75×
- Total profit
- $65,419
- Equity at exit
- $63,564
Cash invested: $23,800 (down + closing). Projections, not guarantees.
Landlord ↔ Tenant lean methodology
- Overall (STATE)
- 87 Strongly Landlord-Friendly
- State Florida
- 87 Strongly Landlord-Friendly · R+3
- County
- — inherits STATE
- City
- — inherits STATE
ZIP-level market 32254
- Home prices YoY
- 1.2%
- Rents YoY
- 1.7%
- Active inventory
- 172
- Price-to-rent
- 7.1×
Monthly cashflow live
- Estimated rent
- $997 high interval (Pro) →
- Mortgage (P&I)
- −$446
- Tax from tax record
- −$82 /mo · $982/yr
- Insurance
- −$35
- HOA
- −$0
- Vacancy / Maint / Mgmt
- −$209
- Net cashflow
- $224
Break-even live
UW: 25.0% down · 7.5% · 30yr · 1.5% tax · 5.0% vac · 8.0% maint · 8.0% mgmt
Financing live
Cash to close
- Down payment
- $21,250
- Closing costs
- $2,550
- Reserves months
- —
- Total cash needed
- —
Loan-product check · same deal, 3 products live
Conventional
25% down · 7.5% · 30yr
- Down + closing
- —
- Monthly P&I
- —
- Monthly cashflow
- —
- DSCR
- —
- Eligible?
- —
Personal DTI + credit; lowest rate.
DSCR
20% down · 8.5% · 30yr
- Down + closing
- —
- Monthly P&I
- —
- Monthly cashflow
- —
- DSCR
- —
- Eligible?
- —
No personal income docs; deal must DSCR.
Hard money
10% down · 12.0% · 12mo
- Down + closing
- —
- Monthly P&I
- —
- Monthly cashflow
- —
- DSCR
- —
- Eligible?
- —
Short-term bridge; refi at stabilization.
Rent comps 40 comps
| Address | Beds | Baths | Sqft | Rent | $/sqft | DOM | Units | Dist |
|---|---|---|---|---|---|---|---|---|
| 2551 Calvin St Jacksonville, FL | 2.0 | 1.0 | 658 | $600 | $0.91 | 17d | 1 | 0.29mi |
| 2549 Calvin St Jacksonville, FL | 2.0 | 1.0 | 658 | $600 | $0.91 | 17d | 1 | 0.29mi |
| 2920 Dellwood Ave Unit 4 Jacksonville, FL | 1.0 | 1.0 | 650 | $900 | $1.38 | 10d | 1 | 0.61mi |
| 2920 Dellwood Ave #2 Jacksonville, FL | 1.0 | 1.0 | 650 | $900 | $1.38 | 7d | 1 | 0.61mi |
| 2613 Green St Jacksonville, FL | 2.0 | 1.0 | 665 | $1,150 | $1.73 | 20d | 1 | 0.64mi |
| 2611 Green St Jacksonville, FL | 2.0 | 1.0 | 728 | $1,195 | $1.64 | 23d | 1 | 0.64mi |
| 2611 Green St Jacksonville, FL | 2.0 | 1.0 | 728 | $1,195 | $1.64 | 14d | 1 | 0.64mi |
| 2659 College St Jacksonville, FL | 1.0 | 1.0 | 639 | $995 | $1.56 | 23d | 1 | 0.68mi |
| 2851 College St Unit 1 Jacksonville, FL | 1.0 | 1.0 | 655 | $1,100 | $1.68 | 23d | 1 | 0.69mi |
| 2853 College St Unit 1 Jacksonville, FL | 1.0 | 1.0 | 655 | $1,100 | $1.68 | 23d | 1 | 0.69mi |
| 2619 College St Unit 2 Jacksonville, FL | 1.0 | 1.0 | 700 | $1,050 | $1.50 | 23d | 1 | 0.70mi |
| 2889 College St Jacksonville, FL | — | 1.0 | 642 | $1,000 | $1.56 | 23d | 1 | 0.71mi |
| 2892 College St Unit 2892-2 Jacksonville, FL | 1.0 | 1.0 | 700 | $1,195 | $1.71 | 17d | 1 | 0.74mi |
| 931 Rubel St Unit 14 Jacksonville, FL | — | 1.0 | 400 | $900 | $2.25 | 23d | 1 | 0.75mi |
| 931 Rubel St Unit 4 Jacksonville, FL | — | 1.0 | 400 | $950 | $2.38 | 4d | 1 | 0.75mi |
| 2877 Post St Unit 07 Jacksonville, FL | 1.0 | 1.0 | 650 | $995 | $1.53 | 17d | 1 | 0.77mi |
| 2359 College St #4 Jacksonville, FL | — | 1.0 | 500 | $1,100 | $2.20 | 23d | 1 | 0.78mi |
| 2908 Post St Apt 3 Jacksonville, FL | 1.0 | 1.0 | 720 | $995 | $1.38 | 14d | 1 | 0.82mi |
| 2908 Post St Unit 6 Jacksonville, FL | 1.0 | 1.0 | 500 | $895 | $1.79 | 14d | 1 | 0.82mi |
| 2908 Post St Unit 4 Jacksonville, FL | 1.0 | 1.0 | 720 | $995 | $1.38 | 2d | 1 | 0.82mi |
| 3236 Phyllis St Unit 3244 Jacksonville, FL | 2.0 | 1.0 | 720 | $850 | $1.18 | 23d | 1 | 0.88mi |
| 3250 Phyllis St Jacksonville, FL | 2.0 | 1.0 | 720 | $850 | $1.18 | 23d | 1 | 0.90mi |
| 1052 Willow Branch Ave #2 Jacksonville, FL | 1.0 | 1.0 | 730 | $891 | $1.22 | 23d | 1 | 0.93mi |
| 2153 Post St Jacksonville, FL | 1.0 | 1.0 | 540 | $875 | $1.62 | 23d | 1 | 0.94mi |
| 1098 Cherry St Unit 1 Jacksonville, FL | 1.0 | 1.0 | 700 | $1,250 | $1.79 | 17d | 1 | 0.95mi |
| 2725 Herschel St Jacksonville, FL | 1.0 | 1.0 | 660 | $921 | $1.40 | 2d | 1 | 1.01mi |
| 1606 King St Apt 2 Jacksonville, FL | 1.0 | 1.0 | 650 | $1,200 | $1.85 | 23d | 1 | 1.03mi |
| 1606 King St #1 Jacksonville, FL | 1.0 | 1.0 | 650 | $1,200 | $1.85 | 14d | 1 | 1.03mi |
| 2752 Herschel St #2 Jacksonville, FL | 1.0 | 1.0 | 750 | $1,050 | $1.40 | 2d | 1 | 1.06mi |
| 2775 Herschel St Unit 7 Jacksonville, FL | 1.0 | 1.0 | 700 | $1,050 | $1.50 | 10d | 1 | 1.06mi |
| 2775 Herschel St Unit 7 Jacksonville, FL | 1.0 | 1.0 | 700 | $1,050 | $1.50 | 3d | 1 | 1.06mi |
| 2960 Remington St #8 Jacksonville, FL | 1.0 | 1.0 | 500 | $950 | $1.90 | 23d | 1 | 1.09mi |
| 3233 Post St Jacksonville, FL | 2.0 | 1.0 | 750 | $1,095 | $1.46 | 23d | 1 | 1.09mi |
| 2966 Remington St #4 Jacksonville, FL | 1.0 | 1.0 | 650 | $1,100 | $1.69 | 14d | 1 | 1.10mi |
| 2966 Remington St #4 Jacksonville, FL | 1.0 | 1.0 | 650 | $1,095 | $1.68 | 14d | 1 | 1.10mi |
| 1729 Logan St W Unit 3 Jacksonville, FL | 2.0 | 1.0 | 694 | $850 | $1.22 | 23d | 1 | 1.12mi |
| 2979 Downing St Unit 2 Jacksonville, FL | 1.0 | 1.0 | 700 | $1,250 | $1.79 | 23d | 1 | 1.13mi |
| 2979 Downing St Unit 1 Jacksonville, FL | 1.0 | 1.0 | 700 | $1,170 | $1.67 | 7d | 1 | 1.13mi |
| 1078 Day Ave Jacksonville, FL | — | 1.0 | 350 | $995 | $2.84 | 23d | 1 | 1.14mi |
| 2331 Riverside Ave Jacksonville, FL | 1.0 | 1.0 | 640 | $1,375 | $2.15 | 4d | 1 | 1.14mi |
Listing history 15 events
-
2026-06-18days on market $85,000 Active 19 DOM
-
2026-06-17days on market $85,000 Active 18 DOM
-
2026-06-16days on market $85,000 Active 17 DOM
-
2026-06-15days on market $85,000 Active 16 DOM
-
2026-06-13days on market $85,000 Active 14 DOM
-
2026-06-13days on market $85,000 Active 13 DOM
-
2026-06-10days on market $85,000 Active 10 DOM
-
2026-06-08days on market $85,000 Active 9 DOM
-
2026-06-07days on market $85,000 Active 8 DOM
-
2026-06-05days on market $85,000 Active 5 DOM
-
2026-06-03days on market $85,000 Active 4 DOM
-
2026-06-02days on market $85,000 Active 3 DOM
-
2026-06-01days on market $85,000 Active 2 DOM
-
2026-05-31remarks 699-char remark
-
2026-05-31$85,000 Active 1 DOM
ⓘ Source: listings_history table (triggers on properties + properties_extension) + one-shot
backfill from property_details.listing_events for pre-trigger history.
Tax reassessment forecast FL · Resets to sale price
- Current annual tax
- $982 · $82/mo
- Projected year-2 tax
- $982 · $82/mo
- Expected delta
- $0/yr ($0/mo · 0.0%)
ⓘ Screening estimate from a state-policy table — verify with the county assessor before closing.
Climate risk First Street
- Flood 1/10 Low FEMA zone X (unshaded) · 0% chance over 30 yrs
- Wildfire 2/10 Low
- Heat 9/10 Extreme 7 d/yr ≥107°F today · 20 d/yr by 30 yrs out
- Wind 9/10 Extreme 99% chance of damaging wind over 30 yrs
- Air quality 5/10 Major 7 unhealthy d/yr today · 7 by 30 yrs out
Nearby sold comps map
Loading sold comps map…
Walkable amenities ~0.75 mi
Loading nearby amenities…
Taxation est. · year 1
- Rental income
- $11,959
- − Mortgage interest
- −$4,761
- − Property taxes
- −$982
- − Insurance
- −$425
- − Repairs & maintenance
- −$957
- − Management
- −$957
- − Depreciation
- −$2,473
- Taxable income
- $1,405
- Est. tax owed @ 24.0%
- −$337
- After-tax cash flow
- $2,355/yr
For passive investors: Depreciation is non-cash, so a rental often shows a tax loss while cash-flowing — sheltering income. Rental losses are passive: they offset passive income freely, and up to $25,000/yr can offset ordinary (W-2) income if you actively participate and your MAGI is under $100k (phasing out to $0 by $150k); unused losses carry forward. On sale, claimed depreciation is recaptured at up to 25%, and gains may owe capital-gains tax (a 1031 exchange can defer both). Figures are a year-1 estimate at your 24.0% rate — not tax advice; consult a CPA.
Schools (NCES district)
- District
- Duval
- NCES district ID
- 1200480
- Math proficiency
- 46% ▼ -11.00%
- Reading proficiency
- 45% ▼ -4.00%
- Median HH income
- $48,987
- Composite
- 38.97/100
- National rank
- #4076
- State rank
- #48 of 73 in FL
Livability — Jacksonville
- Score
- 83/100
- State rank
- #50
- US rank
- #911
Category grades
Schools grade is shown separately in the Schools card above.
Census & demographics
- Census place
- Jacksonville, FL
- County
- Duval County · 1,015,274 people
- City population
- 979,034
- Metro
- Jacksonville, FL
- Population (ZIP)
- 13,927
- Household income
- $34,953
- Rent vs Own
- Severe rent burden
- 882.0
Population outlook (Duval County) Hauer SSP2
- Today (2025)
- 1,013,010 people
- By 2030
- 1,059,228 · +4.6%
- By 2040
- 1,141,439 · +12.7%
- By 2050
- 1,205,258 · +19.0%
- By 2075
- 1,324,282 · +30.7%
- By 2100
- 1,319,620 · +30.3%
Race, ethnicity, and origin ACS 2023
- Neighborhood character
- Diverse neighborhood (Simpson 0.56)
- Race & ethnicity
- Black 60% White 28% Two or more races 7% Hispanic / Latino 5%
- Hispanic origin (detail)
- Puerto Rican 1%
- Common ancestry
- Slovak 1% Hispanic 1% Lithuanian 1%
- Foreign-born
- 4% · Canada
- Languages at home
- 94% English-only · Spanish 4% French/Haitian/Cajun 2%
Political lean MEDSL · Duval
- 2024 margin
- Toss-up / Even · D 48.7% · R 50.1% · Other 1.2%
- 2008→2024 swing
- +0.4pp no change · 2008: -1.9pp · 2024: -1.5pp
- All cycles
- 2024: R+1.5 2020: D+3.8 2016: R+1.5 2012: R+3.6 2008: R+1.9
Not yet ingested
- Civics
- —
Market trends
- HPI YoY
- ▲ 3.41%
- Current HPI
- 282.2981
- Rent YoY
- ▲ 1.70%
- Metro
- Jacksonville, FL
- State GDP YoY
- ▲ 3.28%
- F500 in state
- 36
Industry mix (Fortune 500 HQ in FL)
| Industry | F500 HQs | Revenue |
|---|---|---|
| Industrial Technology | 2 | $29B |
|
||
| Insurance | 2 | $17B |
|
||
| Retail | 1 | $60B |
|
||
| Technology Distribution | 1 | $58B |
|
||
| Homebuilding | 1 | $35B |
|
||
| Technology Manufacturing | 1 | $35B |
|
||
Price history
+415.2% since first listed4 events — show timeline
- 2026-05-29 Listed $85,000 realMLS
- 2021-12-30 Sold (Public Records) $270,000 Public Records
- 2019-06-19 Sold (Public Records) $30,000 Public Records
- 1970-01-16 Sold (Public Records) $16,500 Public Records
Property tax history
+3.2%/yrLatest (2025): $982 · +26.8% YoY. Source: county tax records.
Cash-flow waterfall
monthlySold comps — $/sqft
last 12 mo · ≤1 miLoading sold comps…