10429 Hwy 204 · Cushing, TX
Flood risk No data
- FEMA flood zone
- —
- Chance of flooding over 30 yrs
- —
- Est. flood insurance / yr
- —
Fire risk No data
- Est. fire insurance / yr
- —
Heat risk No data
- Hot days now (above threshold)
- —
- Hot days in 30 yrs
- —
Wind risk No data
- Chance of severe wind over 30 yrs
- —
Air-quality risk No data
- Unhealthy air days now
- —
- Unhealthy air days in 30 yrs
- —
Risk factors via First Street. Map © Google.
Why this score? — see what drove the C+ grade
The composite is a weighted blend of 9 inputs, each scored 0–100. Each bar is that input's sub-score; the figure is the points it added to the 100-point composite (weight × sub-score).
- Cash flow +22.8/30.0
- ARV discount +7.5/15.0
- DSCR +7.3/10.0
- Appreciation +6.7/10.0
- 1% rule +6.0/10.0
- Schools +3.7/10.0
- Livability +3.2/5.0
- Rent growth +2.5/5.0
- Condition / age +2.5/5.0
$89,500
🖨 Deal sheet 📄 Offer letter ✓ Due diligence
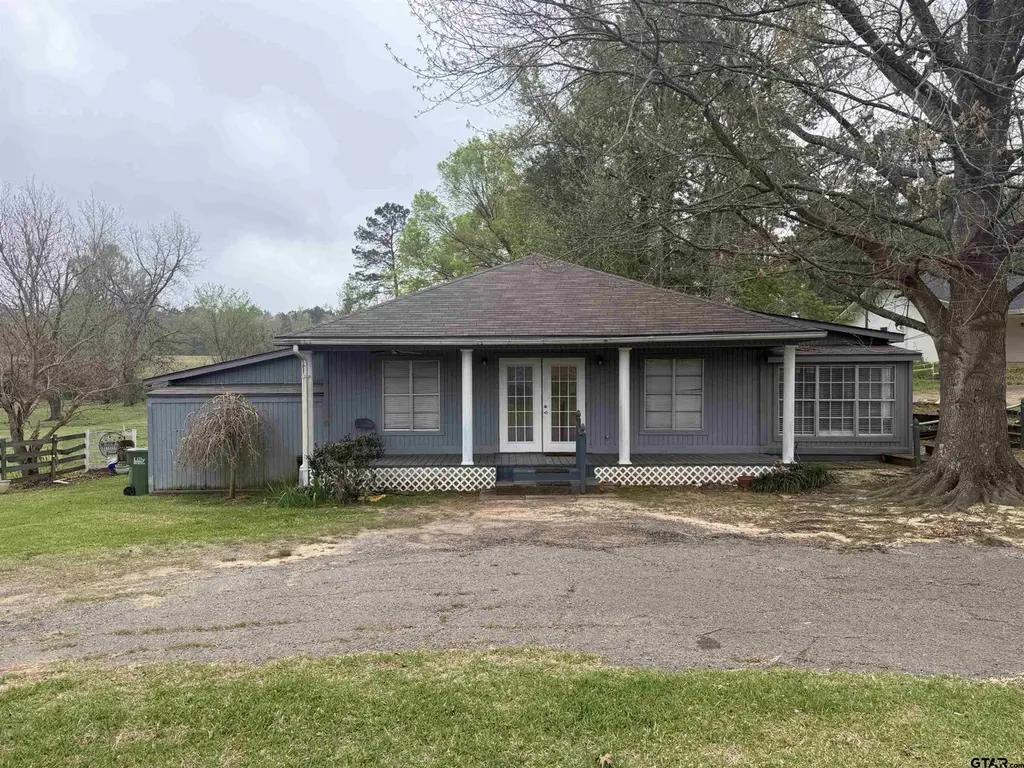
Listing remarks
Cozy and affordable 1 bedroom, 1 bathroom homes situated on a . 21 acre lot in Cushing, Texas. This property features pier and beam construction and offers great visibility and easy access to the school. Perfect for a start home, rental investment.
Key facts
- Great visibility
- Built 2011
- Listed 9 days
Tags
Neighborhood map
What this means for you Summary
Snapshot
- This is a 1-bed/1.0-bath single-family listed at $90k. Condition is rated fair.
Deal economics
- At list price, monthly cash flow is $156 ($2k/yr) — positive.
- The deal already cash-flows at list — no discount required.
- Meets the 1% rule at list price ($981 rent vs $90k).
Location & tenants
- Location reads 64/100 on livability (#768 in TX) — a middle-class / working-renter tenant base. Strengths: cost of living A+, housing A+; Watch: crime D, amenities F, commute F.
- Cushing ISD (rural): math 43% / reading 43% proficiency, ranked #302 of 826 in TX (top 37%) — families likely to look elsewhere, expect single-tenant / working-renter base with shorter leases.
- Zoned schools: Cushing El (math 37% / reading 47%, grade F, #1,335 of 4,322 statewide, top 33%, 254 students, 68% FRL); Cushing School (math 47% / reading 42%, grade F, #652 of 1,632 statewide, top 43%, 293 students, 68% FRL) — zoned schools average 68% FRL vs 51% district-wide (17 pts higher); higher-poverty schools than district average — tighter screening recommended.
- Market conditions: 19 active listings in the ZIP; 35 units permitted in Nacogdoches County in 2024 (0 in 5+ unit buildings).
Forward outlook
- In year one you build about $4k of equity ($619 loan paydown + $3k appreciation (3.4% local appreciation)).
- At projected returns (3.4% appreciation + 3.0% rent growth), your $25k cash investment doubles in ~5 years — after that, you're playing with house money.
- By year 9, paydown + projected appreciation supports a ~$31k cash-out refi (75% LTV) — recoverable capital for the next deal without selling this one.
Negotiation context
- Only 9 days on market — expect competitive offers; lowballing is unlikely to land.
Questions for the listing agent
- Have any recent inspections been done? Can we get a copy of the seller's disclosures and any deferred-maintenance estimates?
- Is there a deadline driving the sale (1031 exchange, divorce, estate, relocation)? That informs how much negotiation room exists.
- Crime grade is D in this area — have there been break-ins, vandalism, or insurance claims at this property in the last 3 years? What carrier currently insures it and at what premium?
- What's the average days-on-market for RENTAL listings here right now (not sales)? A rising rental-DOM trend means longer vacancies and softer asking-rent achievability than the comps imply.
- What's the recent tenant-quality profile in this submarket — average credit score on applications, eviction rate, late-payment / NSF rate, and stable-employment percentage? A property-management company in the area should have these aggregated.
- How much new for-sale + rental construction is in the pipeline within 1–3 miles? Heavy new supply typically softens prices + rents 12–24 months out; constrained supply supports both.
Investment metrics
- 1% rule
- 1.10% ✓
- Cap rate
- 8.39%
- Cash-on-cash
- 7.47%
- DSCR
- 1.33
- GRM
- 7.6
CMA / ARV
No comps found within radius.
Projected returns pro-forma
3.36% appreciation · 3.0% rent growth · sell at horizon
- IRR
- 15.4%
- Equity multiple
- 1.90×
- Total profit
- $22,460
- Equity at exit
- $42,075
- IRR
- 16.8%
- Equity multiple
- 3.55×
- Total profit
- $63,954
- Equity at exit
- $66,303
Cash invested: $25,060 (down + closing). Projections, not guarantees.
Landlord ↔ Tenant lean methodology
- Overall (STATE)
- 87 Strongly Landlord-Friendly
- State Texas
- 87 Strongly Landlord-Friendly · R+5
- County
- — inherits STATE
- City
- — inherits STATE
ZIP-level market 75760
- Home prices YoY
- 2.7%
- Active inventory
- 19
- Price-to-rent
- 7.6×
Monthly cashflow live
- Estimated rent
- $981 medium interval (Pro) →
- Mortgage (P&I)
- −$469
- Tax est. 1.5%
- −$112 /mo · $1,342/yr
- Insurance
- −$37
- HOA
- −$0
- Vacancy / Maint / Mgmt
- −$206
- Net cashflow
- $156
Break-even live
UW: 25.0% down · 7.5% · 30yr · 1.5% tax · 5.0% vac · 8.0% maint · 8.0% mgmt
Financing live
Cash to close
- Down payment
- $22,375
- Closing costs
- $2,685
- Reserves months
- —
- Total cash needed
- —
Loan-product check · same deal, 3 products live
Conventional
25% down · 7.5% · 30yr
- Down + closing
- —
- Monthly P&I
- —
- Monthly cashflow
- —
- DSCR
- —
- Eligible?
- —
Personal DTI + credit; lowest rate.
DSCR
20% down · 8.5% · 30yr
- Down + closing
- —
- Monthly P&I
- —
- Monthly cashflow
- —
- DSCR
- —
- Eligible?
- —
No personal income docs; deal must DSCR.
Hard money
10% down · 12.0% · 12mo
- Down + closing
- —
- Monthly P&I
- —
- Monthly cashflow
- —
- DSCR
- —
- Eligible?
- —
Short-term bridge; refi at stabilization.
Listing history 2 events
-
2026-04-08status Pending
-
2026-03-30$89,500 Active
ⓘ Source: listings_history table (triggers on properties + properties_extension) + one-shot
backfill from property_details.listing_events for pre-trigger history.
Nearby sold comps map
Loading sold comps map…
Walkable amenities ~0.75 mi
Loading nearby amenities…
Taxation est. · year 1
- Rental income
- $11,766
- − Mortgage interest
- −$5,013
- − Property taxes
- −$1,342
- − Insurance
- −$448
- − Repairs & maintenance
- −$941
- − Management
- −$941
- − Depreciation
- −$2,604
- Taxable income
- $477
- Est. tax owed @ 24.0%
- −$114
- After-tax cash flow
- $1,759/yr
For passive investors: Depreciation is non-cash, so a rental often shows a tax loss while cash-flowing — sheltering income. Rental losses are passive: they offset passive income freely, and up to $25,000/yr can offset ordinary (W-2) income if you actively participate and your MAGI is under $100k (phasing out to $0 by $150k); unused losses carry forward. On sale, claimed depreciation is recaptured at up to 25%, and gains may owe capital-gains tax (a 1031 exchange can defer both). Figures are a year-1 estimate at your 24.0% rate — not tax advice; consult a CPA.
Condition & rehab AI · 13 photos
The property requires moderate repairs and maintenance, including painting and landscaping, to improve its condition and value.
Repairs flagged
- Moderate Siding — Weathered and peeling
- Moderate Paint — Needs touch-up
Value-add opportunities
- Both Painting and repainting — Enhances curb appeal and interior aesthetics
- Both Landscaping — Improves curb appeal and enhances property value
Renovation cost estimate screening
| Repair item | Severity | Est. cost |
|---|---|---|
| Siding · Weathered and peeling | Moderate | $3,000–15,000 |
| Paint · Needs touch-up | Moderate | $3,000–15,000 |
| Total estimated repair cost · 2 items | $6,000–30,000 |
Value-add ROI direction
- Both Painting and repainting — Enhances curb appeal and interior aesthetics ↑
- Both Landscaping — Improves curb appeal and enhances property value ↑
ⓘ Cost ranges are severity-bucket heuristics (US national rule-of-thumb). Get contractor quotes + a written scope before underwriting a rehab budget.
Schools (NCES district)
- District
- Cushing ISD
- NCES district ID
- 4816080
- Math proficiency
- 43% ▼ -11.00%
- Reading proficiency
- 43% ▼ -8.00%
- Median HH income
- $48,904
- Composite
- 36.88/100
- National rank
- #4548
- State rank
- #302 of 826 in TX
Livability — Cushing
- Score
- 64/100
- State rank
- #768
- US rank
- #14009
Category grades
Schools grade is shown separately in the Schools card above.
Census & demographics
- Census place
- Cushing, TX
- Population (ZIP)
- 2,114
Population outlook (Nacogdoches County) Hauer SSP2
- Today (2025)
- 66,553 people
- By 2030
- 66,920 · +0.6%
- By 2040
- 66,833 · +0.4%
- By 2050
- 66,462 · -0.1%
- By 2075
- 65,710 · -1.3%
- By 2100
- 62,321 · -6.4%
Race, ethnicity, and origin ACS 2023
- Neighborhood character
- Predominantly White (81%)
- Race & ethnicity
- White 81% Hispanic / Latino 8% Two or more races 7% Black 6% Pacific Islander 1%
- Hispanic origin (detail)
- Mexican 8%
- Common ancestry
- Slovak 1% Iranian 1% Lithuanian 1%
- Foreign-born
- 1% · Canada
- Languages at home
- 98% English-only · Spanish 1% German/W. Germanic 1%
Political lean MEDSL · Nacogdoches
- 2024 margin
- Solid R (+38.8) · D 30.2% · R 69.0%
- 2008→2024 swing
- -11.3pp toward R · 2008: -27.5pp · 2024: -38.8pp
- All cycles
- 2024: R+38.8 2020: R+31.3 2016: R+35.4 2012: R+36.2 2008: R+27.5
Not yet ingested
- Civics
- —
Market trends
- HPI YoY
- ▲ 3.36%
- Current HPI
- 125.8646
- Rent YoY
- —
- Metro
- —
- State GDP YoY
- ▲ 3.95%
- F500 in state
- 110
Industry mix (Fortune 500 HQ in TX)
| Industry | F500 HQs | Revenue |
|---|---|---|
| Energy | 16 | $1,198B |
|
||
| Technology | 5 | $198B |
|
||
| Engineering / Construction | 4 | $72B |
|
||
| Energy Services | 3 | $60B |
|
||
| Utilities | 3 | $41B |
|
||
| Healthcare | 2 | $330B |
|
||
Price history
2 events — show timeline
- 2026-04-08 Pending — GTAR
- 2026-03-30 Listed $89,500 GTAR
Cash-flow waterfall
monthlySold comps — $/sqft
last 12 mo · ≤1 miLoading sold comps…