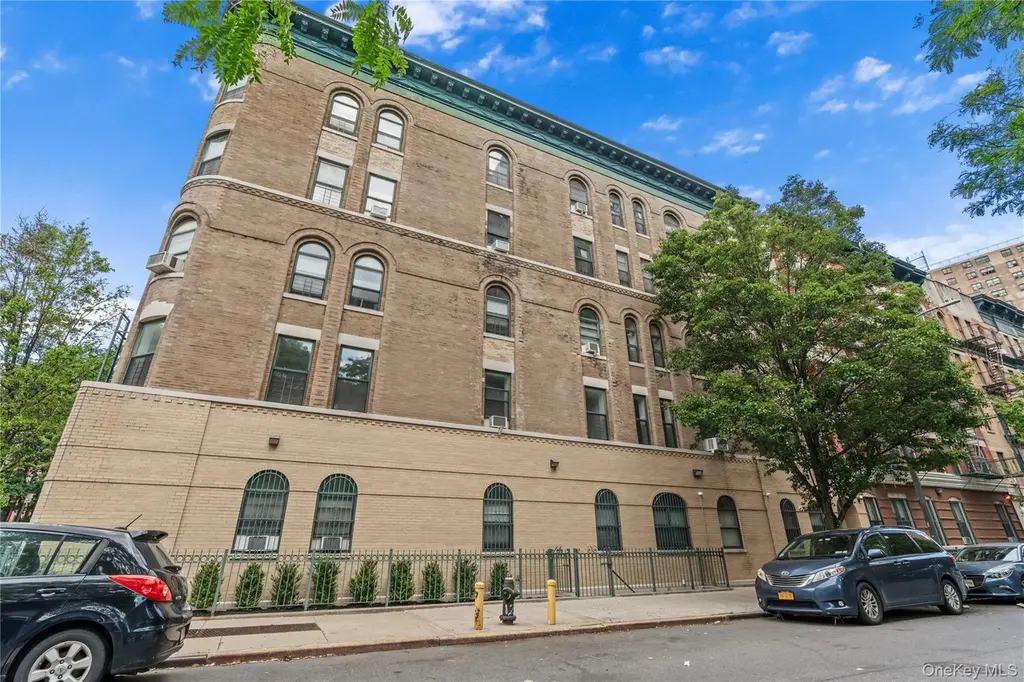
313 W 143rd St Unit 3C · New York, NY
Flood risk 8/10 · Major
- FEMA flood zone
- X (unshaded)
- Chance of flooding over 30 yrs
- 0.78%
- Est. flood insurance / yr
- $507 – $1,088
Fire risk 1/10 · Minimal
- Est. fire insurance / yr
- $691 – $1,283
Heat risk 6/10 · Moderate
- Hot days now (above 99°F)
- 7 days/yr
- Hot days in 30 yrs
- 15 days/yr
Wind risk 6/10 · Moderate
- Chance of severe wind over 30 yrs
- 27.0%
Air-quality risk 4/10 · Minor
- Unhealthy air days now
- 5 days/yr
- Unhealthy air days in 30 yrs
- 6 days/yr
Risk factors via First Street. Map © Google.
Why this score? — see what drove the D grade
The composite is a weighted blend of 9 inputs, each scored 0–100. Each bar is that input's sub-score; the figure is the points it added to the 100-point composite (weight × sub-score).
- Appreciation +9.0/10.0
- Cash flow +7.5/30.0
- ARV discount +7.5/15.0
- Schools +5.0/10.0
- Rent growth +4.7/5.0
- Livability +3.8/5.0
- 1% rule +2.9/10.0
- Condition / age +2.5/5.0
- DSCR +1.6/10.0
$699,000
🖨 Deal sheet (PDF) 📄 Offer letter ✓ Due diligence
Listing remarks
Perfectly positioned between the historic neighborhoods of Sugar Hill and Striver’s Row, The Bradhurst Condominiums offers the ideal blend of classic uptown character and modern convenience. This beautifully maintained 2-bedroom, 2-bath residence is located within one of three mid-rise elevator buildings thoughtfully converted approximately 25 years ago. Step inside to discover a spacious, well-designed layout highlighted by soaring ceilings, oversized windows, and abundant natural light throughout. Elegant crown molding enhances the front living spaces, while rich hardwood floors flow seamlessly from room to room. The generously sized primary suite features a walk-in closet, two addi
Key facts
- $1,099 HOA
- Built 1920
- Listed 20 days
Property features AI
Finance
- HOA & community: Association managed by NMC Property Management
Exterior
- Parking: On-street parking
- Security: Video cameras
- Utilities: Con-Edison electric service; Public sewer; Water available; Trash collection (public); Cable available; Electricity available; Sewer connected
- Home design: Condominium; Entry on 3rd level
- Construction: Brick exterior; Common basement
- Exterior features: Brick construction; Video security cameras; Not waterfront
Interior
- Kitchen: Gas range; Refrigerator; Breakfast bar (kitchen pass-through)
- Bedrooms: 3rd floor entry
- Flooring: Wood flooring
- Bathrooms: 2 full bathrooms
- Heating & cooling: Radiant heat; Wall/window air conditioning units
- Interior features: Breakfast bar; Ceiling fan(s); Crown molding; Elevator; Pantry; Primary bathroom
- Laundry & utility: In-unit washer and dryer
Neighborhood map
What this means for you Summary
Snapshot
- This is a 2-bed/2.0-bath condo listed at $699k.
Deal economics
- At list price, monthly cash flow is $-948 ($-11k/yr) — negative.
- To cash-flow at today's rent, offer at most $532k (24.0% below list).
- To meet the 1% rule (rent ≥ 1% of price), the offer needs to be $554k (20.7% below list).
- Recommended offer: $532k (24.0% below list) — sets the bar for cash-flow.
- Cap rate 4.8% vs local median 2.6% in New York — top-decile yield for the area; either an underpriced asset or a hidden risk that comps aren't pricing in. Stress-test before assuming the spread holds.
Location & tenants
- Location reads 75/100 on livability (#268 in NY, #4,188 nationally) — a middle-class / working-renter tenant base. Strengths: amenities A+, commute A+, health & safety A; Watch: crime F, cost of living F.
- Zoned schools: Elm Tree Elementary School (math 27% / reading 52%, grade F, #1,444 of 2,108 statewide, top 71%, 806 students, 94% FRL); Mark Twain Is 239 For The Gifted And Talented (math 90% / reading 96%, grade A+, #6 of 729 statewide, top 1%, 1,207 students, 44% FRL); Midwood High School (math 94% / reading 96%, grade A+, #83 of 1,100 statewide, top 8%, 4,062 students, 73% FRL).
- Market conditions: Rents rising fast (+8.8%/yr); 73 active listings in the ZIP; 14 comparable units currently listed for rent nearby; rentals leasing fast (median 14d on market — plan ~1-2 weeks tenant-placement turnaround); lower-income renter base — watch delinquency; 4,467 units permitted in New York County in 2024 (4,463 in 5+ unit buildings).
- At $5,545/mo this rent would consume 167% of the median local household income ($40k/yr) (locally 4110% of renters already pay >50% of income on rent) — very limited rent-growth headroom before tenants either downsize or default.
Forward outlook
- In year one you build about $61k of equity ($5k loan paydown + $56k appreciation (8.1% local appreciation)).
- New York County population projected at +21% by 2050 — long-run rental-demand tailwind backs the buy-and-hold thesis.
- By year 2, paydown + projected appreciation supports a ~$98k cash-out refi (75% LTV) — recoverable capital for the next deal without selling this one.
Negotiation context
- It's been on market 21 days — a 2% lower offer ($689k) is reasonable based on typical stale-listing flexibility.
Risks & watch-outs
- Watch-outs: flood insurance adds $66/mo; built in 1920 — expect roof / HVAC / electrical / plumbing capex.
- Climate carrying-cost: severe flood risk; major wind risk, 27% chance of damaging wind over 30y; extreme-heat days projected 7→15/yr by 2055 (HVAC capex compounding) — expect insurance premiums to compound above CPI over the hold.
Questions for the listing agent
- What do current leases actually rent for vs. the listed asking? Can we see a recent rent roll and the last 12 months of T-12 income?
- Built in 1920 — when were the roof, HVAC, electrical panel, plumbing, and water heater last replaced?
- What's the actual annual flood-insurance premium (NFIP or private), and is the property in a SFHA with mandatory coverage?
- What does the HOA fee cover, when was the last increase, and are there any pending special assessments or reserve-fund shortfalls?
- Any open or pending special assessments — roof, HVAC, plumbing, elevator, façade? What's the per-unit balance and payoff schedule, and is the seller paying it off at close or rolling it to the buyer?
- Is there a deadline driving the sale (1031 exchange, divorce, estate, relocation)? That informs how much negotiation room exists.
- Schools are B-rated — typically a magnet for longer-tenancy family renters. What's the average tenant stay here, and is there a school-zone premium baked into asking?
- Crime grade is F in this area — have there been break-ins, vandalism, or insurance claims at this property in the last 3 years? What carrier currently insures it and at what premium?
- The area grade is low — what's the realistic commute time and amenity access for the typical tenant pool here? Any planned neighborhood developments (good or bad) we should know about?
- What's the average days-on-market for RENTAL listings here right now (not sales)? A rising rental-DOM trend means longer vacancies and softer asking-rent achievability than the comps imply.
- What's the recent tenant-quality profile in this submarket — average credit score on applications, eviction rate, late-payment / NSF rate, and stable-employment percentage? A property-management company in the area should have these aggregated.
- How much new apartment / multifamily construction is in the pipeline within 1–3 miles? Heavy new supply (>2% of stock underway) typically softens rents 12–24 months out; light construction supports rent growth.
Investment metrics
- 1% rule
- 0.79% ✗
- Cap rate
- 4.78%
- Cash-on-cash
- -5.40%
- DSCR
- 0.76
- GRM
- 10.5
CMA / ARV
No comps found within radius.
Projected returns pro-forma
8.05% appreciation · 8.0% rent growth · sell at horizon
- IRR
- 17.5%
- Equity multiple
- 2.33×
- Total profit
- $259,353
- Equity at exit
- $533,260
- IRR
- 18.2%
- Equity multiple
- 5.46×
- Total profit
- $872,061
- Equity at exit
- $1,060,632
Cash invested: $195,720 (down + closing). Projections, not guarantees.
Landlord ↔ Tenant lean methodology
- Overall (CITY)
- 0 Strongly Tenant-Friendly
- State New York
- 15 Strongly Tenant-Friendly · D+10
- County
- — inherits STATE
- City New York
- 0 Strongly Tenant-Friendly · D+34
ZIP-level market 10030
- Home prices YoY
- 2.3%
- Rents YoY
- 8.8%
- Active inventory
- 73
- Price-to-rent
- 10.5×
Monthly cashflow live
- Estimated rent
- $5,545 high interval (Pro) →
- Mortgage (P&I)
- −$3,666
- Tax from tax record
- −$206 /mo · $2,469/yr
- Insurance
- −$291
- Flood insurance flood zone
- −$66 /mo · $798/yr
- HOA
- −$1,099
- Vacancy / Maint / Mgmt
- −$1,164
- Net cashflow
- $-948
Break-even live
Sensitivity live
| Price | -10% $-552 | -5% $-750 | +0% $-948 | +5% $-1,146 | +10% $-1,343 |
|---|---|---|---|---|---|
| Rent | -10% $-1,386 | -5% $-1,167 | +0% $-948 | +5% $-729 | +10% $-510 |
| Rate | -1.0pp $-596 | -0.5pp $-770 | base $-948 | +0.5pp $-1,129 | +1.0pp $-1,313 |
UW: 25.0% down · 7.5% · 30yr · 1.5% tax · 5.0% vac · 8.0% maint · 8.0% mgmt
Financing live
Cash to close
- Down payment
- $174,750
- Closing costs
- $20,970
- Reserves months
- —
- Total cash needed
- —
Loan-product check · same deal, 3 products live
Conventional
25% down · 7.5% · 30yr
- Down + closing
- —
- Monthly P&I
- —
- Monthly cashflow
- —
- DSCR
- —
- Eligible?
- —
Personal DTI + credit; lowest rate.
DSCR
20% down · 8.5% · 30yr
- Down + closing
- —
- Monthly P&I
- —
- Monthly cashflow
- —
- DSCR
- —
- Eligible?
- —
No personal income docs; deal must DSCR.
Hard money
10% down · 12.0% · 12mo
- Down + closing
- —
- Monthly P&I
- —
- Monthly cashflow
- —
- DSCR
- —
- Eligible?
- —
Short-term bridge; refi at stabilization.
Rent comps 14 comps
| Address | Beds | Baths | Sqft | Rent | $/sqft | DOM | Units | Dist |
|---|---|---|---|---|---|---|---|---|
| 300 W 135th St Unit 9G New York, NY | 3.0 | 2.0 | 1032 | $5,500 | $5.33 | 6d | 1 | 0.43mi |
| 132 W 134th St New York, NY | 2.0 | 1.0 | 750 | $4,500 | $6.00 | 26d | 1 | 0.55mi |
| 52 Convent Ave Unit 30 New York, NY | 3.0 | 2.0 | 1300 | $7,500 | $5.77 | 26d | 1 | 0.68mi |
| 230 W 126th St Unit 20C New York, NY | 2.0 | 1.0 | 860 | $4,555 | $5.30 | 26d | 1 | 0.87mi |
| 508 Manhattan Ave Unit 2C New York, NY | 3.0 | 1.0 | 800 | $4,699 | $5.87 | 13d | 1 | 1.09mi |
| 312 W 121st St Unit 4C New York, NY | 3.0 | 2.0 | 900 | $4,854 | $5.39 | 9d | 1 | 1.09mi |
| 543 W 122nd St New York, NY | 2.0 | 1.0–2.0 | 1057 | $10,995 | $10.40 | 4d | 7 | 1.10mi |
| 543 W 122nd St Unit 27C New York, NY | 2.0 | 2.0 | 1313 | $10,995 | $8.37 | 12d | 1 | 1.10mi |
| 506 Manhattan Ave Unit 1A New York, NY | 3.0 | 1.0 | 800 | $4,699 | $5.87 | 13d | 1 | 1.11mi |
| 312 W 121st St Unit 5-A New York, NY | 3.0 | 1.0 | 800 | $4,655 | $5.82 | 13d | 1 | 1.11mi |
| 241 Lenox Ave #1 New York, NY | 1.0 | 1.0 | 1175 | $8,000 | $6.81 | 20d | 1 | 1.11mi |
| 2413 3rd Ave Bronx, NY | 1.0–3.0 | 1.0–2.0 | 857 | $4,022 | $4.69 | 1d | 21 | 1.13mi |
| 5 Lincoln Ave Bronx, NY | 1.0–3.0 | 1.0–2.5 | 1011 | $5,138 | $5.08 | 0d | 181 | 1.23mi |
| 30 Morningside Dr #2096 New York, NY | 1.0–2.0 | 1.0–2.0 | 780 | $8,940 | $11.45 | 1d | 2 | 1.49mi |
HOA detail condo
- Monthly dues
- $1,099 · $13,188/yr
- Assessments
- None detected in remarks — confirm with the listing agent.
Listing history 14 events
-
2026-06-21days on market $699,000 Active 21 DOM
-
2026-06-18days on market $699,000 Active 18 DOM
-
2026-06-17days on market $699,000 Active 17 DOM
-
2026-06-16days on market $699,000 Active 16 DOM
-
2026-06-15days on market $699,000 Active 15 DOM
-
2026-06-13days on market $699,000 Active 13 DOM
-
2026-06-09days on market $699,000 Active 9 DOM
-
2026-06-08days on market $699,000 Active 8 DOM
-
2026-06-08days on market $699,000 Active 7 DOM
-
2026-06-04days on market $699,000 Active 4 DOM
-
2026-06-03days on market $699,000 Active 3 DOM
-
2026-06-02days on market $699,000 Active 2 DOM
-
2026-06-01statusdays on market $699,000 Active 1 DOM
-
2026-05-31days on market $699,000 Coming Soon 3 DOM
ⓘ Source: listings_history table (triggers on properties + properties_extension) + one-shot
backfill from property_details.listing_events for pre-trigger history.
Tax reassessment forecast NY · Partial reset (capped growth)
- Current annual tax
- $2,469 · $206/mo
- Projected year-2 tax
- $7,141 · $595/mo
- Expected delta
- +$4,672/yr (+$389/mo · 189.2%)
ⓘ Screening estimate from a state-policy table — verify with the county assessor before closing.
Climate risk First Street
- Flood 8/10 Severe FEMA zone X (unshaded) · 78% chance over 30 yrs
- Wildfire 1/10 Low
- Heat 6/10 Major 7 d/yr ≥99°F today · 15 d/yr by 30 yrs out
- Wind 6/10 Major 27% chance of damaging wind over 30 yrs
- Air quality 4/10 Moderate 5 unhealthy d/yr today · 6 by 30 yrs out
Nearby sold comps map
Loading sold comps map…
Walkable amenities ~0.75 mi
Loading nearby amenities…
Taxation est. · year 1
- Rental income
- $66,537
- − Mortgage interest
- −$39,155
- − Property taxes
- −$2,469
- − Insurance
- −$4,292
- − Repairs & maintenance
- −$5,323
- − Management
- −$5,323
- − HOA
- −$13,188
- − Depreciation
- −$20,335
- Taxable loss
- −$23,549
- Est. tax savings @ 24.0%
- +$5,652
- After-tax cash flow
- $-5,722/yr
For passive investors: Depreciation is non-cash, so a rental often shows a tax loss while cash-flowing — sheltering income. Rental losses are passive: they offset passive income freely, and up to $25,000/yr can offset ordinary (W-2) income if you actively participate and your MAGI is under $100k (phasing out to $0 by $150k); unused losses carry forward. On sale, claimed depreciation is recaptured at up to 25%, and gains may owe capital-gains tax (a 1031 exchange can defer both). Figures are a year-1 estimate at your 24.0% rate — not tax advice; consult a CPA.
Schools (NCES district)
No district data.
Livability — New York
- Score
- 75/100
- State rank
- #268
- US rank
- #4188
Category grades
Schools grade is shown separately in the Schools card above.
Census & demographics
- Census place
- New York, NY
- County
- New York County · 1,599,927 people
- City population
- 7,731,280
- Metro
- New York-Newark-Jersey City, NY-NJ-PA
- Population (ZIP)
- 29,297
- Household income
- $39,802
- Rent vs Own
- Severe rent burden
- 4110.0
Population outlook (New York County) Hauer SSP2
- Today (2025)
- 1,825,725 people
- By 2030
- 1,904,611 · +4.3%
- By 2040
- 2,052,719 · +12.4%
- By 2050
- 2,206,601 · +20.9%
- By 2075
- 2,509,427 · +37.4%
- By 2100
- 2,702,933 · +48.0%
Race, ethnicity, and origin ACS 2023
- Neighborhood character
- Diverse neighborhood (Simpson 0.62)
- Race & ethnicity
- Black 54% Hispanic / Latino 27% White 9% Two or more races 8% Asian 5%
- Hispanic origin (detail)
- Mexican 4% Puerto Rican 6% Dominican 11%
- Common ancestry
- Hispanic 1% Scotch-Irish 1% Romanian 1%
- Foreign-born
- 27% · Canada, China, South Korea
- Languages at home
- 63% English-only · Spanish 21% French/Haitian/Cajun 5% Chinese 2%
Political lean MEDSL · New York
- 2024 margin
- Solid D (+64.8) · D 82.4% · R 17.6%
- 2008→2024 swing
- -7.4pp toward R · 2008: 72.2pp · 2024: 64.8pp
- All cycles
- 2024: D+64.8 2020: D+74.5 2016: D+77.2 2012: D+69.6 2008: D+72.2
Not yet ingested
- Civics
- —
Market trends
- HPI YoY
- ▲ 8.05%
- Current HPI
- 354.2971
- Rent YoY
- ▲ 8.84%
- Metro
- New York-Newark-Jersey City, NY-NJ-PA
- State GDP YoY
- ▲ 2.60%
- F500 in state
- 92
Industry mix (Fortune 500 HQ in NY)
| Industry | F500 HQs | Revenue |
|---|---|---|
| Financial Services | 10 | $950B |
|
||
| Consumer Goods | 9 | $162B |
|
||
| Insurance | 4 | $225B |
|
||
| Telecommunications | 2 | $144B |
|
||
| Pharmaceuticals | 2 | $112B |
|
||
| Media / Entertainment | 2 | $69B |
|
||
Price history
1 event — show timeline
- 2026-05-28 Coming Soon $699,000 OneKey® MLS as Distributed by MLS Grid
Property tax history
+8.1%/yrLatest (2025): $2,469 · +3.9% YoY. Source: county tax records.
Cash-flow waterfall
monthlySold comps — $/sqft
last 12 mo · ≤1 miLoading sold comps…