 Triplex
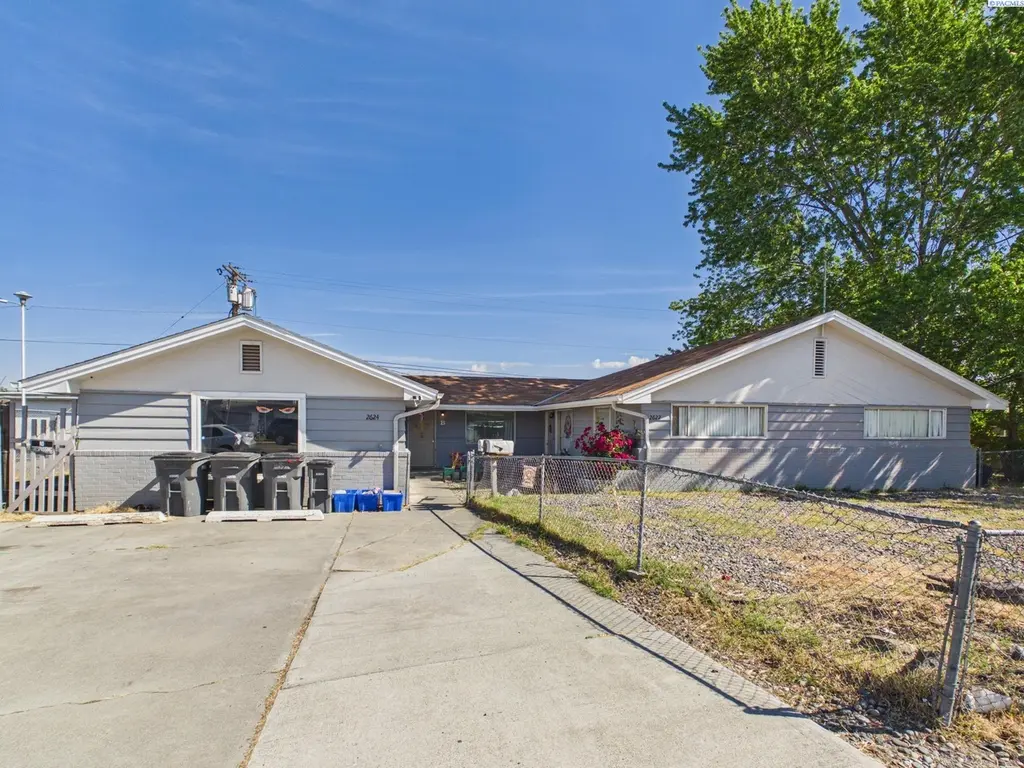
2622 W Clearwater Ave · Kennewick, WA
Flood risk 1/10 · Minimal
- FEMA flood zone
- X
- Chance of flooding over 30 yrs
- 0.0%
- Est. flood insurance / yr
- $507 – $1,088
Fire risk 1/10 · Minimal
- Est. fire insurance / yr
- $604 – $1,122
Heat risk 5/10 · Moderate
- Hot days now (above 99°F)
- 7 days/yr
- Hot days in 30 yrs
- 15 days/yr
Wind risk 1/10 · Minimal
- Chance of severe wind over 30 yrs
- —
Air-quality risk 8/10 · Major
- Unhealthy air days now
- 14 days/yr
- Unhealthy air days in 30 yrs
- 15 days/yr
Risk factors via First Street. Map © Google.
Why this score? — see what drove the C grade
The composite is a weighted blend of 9 inputs, each scored 0–100. Each bar is that input's sub-score; the figure is the points it added to the 100-point composite (weight × sub-score).
- Cash flow +24.1/30.0
- DSCR +7.8/10.0
- ARV discount +7.5/15.0
- 1% rule +5.4/10.0
- Schools +4.6/10.0
- Livability +3.9/5.0
- Rent growth +3.3/5.0
- Condition / age +2.5/5.0
- Appreciation +0.0/10.0
$405,000
🖨 Deal sheet (PDF) 📄 Offer letter ✓ Due diligence
Multi-family units
County records classify this as Multi-Family (2-4 Unit). Listing-text estimate: 3 units. confirmed
Listing remarks MLS
Tri-plex units in convenient Area, Please do not disturb the tenants, Unit 2624 A/ is two bedroom & two bathrooms, 2624 B come w/ washer & dryer is one bedroom & one bath, All units are occupancy, renter agreement is month to month, renters pay own electricity bill, Seller pay garbage & water. full fenced, shed in backyard and storage, buyer to verify SQFT units, write offer subject to view it, Not Lock Box.
Key facts
- Backyard shed
- Fully fenced lot
- 9,147 sq ft lot
Tags
Property features AI
Finance
- Financial info: Property used as residential income (triplex)
Exterior
- Parking: No garage; Off-street parking
- Utilities: Public water; Electric on property; Sewer connected
- Home design: Residential income property — Triplex
- Construction: Wood siding and brick exterior; Composition roof
- Exterior features: Full fencing; Paved road access; Curbs, sidewalks, and street lights in the community
Interior
- Kitchen: Range; Refrigerator; Oven
- Flooring: Carpet; Laminate; Vinyl
- Heating & cooling: Baseboard electric heating; Wall-mounted electric cooling units
- Interior features: Range, Refrigerator, Oven; Wood burning fireplace
Neighborhood map
What this means for you Summary
Snapshot
- This is a 1×2bd/2ba + 1×1bd/1ba + 1×2bd/1ba units multifamily listed at $405k.
Deal economics
- At list price, monthly cash flow is $804 ($10k/yr) — positive. Per door: $268/mo.
- The deal already cash-flows at list — no discount required.
- Meets the 1% rule at list price ($4k rent vs $405k).
- Cap rate 8.7% vs local median 3.3% in Kennewick — top-decile yield for the area; either an underpriced asset or a hidden risk that comps aren't pricing in. Stress-test before assuming the spread holds.
Location & tenants
- Location reads 78/100 on livability (#131 in WA, #2,599 nationally) — a middle-class / working-renter tenant base. Strengths: commute A+, housing A+, health & safety A; Watch: amenities D+, crime F.
- Kennewick School District (urban): math 43% / reading 58% proficiency, ranked #141 of 291 in WA (top 48%) — acceptable for families but not a draw, mixed tenant base, ~2y average lease.
- Zoned schools: Hawthorne Elementary School (474 students, 80% FRL); Highlands Middle School (750 students, 84% FRL); Southridge High School (1,641 students, 55% FRL) — zoned schools average 73% FRL vs 48% district-wide (25 pts higher); higher-poverty schools than district average — tighter screening recommended.
- Market conditions: Rents rising (+3.4%/yr); 292 active listings in the ZIP; 2 comparable units currently listed for rent nearby; 1,532 units permitted in Benton County in 2024 (389 in 5+ unit buildings).
- At $4,192/mo this rent would consume 80% of the median local household income ($63k/yr) (locally 2605% of renters already pay >50% of income on rent) — very limited rent-growth headroom before tenants either downsize or default.
Forward outlook
- Local home prices are declining (-3.0%/yr); year-one equity from $3k of loan paydown is wiped out by about $12k of value loss. Plan a longer hold.
- Benton County population projected at +32% by 2050 — long-run rental-demand tailwind backs the buy-and-hold thesis.
Negotiation context
- Only 3 days on market — expect competitive offers; lowballing is unlikely to land.
- 3 sale attempts since 12y ago with the ask held roughly flat each time — persistent listings suggest the price (not the market) is what's stuck; bring a comps-based counter.
- Current owner paid $183k; list at $405k implies a 121% gain — meaningful room to come down on a strong offer.
Risks & watch-outs
- Watch-outs: built in 1959 — expect roof / HVAC / electrical / plumbing capex.
- Climate carrying-cost: extreme-heat days projected 7→15/yr by 2055 (HVAC capex compounding) — expect insurance premiums to compound above CPI over the hold.
Questions for the listing agent
- Can we see the unit-by-unit rent roll, current vacancy, and any below-market leases? What's the average tenancy length?
- What capital expenditures (roof, boiler, parking lot, exteriors) have been made in the last 5 years, and what's planned in the next 2?
- Built in 1959 — when were the roof, HVAC, electrical panel, plumbing, and water heater last replaced?
- Is there a deadline driving the sale (1031 exchange, divorce, estate, relocation)? That informs how much negotiation room exists.
- Schools are D-rated, which usually means shorter tenancies and higher turnover. Who's the typical renter profile here, and what's been the actual vacancy rate?
- Crime grade is F in this area — have there been break-ins, vandalism, or insurance claims at this property in the last 3 years? What carrier currently insures it and at what premium?
- What's the average days-on-market for RENTAL listings here right now (not sales)? A rising rental-DOM trend means longer vacancies and softer asking-rent achievability than the comps imply.
- What's the recent tenant-quality profile in this submarket — average credit score on applications, eviction rate, late-payment / NSF rate, and stable-employment percentage? A property-management company in the area should have these aggregated.
- How much new apartment / multifamily construction is in the pipeline within 1–3 miles? Heavy new supply (>2% of stock underway) typically softens rents 12–24 months out; light construction supports rent growth.
Investment metrics
- 1% rule
- 1.04% ✓
- Cap rate
- 8.68%
- Cash-on-cash
- 8.51%
- DSCR
- 1.38
- GRM
- 8.1
CMA / ARV
No comps found within radius.
Projected returns pro-forma
-3.0% appreciation · 3.39% rent growth · sell at horizon
- IRR
- -3.0%
- Equity multiple
- 0.89×
- Total profit
- $-12,884
- Equity at exit
- $60,387
- IRR
- 7.1%
- Equity multiple
- 1.54×
- Total profit
- $61,079
- Equity at exit
- $35,017
Cash invested: $113,400 (down + closing). Projections, not guarantees.
Landlord ↔ Tenant lean methodology
- Overall (STATE)
- 28 Tenant-Leaning
- State Washington
- 28 Tenant-Leaning · D+8
- County
- — inherits STATE
- City
- — inherits STATE
ZIP-level market 99336
- Rents YoY
- 3.4%
- Active inventory
- 292
- Price-to-rent
- 23.6×
Monthly cashflow live
- Estimated rent
- $4,192 high interval (Pro) →
- Mortgage (P&I)
- −$2,124
- Tax from tax record
- −$215 /mo · $2,581/yr
- Insurance
- −$169
- HOA
- −$0
- Lot rent
- −$0
- Vacancy / Maint / Mgmt
- −$880
- Net cashflow
- $804
Break-even live
Sensitivity live
| Price | -10% $1,033 | -5% $919 | +0% $804 | +5% $689 | +10% $575 |
|---|---|---|---|---|---|
| Rent | -10% $473 | -5% $638 | +0% $804 | +5% $970 | +10% $1,135 |
| Rate | -1.0pp $1,008 | -0.5pp $907 | base $804 | +0.5pp $699 | +1.0pp $592 |
3-unit breakdown (identical units grouped — click to expand)
| Units | Beds | Baths | Est. rent |
|---|---|---|---|
| 1× unit | 2 | 2 | $1,427 |
| 1× unit | 1 | 1 | $1,338 |
| 1× unit | 2 | 1 | $1,427 |
| Total (3 units) | $4,192 | ||
UW: 25.0% down · 7.5% · 30yr · 1.5% tax · 5.0% vac · 8.0% maint · 8.0% mgmt
Financing live
Cash to close
- Down payment
- $101,250
- Closing costs
- $12,150
- Reserves months
- —
- Total cash needed
- —
Loan-product check · same deal, 3 products live
Conventional
25% down · 7.5% · 30yr
- Down + closing
- —
- Monthly P&I
- —
- Monthly cashflow
- —
- DSCR
- —
- Eligible?
- —
Personal DTI + credit; lowest rate.
DSCR
20% down · 8.5% · 30yr
- Down + closing
- —
- Monthly P&I
- —
- Monthly cashflow
- —
- DSCR
- —
- Eligible?
- —
No personal income docs; deal must DSCR.
Hard money
10% down · 12.0% · 12mo
- Down + closing
- —
- Monthly P&I
- —
- Monthly cashflow
- —
- DSCR
- —
- Eligible?
- —
Short-term bridge; refi at stabilization.
Rent comps 2 comps
| Address | Beds | Baths | Sqft | Rent | $/sqft | DOM | Units | Dist |
|---|---|---|---|---|---|---|---|---|
| 1707 W 6th Ave Unit A101 Kennewick, WA | 4.0 | 2.0 | 2244 | $2,150 | $0.96 | 46d | 1 | 1.00mi |
| 722 S Union St Kennewick, WA | 4.0 | 2.0 | 2181 | $2,295 | $1.05 | 46d | 1 | 1.36mi |
Listing history 5 events
-
2026-05-20$405,000 Active
-
2016-06-17soldstatus $183,000 436-char remark
Show marketing remark (436 chars)
Tri-plex units in convenient Area, Please do not disturb the tenants, Unit 2624 A/ is two bedroom & two bathrooms, 2624 B come w/ washer & dryer is one bedroom & one bath, All units are occupancy, renter agreement is month to month, renters pay own electricity bill, Seller pay garbage & water. full fenced, shed in backyard and storage, buyer to verify SQFT units, write offer subject to view it, Not Lock Box.
-
2016-06-16soldstatus $183,000
-
2016-02-19$189,900 436-char remark
Show marketing remark (436 chars)
Tri-plex units in convenient Area, Please do not disturb the tenants, Unit 2624 A/ is two bedroom & two bathrooms, 2624 B come w/ washer & dryer is one bedroom & one bath, All units are occupancy, renter agreement is month to month, renters pay own electricity bill, Seller pay garbage & water. full fenced, shed in backyard and storage, buyer to verify SQFT units, write offer subject to view it, Not Lock Box.
-
2014-12-15$189,900
ⓘ Source: listings_history table (triggers on properties + properties_extension) + one-shot
backfill from property_details.listing_events for pre-trigger history.
Tax reassessment forecast WA · Resets to sale price
- Current annual tax
- $2,581 · $215/mo
- Projected year-2 tax
- $3,969 · $331/mo
- Expected delta
- +$1,388/yr (+$116/mo · 53.8%)
ⓘ Screening estimate from a state-policy table — verify with the county assessor before closing.
Climate risk First Street
- Flood 1/10 Low FEMA zone X · 0% chance over 30 yrs
- Wildfire 1/10 Low
- Heat 5/10 Major 7 d/yr ≥99°F today · 15 d/yr by 30 yrs out
- Wind 1/10 Low
- Air quality 8/10 Severe 14 unhealthy d/yr today · 15 by 30 yrs out
Nearby sold comps map
Loading sold comps map…
Walkable amenities ~0.75 mi
Loading nearby amenities…
Taxation est. · year 1
- Rental income
- $50,304
- − Mortgage interest
- −$22,686
- − Property taxes
- −$2,581
- − Insurance
- −$2,025
- − Repairs & maintenance
- −$4,024
- − Management
- −$4,024
- − Depreciation
- −$11,782
- Taxable income
- $3,182
- Est. tax owed @ 24.0%
- −$764
- After-tax cash flow
- $8,885/yr
For passive investors: Depreciation is non-cash, so a rental often shows a tax loss while cash-flowing — sheltering income. Rental losses are passive: they offset passive income freely, and up to $25,000/yr can offset ordinary (W-2) income if you actively participate and your MAGI is under $100k (phasing out to $0 by $150k); unused losses carry forward. On sale, claimed depreciation is recaptured at up to 25%, and gains may owe capital-gains tax (a 1031 exchange can defer both). Figures are a year-1 estimate at your 24.0% rate — not tax advice; consult a CPA.
Schools (NCES district)
- District
- Kennewick School District
- NCES district ID
- 5303930
- Math proficiency
- 43% ▼ -1.00%
- Reading proficiency
- 58% ▬ 0.00%
- Median HH income
- $54,191
- Composite
- 45.56/100
- National rank
- #5667
- State rank
- #141 of 291 in WA
Livability — Kennewick
- Score
- 78/100
- State rank
- #131
- US rank
- #2599
Category grades
Schools grade is shown separately in the Schools card above.
Census & demographics
- Census place
- Kennewick, WA
- County
- Benton County · 186,895 people
- City population
- 104,655
- Metro
- Kennewick-Richland, WA
- Population (ZIP)
- 50,735
- Household income
- $62,527
- Rent vs Own
- Severe rent burden
- 2605.0
Population outlook (Benton County) Hauer SSP2
- Today (2025)
- 219,421 people
- By 2030
- 233,813 · +6.6%
- By 2040
- 262,134 · +19.5%
- By 2050
- 290,100 · +32.2%
- By 2075
- 363,525 · +65.7%
- By 2100
- 418,667 · +90.8%
Race, ethnicity, and origin ACS 2023
- Neighborhood character
- Diverse neighborhood (Simpson 0.56)
- Race & ethnicity
- White 55% Hispanic / Latino 37% Two or more races 15% Black 3% Asian 2% Native American 1%
- Hispanic origin (detail)
- Mexican 31% Cuban 2%
- Common ancestry
- Portuguese 4% Slovak 3% Romanian 1%
- Foreign-born
- 16% · Canada, Jamaica
- Languages at home
- 68% English-only · Spanish 29% Arabic 1%
Political lean MEDSL · Benton
- 2024 margin
- Strong R (+21.9) · D 37.7% · R 59.6% · Other 2.7%
- 2008→2024 swing
- +4.2pp toward D · 2008: -26.1pp · 2024: -21.9pp
- All cycles
- 2024: R+21.9 2020: R+21.0 2016: R+26.6 2012: R+27.0 2008: R+26.1
Not yet ingested
- Civics
- —
Market trends
- HPI YoY
- ▼ -408.26%
- Current HPI
- 256.1143
- Rent YoY
- ▲ 3.39%
- Metro
- Kennewick-Richland, WA
- State GDP YoY
- ▲ 4.65%
- F500 in state
- 22
Industry mix (Fortune 500 HQ in WA)
| Industry | F500 HQs | Revenue |
|---|---|---|
| Retail | 2 | $269B |
|
||
| Technology / Retail | 1 | $638B |
|
||
| Technology | 1 | $245B |
|
||
| Telecommunications | 1 | $38B |
|
||
| Food / Beverage | 1 | $36B |
|
||
| Automotive / Trucks | 1 | $34B |
|
||
Price history
+113.3% since first listed6 events — show timeline
- 2026-05-24 Pending — PACMLS
- 2026-05-20 Listed $405,000 PACMLS
- 2016-06-17 Sold (MLS) $183,000 PACMLS
- 2016-06-16 Sold (Public Records) $183,000 Public Records
- 2016-02-19 Listed $189,900 PACMLS
- 2014-12-15 Listed $189,900 PACMLS
Property tax history
+3.5%/yrLatest (2026): $2,581 · -1.8% YoY. Source: county tax records.
Cash-flow waterfall
monthlySold comps — $/sqft
last 12 mo · ≤1 miLoading sold comps…