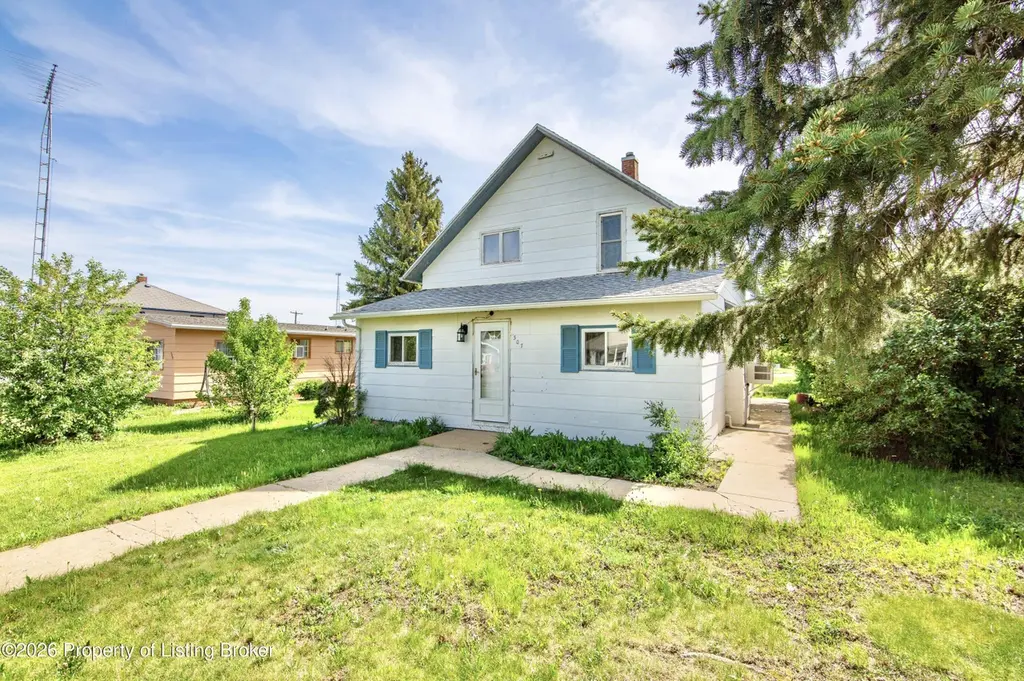
307 Dakota Ave · Mott, ND
Flood risk No data
- FEMA flood zone
- —
- Chance of flooding over 30 yrs
- —
- Est. flood insurance / yr
- —
Fire risk No data
- Est. fire insurance / yr
- —
Heat risk No data
- Hot days now (above threshold)
- —
- Hot days in 30 yrs
- —
Wind risk No data
- Chance of severe wind over 30 yrs
- —
Air-quality risk No data
- Unhealthy air days now
- —
- Unhealthy air days in 30 yrs
- —
Risk factors via First Street. Map © Google.
Why this score? — see what drove the B grade
The composite is a weighted blend of 9 inputs, each scored 0–100. Each bar is that input's sub-score; the figure is the points it added to the 100-point composite (weight × sub-score).
- Cash flow +30.0/30.0
- 1% rule +10.0/10.0
- DSCR +10.0/10.0
- ARV discount +7.5/15.0
- Appreciation +5.0/10.0
- Schools +3.3/10.0
- Livability +3.2/5.0
- Rent growth +2.5/5.0
- Condition / age +2.5/5.0
$67,500
🖨 Deal sheet 📄 Offer letter ✓ Due diligence
Listing remarks MLS
Affordable 4 bed bungalow in Marvelous Mott. New water heater 4/2021. New roof and furnace in the last 8 years. Garage has shop space.
Key facts
- Practical mudroom
- Spacious lot
- 0.25 acre lot
Tags
Property features AI
Exterior
- Parking: Attached garage with 2 spaces
- Utilities: Public sewer
- Home design: Single-family residence; One story
- Construction: Foundation: see remarks
- Exterior features: Lot approximately 0.25 acres; Lot dimensions approximately 60 x 183; Low density residential zoning
Interior
- Kitchen: Dishwasher
- Bedrooms: Total rooms: 11
- Bathrooms: 1 full bathroom
- Heating & cooling: Forced air heating; Central cooling
- Interior features: Window coverings; Unfinished basement; Basement present
- Laundry & utility: Washer; Dryer
Neighborhood map
What this means for you Summary
Snapshot
- This is a 4-bed/1.0-bath single-family listed at $68k.
Deal economics
- At list price, monthly cash flow is $702 ($8k/yr) — positive.
- The deal already cash-flows at list — no discount required.
- Meets the 1% rule at list price ($1k rent vs $68k).
- Recommended offer: $66k (1.5% below list) — sets the bar for market timing.
Location & tenants
- Location reads 64/100 on livability (#213 in ND) — a middle-class / working-renter tenant base. Strengths: cost of living A+, housing A+; Watch: crime C-, employment C-, health & safety D+.
- Mott-Regent 1 (rural): math 30% / reading 40% proficiency, ranked #132 of 169 in ND (top 78%) — families likely to look elsewhere, expect single-tenant / working-renter base with shorter leases.
- Market conditions: 4 active listings in the ZIP.
Forward outlook
- In year one you build about $2k of equity ($467 loan paydown + $2k appreciation (3.0% local appreciation)).
- Hettinger County population projected at +68% by 2050 — long-run rental-demand tailwind backs the buy-and-hold thesis.
- At projected returns (3.0% appreciation + 3.0% rent growth), your $19k cash investment doubles in ~2 years — after that, you're playing with house money.
Negotiation context
- It's been on market 19 days — a 2% lower offer ($66k) is reasonable based on typical stale-listing flexibility.
- 3 sale attempts since 5y ago with the ask held roughly flat each time — persistent listings suggest the price (not the market) is what's stuck; bring a comps-based counter.
- Current owner paid $32k; list at $68k implies a 111% gain — meaningful room to come down on a strong offer.
Risks & watch-outs
- Watch-outs: built in 1935 — expect roof / HVAC / electrical / plumbing capex.
Questions for the listing agent
- Built in 1935 — when were the roof, HVAC, electrical panel, plumbing, and water heater last replaced?
- Is there a deadline driving the sale (1031 exchange, divorce, estate, relocation)? That informs how much negotiation room exists.
- Schools are D-rated, which usually means shorter tenancies and higher turnover. Who's the typical renter profile here, and what's been the actual vacancy rate?
- What's the average days-on-market for RENTAL listings here right now (not sales)? A rising rental-DOM trend means longer vacancies and softer asking-rent achievability than the comps imply.
- What's the recent tenant-quality profile in this submarket — average credit score on applications, eviction rate, late-payment / NSF rate, and stable-employment percentage? A property-management company in the area should have these aggregated.
- How much new for-sale + rental construction is in the pipeline within 1–3 miles? Heavy new supply typically softens prices + rents 12–24 months out; constrained supply supports both.
Investment metrics
- 1% rule
- 2.08% ✓
- Cap rate
- 18.77%
- Cash-on-cash
- 44.55%
- DSCR
- 2.98
- GRM
- 4.0
CMA / ARV
- ARV (on-the-fly)
- $34,408
- Comps found
- 1
Show comp detail 1 sale within ~0.75 mi
| Address | Dist | Beds/Ba | Sqft | Sold | Price | $/sf | Match |
|---|---|---|---|---|---|---|---|
| 601 Minnesota Ave | 0.63mi | 3/1.5 (-1) | 1,680 (+12%) | 14mo | $38,550 | $23 | 32 |
Match score weights: distance 35% · size 25% · config 20% · recency 20%. Top-matched comps best support the ARV.
Projected returns pro-forma
3.0% appreciation · 3.0% rent growth · sell at horizon
- IRR
- 49.9%
- Equity multiple
- 3.79×
- Total profit
- $52,810
- Equity at exit
- $30,351
- IRR
- 49.5%
- Equity multiple
- 7.63×
- Total profit
- $125,350
- Equity at exit
- $46,774
Cash invested: $18,900 (down + closing). Projections, not guarantees.
Landlord ↔ Tenant lean methodology
- Overall (STATE)
- 82 Strongly Landlord-Friendly
- State North Dakota
- 82 Strongly Landlord-Friendly · R+20
- County
- — inherits STATE
- City
- — inherits STATE
ZIP-level market 58646
- Active inventory
- 4
- Price-to-rent
- 4.0×
Monthly cashflow live
- Estimated rent
- $1,403 medium interval (Pro) →
- Mortgage (P&I)
- −$354
- Tax from tax record
- −$25 /mo · $296/yr
- Insurance
- −$28
- HOA
- −$0
- Vacancy / Maint / Mgmt
- −$295
- Net cashflow
- $702
Break-even live
UW: 25.0% down · 7.5% · 30yr · 1.5% tax · 5.0% vac · 8.0% maint · 8.0% mgmt
Financing live
Cash to close
- Down payment
- $16,875
- Closing costs
- $2,025
- Reserves months
- —
- Total cash needed
- —
Loan-product check · same deal, 3 products live
Conventional
25% down · 7.5% · 30yr
- Down + closing
- —
- Monthly P&I
- —
- Monthly cashflow
- —
- DSCR
- —
- Eligible?
- —
Personal DTI + credit; lowest rate.
DSCR
20% down · 8.5% · 30yr
- Down + closing
- —
- Monthly P&I
- —
- Monthly cashflow
- —
- DSCR
- —
- Eligible?
- —
No personal income docs; deal must DSCR.
Hard money
10% down · 12.0% · 12mo
- Down + closing
- —
- Monthly P&I
- —
- Monthly cashflow
- —
- DSCR
- —
- Eligible?
- —
Short-term bridge; refi at stabilization.
Listing history 14 events
-
2026-06-18days on market $67,500 Active 19 DOM
-
2026-06-17days on market $67,500 Active 18 DOM
-
2026-06-16days on market $67,500 Active 17 DOM
-
2026-06-15days on market $67,500 Active 16 DOM
-
2026-06-13days on market $67,500 Active 14 DOM
-
2026-06-12days on market $67,500 Active 13 DOM
-
2026-06-09days on market $67,500 Active 10 DOM
-
2026-06-08days on market $67,500 Active 9 DOM
-
2026-06-07days on market $67,500 Active 8 DOM
-
2026-06-05days on market $67,500 Active 6 DOM
-
2026-06-04days on market $67,500 Active 4 DOM
-
2026-06-02days on market $67,500 Active 3 DOM
-
2026-06-01days on market $67,500 Active 2 DOM
-
2026-05-31$67,500 Active 1 DOM
ⓘ Source: listings_history table (triggers on properties + properties_extension) + one-shot
backfill from property_details.listing_events for pre-trigger history.
Tax reassessment forecast ND · Resets to sale price
- Current annual tax
- $296 · $25/mo
- Projected year-2 tax
- $662 · $55/mo
- Expected delta
- +$365/yr (+$30/mo · 123.2%)
ⓘ Screening estimate from a state-policy table — verify with the county assessor before closing.
Nearby sold comps map
Loading sold comps map…
Walkable amenities ~0.75 mi
Loading nearby amenities…
Taxation est. · year 1
- Rental income
- $16,839
- − Mortgage interest
- −$3,781
- − Property taxes
- −$296
- − Insurance
- −$338
- − Repairs & maintenance
- −$1,347
- − Management
- −$1,347
- − Depreciation
- −$1,964
- Taxable income
- $7,766
- Est. tax owed @ 24.0%
- −$1,864
- After-tax cash flow
- $6,557/yr
For passive investors: Depreciation is non-cash, so a rental often shows a tax loss while cash-flowing — sheltering income. Rental losses are passive: they offset passive income freely, and up to $25,000/yr can offset ordinary (W-2) income if you actively participate and your MAGI is under $100k (phasing out to $0 by $150k); unused losses carry forward. On sale, claimed depreciation is recaptured at up to 25%, and gains may owe capital-gains tax (a 1031 exchange can defer both). Figures are a year-1 estimate at your 24.0% rate — not tax advice; consult a CPA.
Schools (NCES district)
- District
- Mott-Regent 1
- NCES district ID
- 3800046
- Math proficiency
- 30% ▬ 0.00%
- Reading proficiency
- 40% ▼ -5.00%
- Median HH income
- $47,167
- Composite
- 32.69/100
- National rank
- #10788
- State rank
- #132 of 169 in ND
Livability — Mott
- Score
- 64/100
- State rank
- #213
- US rank
- #14750
Category grades
Schools grade is shown separately in the Schools card above.
Census & demographics
- Census place
- Mott, ND
- Population (ZIP)
- 1,107
Population outlook (Hettinger County) Hauer SSP2
- Today (2025)
- 3,198 people
- By 2030
- 3,515 · +9.9%
- By 2040
- 4,334 · +35.5%
- By 2050
- 5,386 · +68.4%
- By 2075
- 8,765 · +174.1%
- By 2100
- 11,627 · +263.6%
Race, ethnicity, and origin ACS 2023
- Neighborhood character
- Predominantly White (98%)
- Race & ethnicity
- White 98% Two or more races 1% Native American 1%
- Common ancestry
- Portuguese 15% Scotch-Irish 5% Lithuanian 3%
- Foreign-born
- 0%
- Languages at home
- 97% English-only · German/W. Germanic 2%
Political lean MEDSL · Hettinger
- 2024 margin
- Solid R (+69.3) · D 14.8% · R 84.2% · Other 1.0%
- 2008→2024 swing
- -33.2pp toward R · 2008: -36.1pp · 2024: -69.3pp
- All cycles
- 2024: R+69.3 2020: R+68.2 2016: R+68.5 2012: R+50.7 2008: R+36.1
Not yet ingested
- Civics
- —
Market trends
- HPI YoY
- —
- Current HPI
- —
- Rent YoY
- —
- Metro
- —
- State GDP YoY
- ▲ 2.09%
- F500 in state
- 2
Industry mix (Fortune 500 HQ in ND)
| Industry | F500 HQs | Revenue |
|---|---|---|
| Utilities / Construction | 1 | $6B |
|
||
Price history
+321.9% since first listed7 events — show timeline
- 2026-05-30 Listed $67,500 Badlands BOR MLS
- 2023-09-06 Delisted — Badlands BOR MLS
- 2022-03-11 Sold (Public Records) $32,000 Public Records
- 2022-03-10 Sold (MLS) — GNMLS
- 2022-01-20 Listed $32,000 GNMLS
- 2021-12-21 Sold (Public Records) $16,000 Public Records
- 2021-11-10 Listed $16,000 Badlands BOR MLS
Property tax history
-1.7%/yrLatest (2025): $296 · +225.7% YoY. Source: county tax records.
Cash-flow waterfall
monthlySold comps — $/sqft
last 12 mo · ≤1 miLoading sold comps…