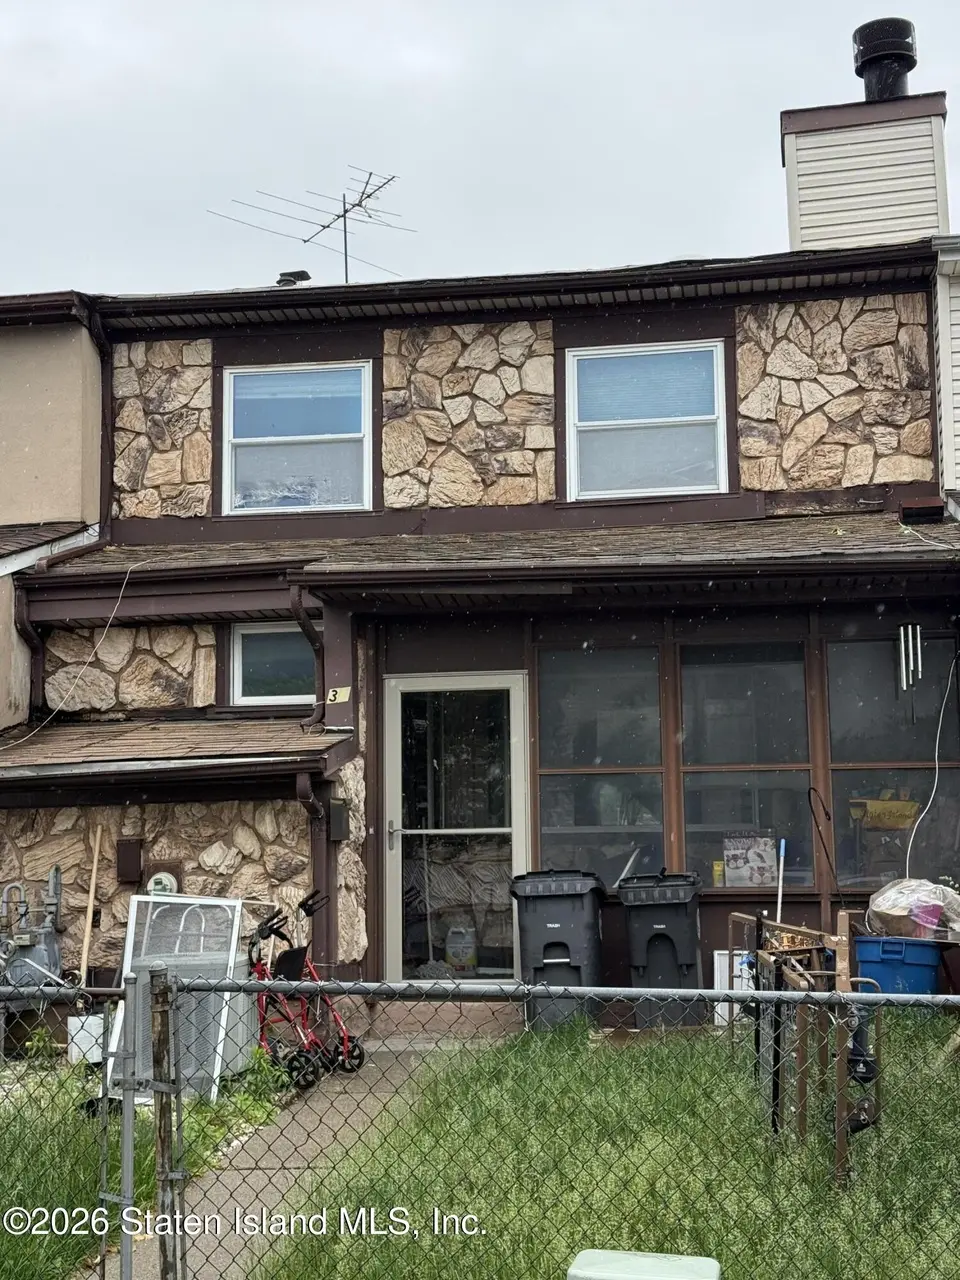
34 Andrea Pl · New York, NY
Flood risk 1/10 · Minimal
- FEMA flood zone
- X (unshaded)
- Chance of flooding over 30 yrs
- 0.0%
- Est. flood insurance / yr
- $507 – $1,088
Fire risk 1/10 · Minimal
- Est. fire insurance / yr
- $691 – $1,283
Heat risk 7/10 · Major
- Hot days now (above 98°F)
- 7 days/yr
- Hot days in 30 yrs
- 15 days/yr
Wind risk 6/10 · Moderate
- Chance of severe wind over 30 yrs
- 27.0%
Air-quality risk 4/10 · Minor
- Unhealthy air days now
- 5 days/yr
- Unhealthy air days in 30 yrs
- 6 days/yr
Risk factors via First Street. Map © Google.
Why this score? — see what drove the C- grade
The composite is a weighted blend of 9 inputs, each scored 0–100. Each bar is that input's sub-score; the figure is the points it added to the 100-point composite (weight × sub-score).
- Cash flow +18.9/30.0
- ARV discount +7.5/15.0
- DSCR +5.9/10.0
- Schools +5.0/10.0
- 1% rule +4.6/10.0
- Livability +3.8/5.0
- Rent growth +2.5/5.0
- Condition / age +2.5/5.0
- Appreciation +0.0/10.0
$299,000
🖨 Deal sheet 📄 Offer letter ✓ Due diligence
Listing remarks
Short Sale subject to bank approval. CASH OFFERS ONLY. DRIVE-BY ONLY. Roof is open and has caused structural damage. HVAC unit is not working.
Key facts
- 1,100 sq ft lot
- Built 1984
- Listed 26 days
Property features AI
Exterior
- Parking: No attached garage
- Utilities: 220-volt electrical service
- Home design: 2-story residence; Zoned R3-2; Approximate year built
- Construction: Wood siding construction; Total building area about 1,480
- Exterior features: Wood siding; Lot dimensions approximately 22 x 50; Small lot (about 0.03 acre)
Interior
- Bathrooms: 1 full bathroom; 1 half bathroom (2 total bathrooms)
- Heating & cooling: Natural gas forced-air heating
- Interior features: Property listed in poor condition
Neighborhood map
What this means for you Summary
Snapshot
- This is a 2-bed/1.5-bath single-family listed at $299k.
Deal economics
- At list price, monthly cash flow is $305 ($4k/yr) — positive.
- The deal already cash-flows at list — no discount required.
- To meet the 1% rule (rent ≥ 1% of price), the offer needs to be $286k (4.3% below list).
- Recommended offer: $286k (4.3% below list) — sets the bar for 1% rule.
- Cap rate 7.5% vs local median 2.6% in New York — top-decile yield for the area; either an underpriced asset or a hidden risk that comps aren't pricing in. Stress-test before assuming the spread holds.
Location & tenants
- Location reads 75/100 on livability (#268 in NY, #4,188 nationally) — a middle-class / working-renter tenant base. Strengths: amenities A+, commute A+, health & safety A; Watch: crime F, cost of living F.
- Market conditions: 108 active listings in the ZIP; 3 comparable units currently listed for rent nearby; rentals leasing fast (median 8d on market — plan ~1-2 weeks tenant-placement turnaround); solid renter incomes; 480 units permitted in Richmond County in 2024 (22 in 5+ unit buildings).
- This rent runs 41% of the median local income ($84k/yr) — at the standard rent-burdened threshold; future hikes will face affordability resistance.
Forward outlook
- Local home prices are declining (-3.0%/yr); year-one equity from $2k of loan paydown is wiped out by about $9k of value loss. Plan a longer hold.
- Richmond County population projected to shrink 5% by 2050 — rents likely to lag national; underwrite the cash flow, not the appreciation.
Negotiation context
- It's been on market 26 days — a 2% lower offer ($295k) is reasonable based on typical stale-listing flexibility.
- Current owner paid $17k; list at $299k implies a 1659% gain — meaningful room to come down on a strong offer.
Risks & watch-outs
- Climate carrying-cost: major wind risk, 27% chance of damaging wind over 30y; extreme-heat days projected 7→15/yr by 2055 (HVAC capex compounding) — expect insurance premiums to compound above CPI over the hold.
Questions for the listing agent
- Is there a deadline driving the sale (1031 exchange, divorce, estate, relocation)? That informs how much negotiation room exists.
- Schools are B-rated — typically a magnet for longer-tenancy family renters. What's the average tenant stay here, and is there a school-zone premium baked into asking?
- Crime grade is F in this area — have there been break-ins, vandalism, or insurance claims at this property in the last 3 years? What carrier currently insures it and at what premium?
- What's the average days-on-market for RENTAL listings here right now (not sales)? A rising rental-DOM trend means longer vacancies and softer asking-rent achievability than the comps imply.
- What's the recent tenant-quality profile in this submarket — average credit score on applications, eviction rate, late-payment / NSF rate, and stable-employment percentage? A property-management company in the area should have these aggregated.
- How much new for-sale + rental construction is in the pipeline within 1–3 miles? Heavy new supply typically softens prices + rents 12–24 months out; constrained supply supports both.
Investment metrics
- 1% rule
- 0.96% ✗
- Cap rate
- 7.52%
- Cash-on-cash
- 4.37%
- DSCR
- 1.19
- GRM
- 8.7
CMA / ARV
- ARV (on-the-fly)
- $603,840
- Comps found
- 12
Show comp detail 12 sales within ~0.75 mi
| Address | Dist | Beds/Ba | Sqft | Sold | Price | $/sf | Match |
|---|---|---|---|---|---|---|---|
| 82 Birch Rd | 0.12mi | 3/1.5 (+1) | 1,440 (-3%) | 0mo | $625,000 | $434 | 85 |
| 32 Amador St | 0.22mi | 3/1.5 (+1) | 1,632 (+10%) | 2mo | $610,000 | $374 | 66 |
| 136 Union Ave | 0.70mi | 3/3.5 (+1) | 1,475 (-0%) | 1mo | $730,000 | $495 | 53 |
| 138 Union Ave | 0.70mi | 3/3.5 (+1) | 1,504 (+2%) | 0mo | $765,000 | $509 | 51 |
| 86 Confederation Pl | 0.47mi | 3/2.5 (+1) | 1,300 (-12%) | 1mo | $585,000 | $450 | 48 |
| 70 Gridley Ave | 0.48mi | 3/2.5 (+1) | 1,300 (-12%) | 2mo | $580,000 | $446 | 47 |
| 221 South Ave | 0.63mi | 3/1.5 (+1) | 1,326 (-10%) | 2mo | $330,000 | $249 | 46 |
| 25 Claudia Ct | 0.55mi | 3/3.5 (+1) | 1,595 (+8%) | 3mo | $650,000 | $408 | 46 |
| 256 Maple Pkwy | 0.53mi | 3/2.5 (+1) | 1,677 (+13%) | 1mo | $555,000 | $331 | 43 |
| 176 Arlington Pl | 0.74mi | 3/1.5 (+1) | 1,350 (-9%) | 4mo | $480,000 | $356 | 43 |
| 22 Spirit Ln | 0.53mi | 3/2.5 (+1) | 1,677 (+13%) | 4mo | $555,000 | $331 | 41 |
| 66 Jules Dr | 0.64mi | 2/2.0 | 1,700 (+15%) | 4mo | $589,000 | $346 | 40 |
Match score weights: distance 35% · size 25% · config 20% · recency 20%. Top-matched comps best support the ARV.
Projected returns pro-forma
-3.0% appreciation · 3.0% rent growth · sell at horizon
- IRR
- -9.5%
- Equity multiple
- 0.65×
- Total profit
- $-29,064
- Equity at exit
- $44,582
- IRR
- -0.1%
- Equity multiple
- 1.00×
- Total profit
- $-413
- Equity at exit
- $25,852
Cash invested: $83,720 (down + closing). Projections, not guarantees.
Landlord ↔ Tenant lean methodology
- Overall (CITY)
- 0 Strongly Tenant-Friendly
- State New York
- 15 Strongly Tenant-Friendly · D+10
- County
- — inherits STATE
- City New York
- 0 Strongly Tenant-Friendly · D+34
ZIP-level market 10303
- Home prices YoY
- -24.8%
- Active inventory
- 108
- Price-to-rent
- 8.7×
Monthly cashflow live
- Estimated rent
- $2,862 medium interval (Pro) →
- Mortgage (P&I)
- −$1,568
- Tax from tax record
- −$263 /mo · $3,161/yr
- Insurance
- −$125
- HOA
- −$0
- Vacancy / Maint / Mgmt
- −$601
- Net cashflow
- $305
Break-even live
UW: 25.0% down · 7.5% · 30yr · 1.5% tax · 5.0% vac · 8.0% maint · 8.0% mgmt
Financing live
Cash to close
- Down payment
- $74,750
- Closing costs
- $8,970
- Reserves months
- —
- Total cash needed
- —
Loan-product check · same deal, 3 products live
Conventional
25% down · 7.5% · 30yr
- Down + closing
- —
- Monthly P&I
- —
- Monthly cashflow
- —
- DSCR
- —
- Eligible?
- —
Personal DTI + credit; lowest rate.
DSCR
20% down · 8.5% · 30yr
- Down + closing
- —
- Monthly P&I
- —
- Monthly cashflow
- —
- DSCR
- —
- Eligible?
- —
No personal income docs; deal must DSCR.
Hard money
10% down · 12.0% · 12mo
- Down + closing
- —
- Monthly P&I
- —
- Monthly cashflow
- —
- DSCR
- —
- Eligible?
- —
Short-term bridge; refi at stabilization.
Rent comps 3 comps
| Address | Beds | Baths | Sqft | Rent | $/sqft | DOM | Units | Dist |
|---|---|---|---|---|---|---|---|---|
| 423 Lisk Ave Staten Island, NY | 1.0 | 1.0 | 1344 | $2,762 | $2.06 | 7d | 1 | 0.25mi |
| 5B Ludwig Ln Unit B2 Staten Island, NY | 1.0 | 1.0 | 1800 | $2,700 | $1.50 | 24d | 1 | 0.51mi |
| 527 Willowbrook Rd Staten Island, NY | 3.0 | 2.0 | 1000 | $4,000 | $4.00 | 2d | 1 | 1.45mi |
Listing history 14 events
-
2026-06-17status $299,000 Pending 26 DOM
-
2026-06-16days on market $299,000 Active 26 DOM
-
2026-06-15days on market $299,000 Active 25 DOM
-
2026-06-13days on market $299,000 Active 23 DOM
-
2026-06-10days on market $299,000 Active 19 DOM
-
2026-06-08days on market $299,000 Active 18 DOM
-
2026-06-08days on market $299,000 Active 17 DOM
-
2026-06-04days on market $299,000 Active 14 DOM
-
2026-06-03days on market $299,000 Active 13 DOM
-
2026-06-02days on market $299,000 Active 12 DOM
-
2026-06-01days on market $299,000 Active 11 DOM
-
2026-05-31days on market $299,000 Active 10 DOM
-
2026-05-21$299,000 Active
-
1985-01-31soldstatus $17,000
ⓘ Source: listings_history table (triggers on properties + properties_extension) + one-shot
backfill from property_details.listing_events for pre-trigger history.
Tax reassessment forecast NY · Partial reset (capped growth)
- Current annual tax
- $3,161 · $263/mo
- Projected year-2 tax
- $4,107 · $342/mo
- Expected delta
- +$946/yr (+$79/mo · 29.9%)
ⓘ Screening estimate from a state-policy table — verify with the county assessor before closing.
Climate risk First Street
- Flood 1/10 Low FEMA zone X (unshaded) · 0% chance over 30 yrs
- Wildfire 1/10 Low
- Heat 7/10 Severe 7 d/yr ≥98°F today · 15 d/yr by 30 yrs out
- Wind 6/10 Major 27% chance of damaging wind over 30 yrs
- Air quality 4/10 Moderate 5 unhealthy d/yr today · 6 by 30 yrs out
Nearby sold comps map
Loading sold comps map…
Walkable amenities ~0.75 mi
Loading nearby amenities…
Taxation est. · year 1
- Rental income
- $34,341
- − Mortgage interest
- −$16,749
- − Property taxes
- −$3,161
- − Insurance
- −$1,495
- − Repairs & maintenance
- −$2,747
- − Management
- −$2,747
- − Depreciation
- −$8,698
- Taxable loss
- −$1,257
- Est. tax savings @ 24.0%
- +$302
- After-tax cash flow
- $3,959/yr
For passive investors: Depreciation is non-cash, so a rental often shows a tax loss while cash-flowing — sheltering income. Rental losses are passive: they offset passive income freely, and up to $25,000/yr can offset ordinary (W-2) income if you actively participate and your MAGI is under $100k (phasing out to $0 by $150k); unused losses carry forward. On sale, claimed depreciation is recaptured at up to 25%, and gains may owe capital-gains tax (a 1031 exchange can defer both). Figures are a year-1 estimate at your 24.0% rate — not tax advice; consult a CPA.
Schools (NCES district)
No district data.
Livability — New York
- Score
- 75/100
- State rank
- #268
- US rank
- #4188
Category grades
Schools grade is shown separately in the Schools card above.
Census & demographics
- Census place
- New York, NY
- County
- Richmond County · 404,174 people
- City population
- 7,731,280
- Metro
- New York-Newark-Jersey City, NY-NJ-PA
- Population (ZIP)
- 26,497
- Household income
- $83,947
- Rent vs Own
- Severe rent burden
- 1198.0
Population outlook (Richmond County) Hauer SSP2
- Today (2025)
- 482,784 people
- By 2030
- 481,831 · -0.2%
- By 2040
- 473,159 · -2.0%
- By 2050
- 457,242 · -5.3%
- By 2075
- 408,029 · -15.5%
- By 2100
- 341,459 · -29.3%
Race, ethnicity, and origin ACS 2023
- Neighborhood character
- Highly diverse neighborhood (Simpson 0.72)
- Race & ethnicity
- Hispanic / Latino 38% Black 33% Two or more races 17% White 15% Asian 10%
- Hispanic origin (detail)
- Mexican 5% Puerto Rican 19% Dominican 5%
- Common ancestry
- Romanian 2% Italian 1% Swiss 1%
- Foreign-born
- 26% · Canada, China, Jamaica
- Languages at home
- 57% English-only · Spanish 25% Other Indo-European 6% Chinese 3%
Political lean MEDSL · Richmond
- 2024 margin
- Strong R (+29.8) · D 35.1% · R 64.9%
- 2008→2024 swing
- -25.7pp toward R · 2008: -4.0pp · 2024: -29.8pp
- All cycles
- 2024: R+29.8 2020: R+14.9 2016: R+16.8 2012: D+0.8 2008: R+4.0
Not yet ingested
- Civics
- —
Market trends
- HPI YoY
- ▼ -121.86%
- Current HPI
- 369.2771
- Rent YoY
- —
- Metro
- New York-Newark-Jersey City, NY-NJ-PA
- State GDP YoY
- ▲ 2.60%
- F500 in state
- 92
Industry mix (Fortune 500 HQ in NY)
| Industry | F500 HQs | Revenue |
|---|---|---|
| Financial Services | 10 | $950B |
|
||
| Consumer Goods | 9 | $162B |
|
||
| Insurance | 4 | $225B |
|
||
| Telecommunications | 2 | $144B |
|
||
| Pharmaceuticals | 2 | $112B |
|
||
| Media / Entertainment | 2 | $69B |
|
||
Price history
+1658.8% since first listed2 events — show timeline
- 2026-05-21 Listed $299,000 SIBORMLS
- 1985-01-31 Sold (Public Records) $17,000 Public Records
Property tax history
+2.8%/yrLatest (2025): $3,161 · +0.0% YoY. Source: county tax records.
Cash-flow waterfall
monthlySold comps — $/sqft
last 12 mo · ≤1 miLoading sold comps…