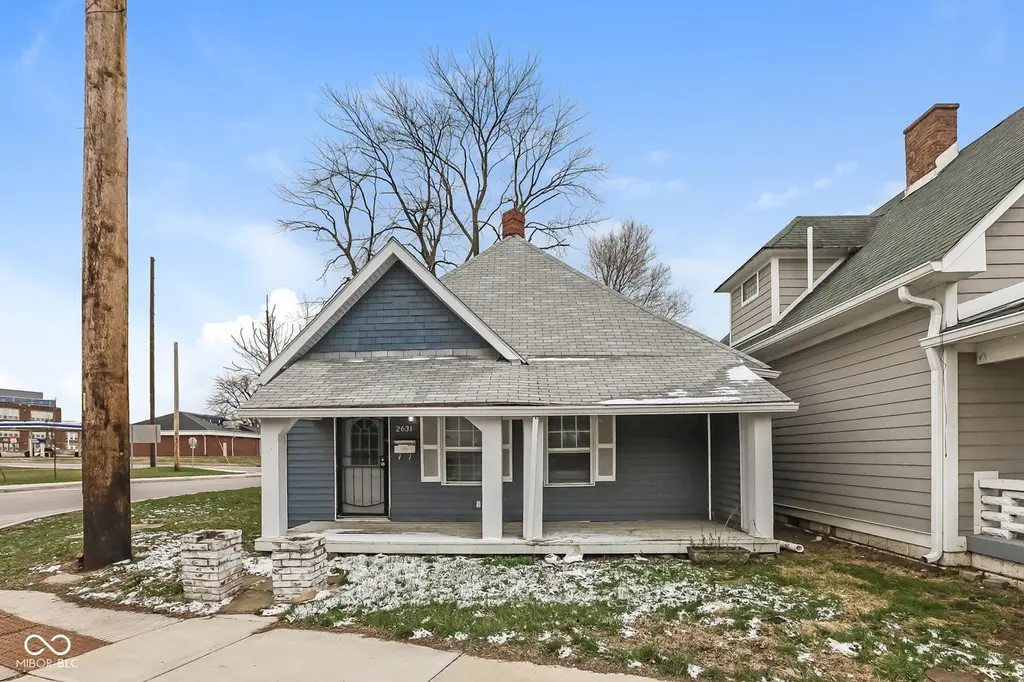
2631 Southeastern Ave · Indianapolis city (balance), IN
Flood risk 1/10 · Minimal
- FEMA flood zone
- X (unshaded)
- Chance of flooding over 30 yrs
- 0.0%
- Est. flood insurance / yr
- $507 – $1,088
Fire risk 1/10 · Minimal
- Est. fire insurance / yr
- $717 – $1,331
Heat risk 4/10 · Minor
- Hot days now (above 101°F)
- 7 days/yr
- Hot days in 30 yrs
- 19 days/yr
Wind risk 2/10 · Minimal
- Chance of severe wind over 30 yrs
- 1.0%
Air-quality risk 4/10 · Minor
- Unhealthy air days now
- 5 days/yr
- Unhealthy air days in 30 yrs
- 7 days/yr
Risk factors via First Street. Map © Google.
Why this score? — see what drove the C+ grade
The composite is a weighted blend of 9 inputs, each scored 0–100. Each bar is that input's sub-score; the figure is the points it added to the 100-point composite (weight × sub-score).
- Cash flow +24.8/30.0
- ARV discount +11.3/15.0
- DSCR +8.0/10.0
- 1% rule +7.1/10.0
- Rent growth +4.3/5.0
- Livability +2.5/5.0
- Condition / age +2.5/5.0
- Schools +1.4/10.0
- Appreciation +0.0/10.0
$124,999
🖨 Deal sheet 📄 Offer letter ✓ Due diligence
Listing remarks MLS
This property offers a great opportunity for a buyer to add their own finishing touch and call it home or for an investor to start or add to a portfolio. This property is perfectly located within walking distance of a grocery store, shops, and restaurants. Additionally, you can be in downtown Indianapolis within a few minutes in a car or to most of the immediate suburbs within 20-30 minutes. Do not hesitate to check this one out as it surely will not last long!
Key facts
- 3,964 sq ft lot
- Garage
- Built 1880
Tags
Neighborhood map
What this means for you Summary
Snapshot
- This is a 4-bed/2.0-bath single-family listed at $125k.
Deal economics
- At list price, monthly cash flow is $265 ($3k/yr) — positive.
- The deal already cash-flows at list — no discount required.
- Meets the 1% rule at list price ($2k rent vs $125k).
- Recommended offer: $117k (6.0% below list) — sets the bar for market timing.
- Cap rate 8.8% vs local median 4.4% in Indianapolis city (balance) — top-decile yield for the area; either an underpriced asset or a hidden risk that comps aren't pricing in. Stress-test before assuming the spread holds.
Location & tenants
- Location reads: area grade C — affects rentability + tenant quality, not the cash-flow math above.
- Indianapolis Public Schools (urban): math 14% / reading 20% proficiency, ranked #286 of 301 in IN (top 95%) — low school quality limits family demand, transient renter base, plan for 1-2y turnover; 77% free/reduced lunch — lower-income household profile, screen leases tightly.
- Market conditions: Rents rising fast (+7.3%/yr); 480 active listings in the ZIP; 40 comparable units currently listed for rent nearby; rentals lingering (median 44d on market — plan ~5-8 weeks vacancy on turnover, expect pricing pressure); 50% of comp listings sitting > 30 days — soft ceiling on asking rent; 1,906 units permitted in Marion County in 2024 (621 in 5+ unit buildings).
- This rent runs 37% of the median local income ($49k/yr) — at the standard rent-burdened threshold; future hikes will face affordability resistance.
Forward outlook
- Local home prices are declining (-3.0%/yr); year-one equity from $864 of loan paydown is wiped out by about $4k of value loss. Plan a longer hold.
- Marion County population projected at +18% by 2050 — long-run rental-demand tailwind backs the buy-and-hold thesis.
- At projected returns (-3.0% appreciation + 7.3% rent growth), your $35k cash investment doubles in ~8 years — after that, you're playing with house money.
Negotiation context
- It's been on market 69 days — a 6% lower offer ($117k) is reasonable based on typical stale-listing flexibility.
- 10 sale attempts since 18y ago with the ask held roughly flat each time — persistent listings suggest the price (not the market) is what's stuck; bring a comps-based counter.
- Current owner paid $80k; list at $125k implies a 56% gain — meaningful room to come down on a strong offer.
Risks & watch-outs
- Watch-outs: built in 1880 — expect roof / HVAC / electrical / plumbing capex.
Questions for the listing agent
- It's been on market 69 days. Have you received any prior offers? Is the seller open to a 6% concession, seller financing, or rate buy-down credit?
- Built in 1880 — when were the roof, HVAC, electrical panel, plumbing, and water heater last replaced?
- Why hasn't it sold? Are there any deal-killer items the seller is aware of (foundation, flood, title, zoning, code violations)?
- Is there a deadline driving the sale (1031 exchange, divorce, estate, relocation)? That informs how much negotiation room exists.
- What's the average days-on-market for RENTAL listings here right now (not sales)? A rising rental-DOM trend means longer vacancies and softer asking-rent achievability than the comps imply.
- What's the recent tenant-quality profile in this submarket — average credit score on applications, eviction rate, late-payment / NSF rate, and stable-employment percentage? A property-management company in the area should have these aggregated.
- How much new for-sale + rental construction is in the pipeline within 1–3 miles? Heavy new supply typically softens prices + rents 12–24 months out; constrained supply supports both.
Investment metrics
- 1% rule
- 1.21% ✓
- Cap rate
- 8.84%
- Cash-on-cash
- 9.09%
- DSCR
- 1.40
- GRM
- 6.9
CMA / ARV
- ARV (median comp)
- $136,491
- List price
- $124,999
- Delta
- -8.42%
- Verdict
- FAIR
- Comps
- 20 within 1.0 mi
Show comp detail 12 sales within ~0.75 mi
| Address | Dist | Beds/Ba | Sqft | Sold | Price | $/sf | Match |
|---|---|---|---|---|---|---|---|
| 3037 Newton Ave | 0.40mi | 3/1.0 (-1) | 1,074 (+0%) | 2mo | $156,000 | $145 | 70 |
| 331 S Oakland Ave | 0.31mi | 3/1.0 (-1) | 1,056 (-2%) | 5mo | $135,000 | $128 | 70 |
| 2134 Spann Ave | 0.39mi | 3/1.0 (-1) | 1,085 (+1%) | 1mo | $125,000 | $115 | 70 |
| 3040 English Ave | 0.29mi | 3/1.0 (-1) | 1,140 (+6%) | 9mo | $80,000 | $70 | 60 |
| 1828 E Maryland St | 0.65mi | 3/1.0 (-1) | 1,100 (+3%) | 4mo | $105,000 | $95 | 53 |
| 1150 Vandeman St | 0.75mi | 4/1.5 | 1,104 (+3%) | 9mo | $160,000 | $145 | 51 |
| 3780 E Pleasant Run Parkway North Dr | 0.72mi | 3/1.0 (-1) | 1,026 (-4%) | 3mo | $136,000 | $133 | 48 |
| 158 Harlan St | 0.53mi | 3/1.0 (-1) | 1,172 (+9%) | 3mo | $57,000 | $49 | 48 |
| 3106 Newton Ave | 0.47mi | 3/2.0 (-1) | 912 (-15%) | 1mo | $95,500 | $105 | 47 |
| 1641 Deloss St | 0.71mi | 3/1.5 (-1) | 1,038 (-3%) | 9mo | $205,000 | $197 | 47 |
| 1740 Spann Ave | 0.64mi | 3/2.0 (-1) | 1,178 (+10%) | 7mo | $280,000 | $238 | 43 |
| 315 S Dearborn St | 0.43mi | 3/1.0 (-1) | 1,232 (+15%) | 9mo | $159,000 | $129 | 39 |
Match score weights: distance 35% · size 25% · config 20% · recency 20%. Top-matched comps best support the ARV.
Projected returns pro-forma
-3.0% appreciation · 7.31% rent growth · sell at horizon
- IRR
- 2.5%
- Equity multiple
- 1.10×
- Total profit
- $3,507
- Equity at exit
- $18,638
- IRR
- 16.0%
- Equity multiple
- 2.59×
- Total profit
- $55,634
- Equity at exit
- $10,808
Cash invested: $35,000 (down + closing). Projections, not guarantees.
Landlord ↔ Tenant lean methodology
- Overall (STATE)
- 90 Strongly Landlord-Friendly
- State Indiana
- 90 Strongly Landlord-Friendly · R+11
- County
- — inherits STATE
- City
- — inherits STATE
ZIP-level market 46201
- Home prices YoY
- -33.9%
- Rents YoY
- 7.3%
- Active inventory
- 480
- Price-to-rent
- 6.9×
Monthly cashflow live
- Estimated rent
- $1,508 high interval (Pro) →
- Mortgage (P&I)
- −$656
- Tax from tax record
- −$218 /mo · $2,621/yr
- Insurance
- −$52
- HOA
- −$0
- Vacancy / Maint / Mgmt
- −$317
- Net cashflow
- $265
Break-even live
UW: 25.0% down · 7.5% · 30yr · 1.5% tax · 5.0% vac · 8.0% maint · 8.0% mgmt
Financing live
Cash to close
- Down payment
- $31,250
- Closing costs
- $3,750
- Reserves months
- —
- Total cash needed
- —
Loan-product check · same deal, 3 products live
Conventional
25% down · 7.5% · 30yr
- Down + closing
- —
- Monthly P&I
- —
- Monthly cashflow
- —
- DSCR
- —
- Eligible?
- —
Personal DTI + credit; lowest rate.
DSCR
20% down · 8.5% · 30yr
- Down + closing
- —
- Monthly P&I
- —
- Monthly cashflow
- —
- DSCR
- —
- Eligible?
- —
No personal income docs; deal must DSCR.
Hard money
10% down · 12.0% · 12mo
- Down + closing
- —
- Monthly P&I
- —
- Monthly cashflow
- —
- DSCR
- —
- Eligible?
- —
Short-term bridge; refi at stabilization.
Rent comps 40 comps
| Address | Beds | Baths | Sqft | Rent | $/sqft | DOM | Units | Dist |
|---|---|---|---|---|---|---|---|---|
| 2631 Southeastern Ave Indianapolis, IN | 3.0 | 2.0 | 1072 | $1,195 | $1.11 | 11d | 1 | 0.02mi |
| 350 S Oxford St Indianapolis, IN | 3.0 | 1.0 | 826 | $1,300 | $1.57 | 43d | 1 | 0.19mi |
| 323 S Rural St Indianapolis, IN | 3.0 | 1.5 | 1090 | $1,050 | $0.96 | 43d | 1 | 0.20mi |
| 241 S Temple Ave Indianapolis, IN | 3.0 | 2.0 | 1200 | $1,350 | $1.12 | 43d | 1 | 0.27mi |
| 420 Hamilton Ave Unit A Indianapolis, IN | 3.0 | 2.0 | 1350 | $1,550 | $1.15 | 43d | 1 | 0.41mi |
| 420 Hamilton Ave Unit B Indianapolis, IN | 3.0 | 2.0 | 1350 | $1,450 | $1.07 | 10d | 1 | 0.41mi |
| 909 Saint Peter St Indianapolis, IN | 3.0 | 2.0 | 1200 | $1,800 | $1.50 | 43d | 1 | 0.42mi |
| 253 S Gray St Indianapolis, IN | 3.0 | 1.5 | 1176 | $1,660 | $1.41 | 2d | 1 | 0.43mi |
| 2218 Pleasant St Indianapolis, IN | 3.0 | 2.0 | 1376 | $2,499 | $1.82 | 23d | 1 | 0.46mi |
| 151 Harlan St Unit A Indianapolis, IN | 3.0 | 2.0 | 1250 | $1,549 | $1.24 | 23d | 1 | 0.51mi |
| 2015 E Maryland St Indianapolis, IN | 3.0 | 2.0 | 1250 | $1,495 | $1.20 | 43d | 1 | 0.55mi |
| 1123 Churchman Ave Indianapolis, IN | 3.0 | 1.5 | 1472 | $1,360 | $0.92 | 13d | 1 | 0.66mi |
| 39 N Tacoma Ave Indianapolis, IN | 3.0 | 1.0 | 1233 | $895 | $0.73 | 43d | 1 | 0.66mi |
| 28 S Dearborn St Unit A Indianapolis, IN | 3.0 | 1.0 | 1100 | $1,400 | $1.27 | 10d | 1 | 0.67mi |
| 1053 Villa Ave Indianapolis, IN | 3.0 | 1.5 | 1281 | $1,400 | $1.09 | 43d | 1 | 0.68mi |
| 512 S State Ave Unit 512 State 120% AMI Indianapolis, IN | 3.0 | 1.0 | 1200 | $1,400 | $1.17 | 23d | 1 | 0.69mi |
| 20 N Gray St Indianapolis, IN | 3.0 | 2.0 | 1300 | $1,800 | $1.38 | 43d | 1 | 0.73mi |
| 37 S Tuxedo St Indianapolis, IN | 3.0 | 1.0 | 950 | $1,150 | $1.21 | 43d | 1 | 0.75mi |
| 228 N Tacoma Ave Indianapolis, IN | 3.0 | 1.0 | 1200 | $1,100 | $0.92 | 10d | 1 | 0.75mi |
| 12 N Randolph St Indianapolis, IN | 3.0 | 1.0 | 1485 | $1,650 | $1.11 | 43d | 1 | 0.78mi |
| 44 Parkview Ave Indianapolis, IN | 3.0 | 2.0 | 1250 | $1,695 | $1.36 | 20d | 1 | 0.79mi |
| 3702 Hoyt Ave Indianapolis, IN | 3.0 | 2.0 | 960 | $1,500 | $1.56 | 13d | 1 | 0.79mi |
| 44 E Parkview Ave Unit A Indianapolis, IN | 3.0 | 2.0 | 1296 | $1,695 | $1.31 | 23d | 1 | 0.79mi |
| 44 E Parkview Ave Unit B Indianapolis, IN | 3.0 | 2.0 | 1297 | $1,695 | $1.31 | 43d | 1 | 0.79mi |
| 3706 Hoyt Ave Indianapolis, IN | 3.0 | 1.0 | 960 | $1,500 | $1.56 | 13d | 1 | 0.80mi |
| 43 N Randolph St Indianapolis, IN | 3.0 | 2.0 | 1250 | $1,399 | $1.12 | 43d | 1 | 0.81mi |
| 1512 English Ave Indianapolis, IN | 3.0 | 2.0 | 1416 | $1,650 | $1.17 | 4d | 1 | 0.82mi |
| 253 N Gray St Indianapolis, IN | 3.0 | 1.5 | 1176 | $1,660 | $1.41 | 7d | 1 | 0.86mi |
| 113 S Arsenal Ave Indianapolis, IN | 3.0 | 2.0 | 1296 | $1,800 | $1.39 | 43d | 1 | 0.88mi |
| 145 McKim Ave Indianapolis, IN | 3.0 | 2.5 | 1470 | $2,195 | $1.49 | 44d | 1 | 0.91mi |
| 1505 S Rural St Indianapolis, IN | 3.0 | 1.0 | 1104 | $1,500 | $1.36 | 12d | 1 | 0.91mi |
| 418 Eastern Ave Indianapolis, IN | 3.0 | 1.0 | 1008 | $1,325 | $1.31 | 23d | 1 | 0.92mi |
| 409 N Oakland Ave Unit 411 Indianapolis, IN | 3.0 | 2.0 | 1300 | $1,495 | $1.15 | 43d | 1 | 0.94mi |
| 1527 Prospect St Indianapolis, IN | 3.0 | 1.5 | 1150 | $1,200 | $1.04 | 23d | 1 | 0.96mi |
| 439 N Forest Ave Indianapolis, IN | 3.0 | 2.0 | 1030 | $1,200 | $1.17 | 23d | 1 | 0.96mi |
| 1541 E Ohio St Indianapolis, IN | 3.0 | 1.0 | 1400 | $1,399 | $1.00 | 43d | 1 | 0.97mi |
| 3518 Terrace Ave Indianapolis, IN | 3.0 | 1.0 | 864 | $1,300 | $1.50 | 43d | 1 | 0.98mi |
| 1534 E Ohio St Indianapolis, IN | 3.0 | 2.5 | 1204 | $1,650 | $1.37 | 16d | 1 | 0.99mi |
| 101 N Arsenal Ave Indianapolis, IN | 3.0 | 2.0 | 1300 | $1,749 | $1.35 | 43d | 1 | 1.00mi |
| 416 N Hamilton Ave Unit 416-A Indianapolis, IN | 3.0 | 2.0 | 1350 | $1,500 | $1.11 | 43d | 1 | 1.00mi |
Listing history 27 events
-
2026-06-07days on market $124,999 Active 69 DOM
-
2026-06-03days on market $124,999 Active 65 DOM
-
2026-06-02days on market $124,999 Active 64 DOM
-
2026-06-01days on market $124,999 Active 63 DOM
-
2026-05-31days on market $124,999 Active 62 DOM
-
2026-05-15status Active 465-char remark
Show marketing remark (465 chars)
This property offers a great opportunity for a buyer to add their own finishing touch and call it home or for an investor to start or add to a portfolio. This property is perfectly located within walking distance of a grocery store, shops, and restaurants. Additionally, you can be in downtown Indianapolis within a few minutes in a car or to most of the immediate suburbs within 20-30 minutes. Do not hesitate to check this one out as it surely will not last long!
-
2026-05-12status Pending 465-char remark
Show marketing remark (465 chars)
This property offers a great opportunity for a buyer to add their own finishing touch and call it home or for an investor to start or add to a portfolio. This property is perfectly located within walking distance of a grocery store, shops, and restaurants. Additionally, you can be in downtown Indianapolis within a few minutes in a car or to most of the immediate suburbs within 20-30 minutes. Do not hesitate to check this one out as it surely will not last long!
-
2026-04-17price $124,999 465-char remark
Show marketing remark (465 chars)
This property offers a great opportunity for a buyer to add their own finishing touch and call it home or for an investor to start or add to a portfolio. This property is perfectly located within walking distance of a grocery store, shops, and restaurants. Additionally, you can be in downtown Indianapolis within a few minutes in a car or to most of the immediate suburbs within 20-30 minutes. Do not hesitate to check this one out as it surely will not last long!
-
2026-03-31status Active 465-char remark
Show marketing remark (465 chars)
This property offers a great opportunity for a buyer to add their own finishing touch and call it home or for an investor to start or add to a portfolio. This property is perfectly located within walking distance of a grocery store, shops, and restaurants. Additionally, you can be in downtown Indianapolis within a few minutes in a car or to most of the immediate suburbs within 20-30 minutes. Do not hesitate to check this one out as it surely will not last long!
-
2026-03-20status Pending 465-char remark
Show marketing remark (465 chars)
This property offers a great opportunity for a buyer to add their own finishing touch and call it home or for an investor to start or add to a portfolio. This property is perfectly located within walking distance of a grocery store, shops, and restaurants. Additionally, you can be in downtown Indianapolis within a few minutes in a car or to most of the immediate suburbs within 20-30 minutes. Do not hesitate to check this one out as it surely will not last long!
-
2026-03-16$129,999 Active 465-char remark
Show marketing remark (465 chars)
This property offers a great opportunity for a buyer to add their own finishing touch and call it home or for an investor to start or add to a portfolio. This property is perfectly located within walking distance of a grocery store, shops, and restaurants. Additionally, you can be in downtown Indianapolis within a few minutes in a car or to most of the immediate suburbs within 20-30 minutes. Do not hesitate to check this one out as it surely will not last long!
-
2024-02-14historical $1,050
-
2024-02-05price $1,050
-
2024-01-18$1,100
-
2022-11-18historical
-
2022-05-23soldstatus $80,000 Closed 516-char remark
Show marketing remark (516 chars)
Perfect as an investment opportunity, personal home, or BOTH! This Twin Aire traditional American charmer is conveniently located near the new CDC development offering easy access to shopping, dining and entertainment. Also conveniently located just a short drive from the heart of Fountain Square and Downtown Indianapolis! The interior features a few recent updates, but it is also need of some cosmetic updates, repair of some termite damage, and other repairs, so the home is ready for your own personal touches.
-
2022-05-09status Pending 516-char remark
Show marketing remark (516 chars)
Perfect as an investment opportunity, personal home, or BOTH! This Twin Aire traditional American charmer is conveniently located near the new CDC development offering easy access to shopping, dining and entertainment. Also conveniently located just a short drive from the heart of Fountain Square and Downtown Indianapolis! The interior features a few recent updates, but it is also need of some cosmetic updates, repair of some termite damage, and other repairs, so the home is ready for your own personal touches.
-
2022-05-04$65,000 Active 516-char remark
Show marketing remark (516 chars)
Perfect as an investment opportunity, personal home, or BOTH! This Twin Aire traditional American charmer is conveniently located near the new CDC development offering easy access to shopping, dining and entertainment. Also conveniently located just a short drive from the heart of Fountain Square and Downtown Indianapolis! The interior features a few recent updates, but it is also need of some cosmetic updates, repair of some termite damage, and other repairs, so the home is ready for your own personal touches.
-
2022-04-30historical
-
2022-04-30status Active
-
2022-04-22status Active
-
2022-04-09status Pending
-
2022-04-06status Active
-
2022-03-21status Pending
-
2022-03-13$96,000 Active
-
2009-01-03historical
-
2008-07-02$37,000
ⓘ Source: listings_history table (triggers on properties + properties_extension) + one-shot
backfill from property_details.listing_events for pre-trigger history.
Tax reassessment forecast IN · Partial reset (capped growth)
- Current annual tax
- $2,621 · $218/mo
- Projected year-2 tax
- $2,621 · $218/mo
- Expected delta
- $0/yr ($0/mo · 0.0%)
ⓘ Screening estimate from a state-policy table — verify with the county assessor before closing.
Climate risk First Street
- Flood 1/10 Low FEMA zone X (unshaded) · 0% chance over 30 yrs
- Wildfire 1/10 Low
- Heat 4/10 Moderate 7 d/yr ≥101°F today · 19 d/yr by 30 yrs out
- Wind 2/10 Low 100% chance of damaging wind over 30 yrs
- Air quality 4/10 Moderate 5 unhealthy d/yr today · 7 by 30 yrs out
Nearby sold comps map
Loading sold comps map…
Walkable amenities ~0.75 mi
Loading nearby amenities…
Taxation est. · year 1
- Rental income
- $18,091
- − Mortgage interest
- −$7,002
- − Property taxes
- −$2,621
- − Insurance
- −$625
- − Repairs & maintenance
- −$1,447
- − Management
- −$1,447
- − Depreciation
- −$3,636
- Taxable income
- $1,313
- Est. tax owed @ 24.0%
- −$315
- After-tax cash flow
- $2,865/yr
For passive investors: Depreciation is non-cash, so a rental often shows a tax loss while cash-flowing — sheltering income. Rental losses are passive: they offset passive income freely, and up to $25,000/yr can offset ordinary (W-2) income if you actively participate and your MAGI is under $100k (phasing out to $0 by $150k); unused losses carry forward. On sale, claimed depreciation is recaptured at up to 25%, and gains may owe capital-gains tax (a 1031 exchange can defer both). Figures are a year-1 estimate at your 24.0% rate — not tax advice; consult a CPA.
Schools (NCES district)
- District
- Indianapolis Public Schools
- NCES district ID
- 1804770
- Math proficiency
- 14% ▼ -7.00%
- Reading proficiency
- 20% ▼ -3.00%
- Median HH income
- $32,034
- Composite
- 13.69/100
- National rank
- #9499
- State rank
- #286 of 301 in IN
Livability — Indianapolis city (balance)
No livability data for this city. (Only ~50 U.S. cities are tracked.)
Census & demographics
- Census place
- Indianapolis city (balance), IN
- County
- Marion County · 998,460 people
- City population
- 881,119
- Metro
- Indianapolis-Carmel-Anderson, IN
- Population (ZIP)
- 30,335
- Household income
- $49,195
- Rent vs Own
- Severe rent burden
- 1906.0
Population outlook (Marion County) Hauer SSP2
- Today (2025)
- 1,025,572 people
- By 2030
- 1,065,727 · +3.9%
- By 2040
- 1,141,577 · +11.3%
- By 2050
- 1,208,920 · +17.9%
- By 2075
- 1,367,288 · +33.3%
- By 2100
- 1,438,201 · +40.2%
Race, ethnicity, and origin ACS 2023
- Neighborhood character
- Diverse neighborhood (Simpson 0.63)
- Race & ethnicity
- White 53% Hispanic / Latino 23% Black 18% Two or more races 9%
- Hispanic origin (detail)
- Mexican 14% Puerto Rican 2%
- Common ancestry
- Slovak 2% Lithuanian 2% Italian 1%
- Foreign-born
- 9% · Canada
- Languages at home
- 81% English-only · Spanish 17%
Political lean MEDSL · Marion
- 2024 margin
- Strong D (+27.7) · D 63.0% · R 35.3% · Other 1.7%
- 2008→2024 swing
- -0.7pp no change · 2008: 28.4pp · 2024: 27.7pp
- All cycles
- 2024: D+27.7 2020: D+29.1 2016: D+22.8 2012: D+22.2 2008: D+28.4
Not yet ingested
- Civics
- —
Market trends
- HPI YoY
- ▼ -192.51%
- Current HPI
- 375.0969
- Rent YoY
- ▲ 7.31%
- Metro
- Indianapolis-Carmel-Anderson, IN
- State GDP YoY
- ▲ 2.90%
- F500 in state
- 18
Industry mix (Fortune 500 HQ in IN)
| Industry | F500 HQs | Revenue |
|---|---|---|
| Industrial Machinery | 2 | $37B |
|
||
| Healthcare | 1 | $177B |
|
||
| Pharmaceuticals | 1 | $45B |
|
||
| Metals / Steel | 1 | $18B |
|
||
| Agriculture | 1 | $17B |
|
||
| Packaging | 1 | $12B |
|
||
Price history
+237.8% since first listed22 events — show timeline
- 2026-05-15 Relisted — MIBOR as Distributed by MLS Grid
- 2026-05-12 Pending — MIBOR as Distributed by MLS Grid
- 2026-04-17 Price Changed $124,999 MIBOR as Distributed by MLS Grid
- 2026-03-31 Relisted — MIBOR as Distributed by MLS Grid
- 2026-03-20 Pending — MIBOR as Distributed by MLS Grid
- 2026-03-16 Listed $129,999 MIBOR as Distributed by MLS Grid
- 2024-02-14 Rental Removed $1,050 MIBOR
- 2024-02-05 Price Changed $1,050 MIBOR
- 2024-01-18 Listed for Rent $1,100 MIBOR
- 2022-11-18 Rental Removed — RENT.
- 2022-05-23 Sold (MLS) $80,000 MIBOR as Distributed by MLS Grid
- 2022-05-09 Pending — MIBOR as Distributed by MLS Grid
- 2022-05-04 Listed $65,000 MIBOR as Distributed by MLS Grid
- 2022-04-30 Listing Removed — MIBOR as Distributed by MLS Grid
- 2022-04-30 Relisted — MIBOR as Distributed by MLS Grid
- 2022-04-22 Relisted — MIBOR as Distributed by MLS Grid
- 2022-04-09 Pending — MIBOR as Distributed by MLS Grid
- 2022-04-06 Relisted — MIBOR as Distributed by MLS Grid
- 2022-03-21 Pending — MIBOR as Distributed by MLS Grid
- 2022-03-13 Listed $96,000 MIBOR as Distributed by MLS Grid
- 2009-01-03 Listing Removed — MIBOR as Distributed by MLS Grid
- 2008-07-02 Listed $37,000 MIBOR as Distributed by MLS Grid
Property tax history
+14.3%/yrLatest (2025): $2,621 · +14.2% YoY. Source: county tax records.
Cash-flow waterfall
monthlySold comps — $/sqft
last 12 mo · ≤1 miLoading sold comps…