17258 Acapulco Rd #121 · Burnt Store Marina, FL
Flood risk 8/10 · Major
- FEMA flood zone
- AE
- Chance of flooding over 30 yrs
- 0.97%
- Est. flood insurance / yr
- $1,737 – $8,500
Fire risk 4/10 · Minor
- Est. fire insurance / yr
- $947 – $1,759
Heat risk 10/10 · Severe
- Hot days now (above 107°F)
- 7 days/yr
- Hot days in 30 yrs
- 30 days/yr
Wind risk 10/10 · Severe
- Chance of severe wind over 30 yrs
- 99.0%
Air-quality risk 3/10 · Minor
- Unhealthy air days now
- 2 days/yr
- Unhealthy air days in 30 yrs
- 2 days/yr
Risk factors via First Street. Map © Google.
Why this score? — see what drove the B grade
The composite is a weighted blend of 9 inputs, each scored 0–100. Each bar is that input's sub-score; the figure is the points it added to the 100-point composite (weight × sub-score).
- Cash flow +30.0/30.0
- 1% rule +10.0/10.0
- DSCR +10.0/10.0
- ARV discount +7.5/15.0
- Schools +4.6/10.0
- Livability +3.6/5.0
- Rent growth +2.5/5.0
- Condition / age +2.5/5.0
- Appreciation +0.0/10.0
$250,000
🖨 Deal sheet 📄 Offer letter ✓ Due diligence
Listing remarks
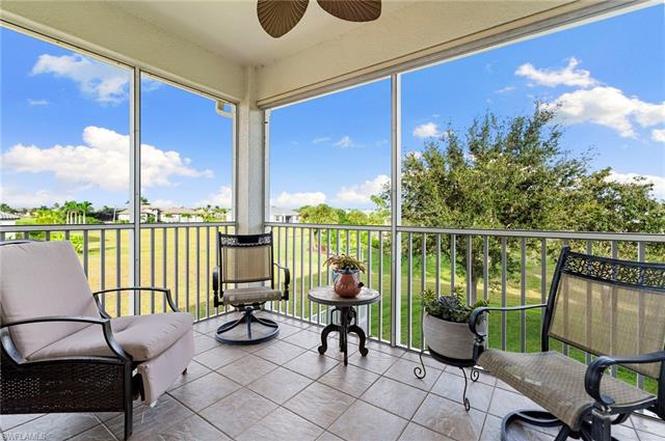
Tucked inside the quiet and well-maintained Acapulco Lakes community, this southeast-facing 3-bedroom, 2-bath corner unit offers low-maintenance living with stylish upgrades and thoughtful details throughout. Enjoy the peace of mind that comes with a brand-new 2024 roof and hurricane-impact doors and windows, while the open-concept layout and volume ceilings create a bright, airy space that lives large. The heart of the home features crown molding, a spacious living and dining area, and direct access to a private screened lanai—the perfect spot to enjoy your morning coffee or unwind in the evening breeze. Designed with everyday ease in mind, the attached 1-car garage includes a workbe
Key facts
- Attached garage
- Brand-new roof
- Workbench area
Tags
Property features AI
Finance
- Other: Has freshwater lake waterfront
- Financial info: Multi-unit property: 2 units per floor, 2 floors, 6 units in building, 18 units in complex
- HOA & community: Mandatory HOA with professional management; Monthly HOA fee; HOA maintains insurance, lawn/land maintenance, management, reserves, sewer and trash removal; Community amenities include boat ramp, community pool, and internet access; Non-gated community; Total annual recurring HOA fees listed
Exterior
- Parking: Attached garage (1 garage space); Additional paved parking for 2+ vehicles and guest parking
- Security: Impact resistant doors; Impact resistant windows; Smoke detectors
- Utilities: Central water; Central sewer; Cable available; Power: Central electric
- Home design: Residential carriage/coach end-unit; Low rise (1-3) building design; Rear exposure facing SE
- Construction: Concrete block construction; Stucco exterior finish; Tile roof; Built in 2008; Foundation information not specified
- Exterior features: Screened lanai/porch; Patio; Landscaped area view; Zero lot line; City-maintained paved public road access
Interior
- Kitchen: Pantry; Dishwasher; Disposal; Microwave; Refrigerator/Freezer; Self-cleaning oven; Breakfast bar; Dining (living) area
- Bedrooms: 3 bedrooms; Split bedroom floor plan
- Flooring: Carpet; Tile
- Bathrooms: 2 full bathrooms; Master bath with combo tub/shower and dual sinks; Guest bathroom
- Heating & cooling: Central electric heat; Central electric cooling; Ceiling fans
- Interior features: Built-in cabinets; Cable prewire; Closet cabinets; Foyer; Pantry; Smoke detectors; Volume ceiling; Walk-in closet; Furnished; 8 total rooms
- Laundry & utility: Washer and dryer in residence; Auto garage door
Neighborhood map
What this means for you Summary
Snapshot
- This is a 3-bed/2.0-bath condo listed at $250k.
Deal economics
- At list price, monthly cash flow is $833 ($10k/yr) — positive.
- The deal already cash-flows at list — no discount required.
- Meets the 1% rule at list price ($4k rent vs $250k).
- Recommended offer: $220k (12.0% below list) — sets the bar for market timing.
- Cap rate 12.3% vs local median 4.8% in Burnt Store Marina — top-decile yield for the area; either an underpriced asset or a hidden risk that comps aren't pricing in. Stress-test before assuming the spread holds.
Location & tenants
- Location reads 72/100 on livability (#354 in FL) — a middle-class / working-renter tenant base. Strengths: crime A+, employment A+, housing A+; Watch: cost of living C-, amenities F, commute F.
- Charlotte (suburban): math 54% / reading 54% proficiency, ranked #22 of 73 in FL (top 30%) — acceptable for families but not a draw, mixed tenant base, ~2y average lease.
- Zoned schools: East Elementary School (math 67% / reading 68%, grade B+, #435 of 2,144 statewide, top 21%, 761 students, 52% FRL); Charlotte High School (math 44% / reading 46%, grade D-, #228 of 667 statewide, top 35%, 1,994 students, 41% FRL).
- Market conditions: 1481 active listings in the ZIP; 26 comparable units currently listed for rent nearby; rentals at typical pace (median 24d on market — plan ~3-4 weeks tenant-placement turnaround); solid renter incomes; 4,585 units permitted in Charlotte County in 2024 (703 in 5+ unit buildings).
- At $4,477/mo this rent would consume 70% of the median local household income ($77k/yr) (locally 226% of renters already pay >50% of income on rent) — very limited rent-growth headroom before tenants either downsize or default.
Forward outlook
- Local home prices are declining (-3.0%/yr); year-one equity from $2k of loan paydown is wiped out by about $8k of value loss. Plan a longer hold.
- Charlotte County population projected at +24% by 2050 — long-run rental-demand tailwind backs the buy-and-hold thesis.
- At projected returns (-3.0% appreciation + 3.0% rent growth), your $70k cash investment doubles in ~9 years — after that, you're playing with house money.
Negotiation context
- It's been on market 262 days — a 12% lower offer ($220k) is reasonable based on typical stale-listing flexibility.
Risks & watch-outs
- Watch-outs: flood insurance adds $427/mo.
- Climate carrying-cost: in FEMA flood zone AE (mandatory federal flood insurance); severe wind risk, 99% chance of damaging wind over 30y; extreme-heat days projected 7→30/yr by 2055 (HVAC capex compounding) — expect insurance premiums to compound above CPI over the hold.
Questions for the listing agent
- It's been on market 262 days. Have you received any prior offers? Is the seller open to a 12% concession, seller financing, or rate buy-down credit?
- What's the actual annual flood-insurance premium (NFIP or private), and is the property in a SFHA with mandatory coverage?
- What does the HOA fee cover, when was the last increase, and are there any pending special assessments or reserve-fund shortfalls?
- Any open or pending special assessments — roof, HVAC, plumbing, elevator, façade? What's the per-unit balance and payoff schedule, and is the seller paying it off at close or rolling it to the buyer?
- Why hasn't it sold? Are there any deal-killer items the seller is aware of (foundation, flood, title, zoning, code violations)?
- Is there a deadline driving the sale (1031 exchange, divorce, estate, relocation)? That informs how much negotiation room exists.
- What's the average days-on-market for RENTAL listings here right now (not sales)? A rising rental-DOM trend means longer vacancies and softer asking-rent achievability than the comps imply.
- What's the recent tenant-quality profile in this submarket — average credit score on applications, eviction rate, late-payment / NSF rate, and stable-employment percentage? A property-management company in the area should have these aggregated.
- How much new apartment / multifamily construction is in the pipeline within 1–3 miles? Heavy new supply (>2% of stock underway) typically softens rents 12–24 months out; light construction supports rent growth.
Investment metrics
- 1% rule
- 1.79% ✓
- Cap rate
- 12.34%
- Cash-on-cash
- 21.60%
- DSCR
- 1.96
- GRM
- 4.7
CMA / ARV
No comps found within radius.
Projected returns pro-forma
-3.0% appreciation · 3.0% rent growth · sell at horizon
- IRR
- 4.9%
- Equity multiple
- 1.19×
- Total profit
- $13,233
- Equity at exit
- $37,276
- IRR
- 14.5%
- Equity multiple
- 2.18×
- Total profit
- $82,577
- Equity at exit
- $21,615
Cash invested: $70,000 (down + closing). Projections, not guarantees.
Landlord ↔ Tenant lean methodology
- Overall (STATE)
- 87 Strongly Landlord-Friendly
- State Florida
- 87 Strongly Landlord-Friendly · R+3
- County
- — inherits STATE
- City
- — inherits STATE
ZIP-level market 33955
- Home prices YoY
- -24.5%
- Active inventory
- 1481
- Price-to-rent
- 4.7×
Monthly cashflow live
- Estimated rent
- $4,477 high interval (Pro) →
- Mortgage (P&I)
- −$1,311
- Tax from tax record
- −$188 /mo · $2,262/yr
- Insurance
- −$104
- Flood insurance flood zone
- −$427 /mo · $5,118/yr
- HOA
- −$673
- Vacancy / Maint / Mgmt
- −$940
- Net cashflow
- $833
Break-even live
UW: 25.0% down · 7.5% · 30yr · 1.5% tax · 5.0% vac · 8.0% maint · 8.0% mgmt
Financing live
Cash to close
- Down payment
- $62,500
- Closing costs
- $7,500
- Reserves months
- —
- Total cash needed
- —
Loan-product check · same deal, 3 products live
Conventional
25% down · 7.5% · 30yr
- Down + closing
- —
- Monthly P&I
- —
- Monthly cashflow
- —
- DSCR
- —
- Eligible?
- —
Personal DTI + credit; lowest rate.
DSCR
20% down · 8.5% · 30yr
- Down + closing
- —
- Monthly P&I
- —
- Monthly cashflow
- —
- DSCR
- —
- Eligible?
- —
No personal income docs; deal must DSCR.
Hard money
10% down · 12.0% · 12mo
- Down + closing
- —
- Monthly P&I
- —
- Monthly cashflow
- —
- DSCR
- —
- Eligible?
- —
Short-term bridge; refi at stabilization.
Rent comps 26 comps
| Address | Beds | Baths | Sqft | Rent | $/sqft | DOM | Units | Dist |
|---|---|---|---|---|---|---|---|---|
| 17314 Cape Horn Blvd Punta Gorda, FL | 3.0 | 2.0 | 2216 | $2,800 | $1.26 | 13d | 1 | 0.58mi |
| 17849 Hibiscus Cove Ct #1 Punta Gorda, FL | 3.0 | 2.0 | 1937 | $6,250 | $3.23 | 23d | 1 | 0.77mi |
| 17434 Oro Ct Punta Gorda, FL | 3.0 | 2.5 | 1864 | $2,000 | $1.07 | 21d | 1 | 0.78mi |
| 3255 Sugarloaf Key Rd Unit 31B Punta Gorda, FL | 2.0 | 2.0 | 1516 | $3,000 | $1.98 | 16d | 1 | 0.91mi |
| 2060 Matecumbe Key Rd Punta Gorda, FL | 2.0–3.0 | 2.0 | 1271 | $5,400 | $4.25 | 23d | 3 | 0.91mi |
| 24417 Baltic Ave #1102 Punta Gorda, FL | 2.0 | 2.0 | 1788 | $5,250 | $2.94 | 23d | 1 | 1.00mi |
| 3020 Matecumbe Key Rd #103 Punta Gorda, FL | 2.0 | 2.0 | 1148 | $5,200 | $4.53 | 23d | 1 | 1.02mi |
| 5050 Marianne Key Rd Unit 1B Punta Gorda, FL | 2.0 | 2.0 | 1347 | $4,500 | $3.34 | 16d | 1 | 1.03mi |
| 4005 Big Pass Ln Punta Gorda, FL | 2.0 | 2.0 | 1423 | $5,500 | $3.87 | 16d | 1 | 1.06mi |
| 3471 Sunset Key Cir #102 Punta Gorda, FL | 3.0 | 2.0 | 1991 | $5,750 | $2.89 | 23d | 1 | 1.06mi |
| 1610 Islamorada Blvd Unit 64A Punta Gorda, FL | 2.0 | 2.0 | 1516 | $2,000 | $1.32 | 23d | 1 | 1.08mi |
| 3313 Sunset Key Cir Punta Gorda, FL | 3.0 | 2.0–3.0 | 2089 | $6,750 | $3.23 | 23d | 4 | 1.13mi |
| 3313 Sunset Key Cir Unit Reservation spot 1 Punta Gorda, FL | 2.0 | 2.0 | 2099 | $2,750 | $1.31 | 23d | 1 | 1.13mi |
| 5 Pirates Ln Unit 54B Punta Gorda, FL | 2.0 | 2.0 | 1516 | $4,600 | $3.03 | 23d | 1 | 1.17mi |
| 1001 Islamorada Blvd Unit 12A Punta Gorda, FL | 2.0 | 2.0 | 1365 | $1,600 | $1.17 | 16d | 1 | 1.20mi |
| 3270 Southshore Dr Unit 72B Punta Gorda, FL | 3.0 | 2.0 | 2069 | $5,750 | $2.78 | 23d | 1 | 1.24mi |
| 1010 Islamorada Blvd Punta Gorda, FL | 3.0 | 2.0 | 1592 | $4,700 | $2.95 | 23d | 1 | 1.25mi |
| 17947 Courtside Landings Cir Punta Gorda, FL | 3.0 | 2.0 | 1338 | $5,500 | $4.11 | 23d | 1 | 1.26mi |
| 3250 Southshore Dr Unit 54B Punta Gorda, FL | 3.0 | 2.0 | 2069 | $5,750 | $2.78 | 23d | 1 | 1.26mi |
| 3280 Southshore Dr Unit 87A Punta Gorda, FL | 3.0 | 2.0 | 2069 | $4,000 | $1.93 | 23d | 1 | 1.28mi |
| 3170 Matecumbe Key Rd #134 Punta Gorda, FL | 2.0 | 2.0 | 1188 | $1,899 | $1.60 | 23d | 1 | 1.30mi |
| 3001 King Tarpon Dr Punta Gorda, FL | 3.0 | 2.0 | 1734 | $5,500 | $3.17 | 23d | 1 | 1.38mi |
| 2091 King Tarpon Dr Punta Gorda, FL | 3.0 | 2.0 | 1640 | $5,200 | $3.17 | 23d | 1 | 1.38mi |
| 3191 Matecumbe Key Rd #206 Punta Gorda, FL | 2.0 | 2.0 | 1102 | $4,400 | $3.99 | 23d | 1 | 1.39mi |
| 3181 Matecumbe Key Rd Punta Gorda, FL | 2.0 | 2.0 | 1254 | $2,450 | $1.95 | 23d | 2 | 1.42mi |
| 16229 Cape Horn Blvd Punta Gorda, FL | 3.0 | 2.0 | 1726 | $2,749 | $1.59 | 21d | 1 | 1.43mi |
HOA detail condo
- Monthly dues
- $673 · $8,076/yr
- Assessments
- None detected in remarks — confirm with the listing agent.
Listing history 16 events
-
2026-06-18days on market $250,000 Active 262 DOM
-
2026-06-17days on market $250,000 Active 261 DOM
-
2026-06-16days on market $250,000 Active 260 DOM
-
2026-06-15days on market $250,000 Active 259 DOM
-
2026-06-14days on market $250,000 Active 257 DOM
-
2026-06-13days on market $250,000 Active 256 DOM
-
2026-06-10days on market $250,000 Active 254 DOM
-
2026-06-09days on market $250,000 Active 253 DOM
-
2026-06-08days on market $250,000 Active 252 DOM
-
2026-06-05days on market $250,000 Active 248 DOM
-
2026-06-02days on market $250,000 Active 246 DOM
-
2026-06-01days on market $250,000 Active 245 DOM
-
2026-05-31days on market $250,000 Active 244 DOM
-
2026-05-30days on market $250,000 Active 243 DOM
-
2025-09-29$250,000 Active
-
2012-01-06soldstatus $2,492,200
ⓘ Source: listings_history table (triggers on properties + properties_extension) + one-shot
backfill from property_details.listing_events for pre-trigger history.
Tax reassessment forecast FL · Resets to sale price
- Current annual tax
- $2,262 · $188/mo
- Projected year-2 tax
- $2,262 · $188/mo
- Expected delta
- $0/yr ($0/mo · 0.0%)
ⓘ Screening estimate from a state-policy table — verify with the county assessor before closing.
Climate risk First Street
- Flood 8/10 Severe FEMA zone AE · 97% chance over 30 yrs
- Wildfire 4/10 Moderate
- Heat 10/10 Extreme 7 d/yr ≥107°F today · 30 d/yr by 30 yrs out
- Wind 10/10 Extreme 99% chance of damaging wind over 30 yrs
- Air quality 3/10 Moderate 2 unhealthy d/yr today · 2 by 30 yrs out
Nearby sold comps map
Loading sold comps map…
Walkable amenities ~0.75 mi
Loading nearby amenities…
Taxation est. · year 1
- Rental income
- $53,720
- − Mortgage interest
- −$14,004
- − Property taxes
- −$2,262
- − Insurance
- −$6,368
- − Repairs & maintenance
- −$4,298
- − Management
- −$4,298
- − HOA
- −$8,076
- − Depreciation
- −$7,273
- Taxable income
- $7,142
- Est. tax owed @ 24.0%
- −$1,714
- After-tax cash flow
- $8,286/yr
For passive investors: Depreciation is non-cash, so a rental often shows a tax loss while cash-flowing — sheltering income. Rental losses are passive: they offset passive income freely, and up to $25,000/yr can offset ordinary (W-2) income if you actively participate and your MAGI is under $100k (phasing out to $0 by $150k); unused losses carry forward. On sale, claimed depreciation is recaptured at up to 25%, and gains may owe capital-gains tax (a 1031 exchange can defer both). Figures are a year-1 estimate at your 24.0% rate — not tax advice; consult a CPA.
Schools (NCES district)
- District
- Charlotte
- NCES district ID
- 1200240
- Math proficiency
- 54% ▼ -6.00%
- Reading proficiency
- 54% ▼ -1.00%
- Median HH income
- $44,864
- Composite
- 45.62/100
- National rank
- #2586
- State rank
- #22 of 73 in FL
Livability — Burnt Store Marina
- Score
- 72/100
- State rank
- #354
- US rank
- #6145
Category grades
Schools grade is shown separately in the Schools card above.
Census & demographics
- County
- Charlotte County · 196,994 people
- Metro
- Punta Gorda, FL
- Population (ZIP)
- 12,399
- Household income
- $76,943
- Rent vs Own
- Severe rent burden
- 226.0
Population outlook (Charlotte County) Hauer SSP2
- Today (2025)
- 198,646 people
- By 2030
- 210,507 · +6.0%
- By 2040
- 230,857 · +16.2%
- By 2050
- 247,148 · +24.4%
- By 2075
- 281,777 · +41.8%
- By 2100
- 293,609 · +47.8%
Race, ethnicity, and origin ACS 2023
- Neighborhood character
- Predominantly White (84%)
- Race & ethnicity
- White 84% Hispanic / Latino 10% Two or more races 9% Black 2%
- Hispanic origin (detail)
- Mexican 4% Puerto Rican 2% Cuban 4%
- Common ancestry
- Romanian 5% Italian 3% Serbian 3%
- Foreign-born
- 8% · Canada
- Languages at home
- 91% English-only · Spanish 5% Other Indo-European 1%
Political lean MEDSL · Charlotte
- 2024 margin
- Solid R (+34.0) · D 32.7% · R 66.7%
- 2008→2024 swing
- -26.7pp toward R · 2008: -7.2pp · 2024: -34.0pp
- All cycles
- 2024: R+34.0 2020: R+26.6 2016: R+27.8 2012: R+14.3 2008: R+7.2
Not yet ingested
- Civics
- —
Market trends
- HPI YoY
- ▼ -78.71%
- Current HPI
- 242.9043
- Rent YoY
- —
- Metro
- Punta Gorda, FL
- State GDP YoY
- ▲ 3.28%
- F500 in state
- 36
Industry mix (Fortune 500 HQ in FL)
| Industry | F500 HQs | Revenue |
|---|---|---|
| Industrial Technology | 2 | $29B |
|
||
| Insurance | 2 | $17B |
|
||
| Retail | 1 | $60B |
|
||
| Technology Distribution | 1 | $58B |
|
||
| Homebuilding | 1 | $35B |
|
||
| Technology Manufacturing | 1 | $35B |
|
||
Price history
-90.0% since first listed2 events — show timeline
- 2025-09-29 Listed $250,000 NAPLESMLS
- 2012-01-06 Sold (Public Records) $2,492,200 Public Records
Property tax history
+1.7%/yrLatest (2025): $2,262 · +3.1% YoY. Source: county tax records.
Cash-flow waterfall
monthlySold comps — $/sqft
last 12 mo · ≤1 miLoading sold comps…