 5-Plex
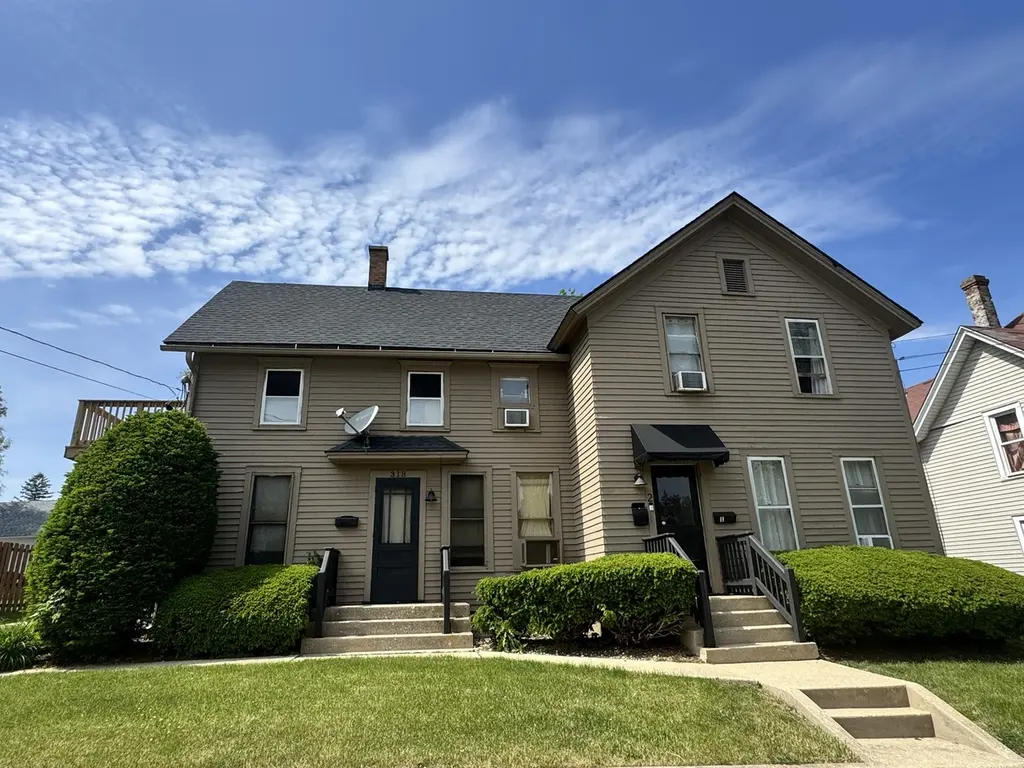
316 Lawrence Ave · Elgin, IL
Flood risk 1/10 · Minimal
- FEMA flood zone
- X (unshaded)
- Chance of flooding over 30 yrs
- 0.0%
- Est. flood insurance / yr
- $473 – $860
Fire risk 1/10 · Minimal
- Est. fire insurance / yr
- $804 – $1,492
Heat risk 3/10 · Minor
- Hot days now (above 102°F)
- 7 days/yr
- Hot days in 30 yrs
- 14 days/yr
Wind risk 2/10 · Minimal
- Chance of severe wind over 30 yrs
- 0.0%
Air-quality risk 2/10 · Minimal
- Unhealthy air days now
- 1 days/yr
- Unhealthy air days in 30 yrs
- 2 days/yr
Risk factors via First Street. Map © Google.
Why this score? — see what drove the B grade
The composite is a weighted blend of 9 inputs, each scored 0–100. Each bar is that input's sub-score; the figure is the points it added to the 100-point composite (weight × sub-score).
- Cash flow +30.0/30.0
- 1% rule +10.0/10.0
- DSCR +10.0/10.0
- ARV discount +7.5/15.0
- Livability +4.2/5.0
- Condition / age +4.0/5.0
- Rent growth +3.4/5.0
- Schools +1.9/10.0
- Appreciation +0.0/10.0
$500,000
🖨 Deal sheet 📄 Offer letter ✓ Due diligence
Multi-family units
County records classify this as Multi-Family (5+ Unit). Listing-text estimate: 5 units. confirmed
5+ unit building — per-unit beds/baths from public records are typically unavailable; the breakdown below (if shown) is an estimate from the listing text.
Listing remarks
We are pleased to offer this 5 unit apartment building. The owners have several long term tenants. The building has a basement and 5 car garage. The roof was new about 2 year ago. Updated railings to apartments 4 & 5 in past few years. #5 was recently remodeled.
Key facts
- 8,712 sq ft lot
- Built 1863
- Listed 21 days
Property features AI
Finance
- Other: Possession available at closing; tenant rights apply
- Financial info: Total of 5 units; Building generates approximately $4,125 monthly ($49,500 annually) in gross income; Units produce rent ranges: several units at $950–$1,050/month and one at $700/month; Gross rent multiplier around 10.1; Reported annual expenses include water/sewer and electric and insurance (details available)
Exterior
- Parking: Outdoor parking spaces (1–5); Indoor parking spaces (1–5)
- Utilities: Separate electric meters; Water/sewer service (expenses reported separately)
- Home design: Multi-family building (5+ units); Individual ownership
- Construction: Frame construction; Composition roof with pitched roof structure
- Exterior features: Frontage on a city street; Lot dimensions approximately 66 x 132 (per county records); Zoned for multi-family
Interior
- Kitchen: Five ranges available (total in building)
- Bedrooms: Unit type A: 1 bedroom; Other unit types include studio/efficiency layouts
- Bathrooms: Multiple full bathrooms across units
- Heating & cooling: Steam heat
- Interior features: Leased units (tenancy by lease); Built before 1978
- Laundry & utility: Electric on separate meters
Neighborhood map
What this means for you Summary
Snapshot
- This is a 5 × 4-bed/5.0-bath units multifamily listed at $500k. Condition is rated good.
Deal economics
- At list price, monthly cash flow is $4k ($48k/yr) — positive. Per door: $794/mo.
- The deal already cash-flows at list — no discount required.
- Meets the 1% rule at list price ($9k rent vs $500k).
- Recommended offer: $492k (1.5% below list) — sets the bar for market timing.
- Cap rate 15.8% vs local median 3.4% in Elgin — top-decile yield for the area; either an underpriced asset or a hidden risk that comps aren't pricing in. Stress-test before assuming the spread holds.
Location & tenants
- Location reads 83/100 on livability (#47 in IL, #975 nationally) — a professional / high-income tenant draw. Strengths: amenities A+, commute A+, housing A+; Watch: health & safety C-, schools D-.
- SD U-46 (suburban): math 19% / reading 20% proficiency, ranked #386 of 620 in IL (top 62%) — low school quality limits family demand, transient renter base, plan for 1-2y turnover.
- Market conditions: Rents rising (+3.7%/yr); 93 active listings in the ZIP; solid renter incomes; 1,944 units permitted in Kane County in 2024 (357 in 5+ unit buildings).
- At $9,402/mo this rent would consume 129% of the median local household income ($88k/yr) (locally 1119% of renters already pay >50% of income on rent) — very limited rent-growth headroom before tenants either downsize or default.
Forward outlook
- Local home prices are declining (-3.0%/yr); year-one equity from $3k of loan paydown is wiped out by about $15k of value loss. Plan a longer hold.
- At projected returns (-3.0% appreciation + 3.7% rent growth), your $140k cash investment doubles in ~4 years — after that, you're playing with house money.
Negotiation context
- It's been on market 21 days — a 2% lower offer ($492k) is reasonable based on typical stale-listing flexibility.
Risks & watch-outs
- Watch-outs: built in 1863 — expect roof / HVAC / electrical / plumbing capex.
Questions for the listing agent
- Can we see the unit-by-unit rent roll, current vacancy, and any below-market leases? What's the average tenancy length?
- What capital expenditures (roof, boiler, parking lot, exteriors) have been made in the last 5 years, and what's planned in the next 2?
- Built in 1863 — when were the roof, HVAC, electrical panel, plumbing, and water heater last replaced?
- Is there a deadline driving the sale (1031 exchange, divorce, estate, relocation)? That informs how much negotiation room exists.
- Schools are D-rated, which usually means shorter tenancies and higher turnover. Who's the typical renter profile here, and what's been the actual vacancy rate?
- What's the average days-on-market for RENTAL listings here right now (not sales)? A rising rental-DOM trend means longer vacancies and softer asking-rent achievability than the comps imply.
- What's the recent tenant-quality profile in this submarket — average credit score on applications, eviction rate, late-payment / NSF rate, and stable-employment percentage? A property-management company in the area should have these aggregated.
- How much new apartment / multifamily construction is in the pipeline within 1–3 miles? Heavy new supply (>2% of stock underway) typically softens rents 12–24 months out; light construction supports rent growth.
Investment metrics
- 1% rule
- 1.88% ✓
- Cap rate
- 15.83%
- Cash-on-cash
- 34.05%
- DSCR
- 2.51
- GRM
- 4.4
CMA / ARV
No comps found within radius.
Projected returns pro-forma
-3.0% appreciation · 3.69% rent growth · sell at horizon
- IRR
- 30.2%
- Equity multiple
- 2.28×
- Total profit
- $178,683
- Equity at exit
- $74,552
- IRR
- 37.9%
- Equity multiple
- 4.64×
- Total profit
- $509,286
- Equity at exit
- $43,231
Cash invested: $140,000 (down + closing). Projections, not guarantees.
Landlord ↔ Tenant lean methodology
- Overall (STATE)
- 43 Moderately Tenant-Leaning
- State Illinois
- 43 Moderately Tenant-Leaning · D+7
- County
- — inherits STATE
- City
- — inherits STATE
ZIP-level market 60123
- Rents YoY
- 3.7%
- Active inventory
- 93
- Price-to-rent
- 22.2×
Monthly cashflow live
- Estimated rent
- $9,402 medium interval (Pro) →
- Mortgage (P&I)
- −$2,622
- Tax est. 1.5%
- −$625 /mo · $7,500/yr
- Insurance
- −$208
- HOA
- −$0
- Vacancy / Maint / Mgmt
- −$1,974
- Net cashflow
- $3,972
Break-even live
5-unit breakdown (identical units grouped — click to expand)
| Units | Beds | Baths | Est. rent |
|---|---|---|---|
| 5× units | 4 | 5 | $9,400 |
| #1 | 4 | 5 | $1,880 |
| #2 | 4 | 5 | $1,880 |
| #3 | 4 | 5 | $1,880 |
| #4 | 4 | 5 | $1,880 |
| #5 | 4 | 5 | $1,880 |
| Total (5 units) | $9,402 | ||
UW: 25.0% down · 7.5% · 30yr · 1.5% tax · 5.0% vac · 8.0% maint · 8.0% mgmt
Financing live
Cash to close
- Down payment
- $125,000
- Closing costs
- $15,000
- Reserves months
- —
- Total cash needed
- —
Loan-product check · same deal, 3 products live
Conventional
25% down · 7.5% · 30yr
- Down + closing
- —
- Monthly P&I
- —
- Monthly cashflow
- —
- DSCR
- —
- Eligible?
- —
Personal DTI + credit; lowest rate.
DSCR
20% down · 8.5% · 30yr
- Down + closing
- —
- Monthly P&I
- —
- Monthly cashflow
- —
- DSCR
- —
- Eligible?
- —
No personal income docs; deal must DSCR.
Hard money
10% down · 12.0% · 12mo
- Down + closing
- —
- Monthly P&I
- —
- Monthly cashflow
- —
- DSCR
- —
- Eligible?
- —
Short-term bridge; refi at stabilization.
Listing history 14 events
-
2026-06-18days on market $500,000 Active 21 DOM
-
2026-06-17days on market $500,000 Active 20 DOM
-
2026-06-16days on market $500,000 Active 19 DOM
-
2026-06-15days on market $500,000 Active 18 DOM
-
2026-06-13days on market $500,000 Active 16 DOM
-
2026-06-09days on market $500,000 Active 12 DOM
-
2026-06-08days on market $500,000 Active 11 DOM
-
2026-06-07days on market $500,000 Active 10 DOM
-
2026-06-04days on market $500,000 Active 7 DOM
-
2026-06-03days on market $500,000 Active 6 DOM
-
2026-06-02days on market $500,000 Active 5 DOM
-
2026-06-01days on market $500,000 Active 4 DOM
-
2026-05-31days on market $500,000 Active 3 DOM
-
2026-05-28$500,000 Active
ⓘ Source: listings_history table (triggers on properties + properties_extension) + one-shot
backfill from property_details.listing_events for pre-trigger history.
Climate risk First Street
- Flood 1/10 Low FEMA zone X (unshaded) · 0% chance over 30 yrs
- Wildfire 1/10 Low
- Heat 3/10 Moderate 7 d/yr ≥102°F today · 14 d/yr by 30 yrs out
- Wind 2/10 Low 0% chance of damaging wind over 30 yrs
- Air quality 2/10 Low 1 unhealthy d/yr today · 2 by 30 yrs out
Nearby sold comps map
Loading sold comps map…
Walkable amenities ~0.75 mi
Loading nearby amenities…
Taxation est. · year 1
- Rental income
- $112,824
- − Mortgage interest
- −$28,008
- − Property taxes
- −$7,500
- − Insurance
- −$2,500
- − Repairs & maintenance
- −$9,026
- − Management
- −$9,026
- − Depreciation
- −$14,545
- Taxable income
- $42,219
- Est. tax owed @ 24.0%
- −$10,133
- After-tax cash flow
- $37,534/yr
For passive investors: Depreciation is non-cash, so a rental often shows a tax loss while cash-flowing — sheltering income. Rental losses are passive: they offset passive income freely, and up to $25,000/yr can offset ordinary (W-2) income if you actively participate and your MAGI is under $100k (phasing out to $0 by $150k); unused losses carry forward. On sale, claimed depreciation is recaptured at up to 25%, and gains may owe capital-gains tax (a 1031 exchange can defer both). Figures are a year-1 estimate at your 24.0% rate — not tax advice; consult a CPA.
Condition & rehab AI · 9 photos
This 5-unit apartment building is in good condition with a new roof and well-maintained exterior. Minor updates to the exterior and interior, along with energy-efficient upgrades, would significantly enhance its value.
Value-add opportunities
- Both Paint exterior and interior — Fresh paint enhances curb appeal and interior aesthetics
- Both Replace carpet with hardwood or tile — Hardwood or tile flooring is more durable and adds value
- Both Install energy-efficient windows — New windows improve energy efficiency and reduce utility costs
- Both Upgrade HVAC system — A new HVAC system improves comfort and energy efficiency
Renovation cost estimate screening
Value-add ROI direction
- Both Paint exterior and interior — Fresh paint enhances curb appeal and interior aesthetics ↑
- Both Replace carpet with hardwood or tile — Hardwood or tile flooring is more durable and adds value ↑
- Both Install energy-efficient windows — New windows improve energy efficiency and reduce utility costs ↑
- Both Upgrade HVAC system — A new HVAC system improves comfort and energy efficiency ↑
ⓘ Cost ranges are severity-bucket heuristics (US national rule-of-thumb). Get contractor quotes + a written scope before underwriting a rehab budget.
Schools (NCES district)
- District
- SD U-46
- NCES district ID
- 1713710
- Math proficiency
- 19% ▼ -7.00%
- Reading proficiency
- 20% ▼ -7.00%
- Median HH income
- $69,757
- Composite
- 19.39/100
- National rank
- #8783
- State rank
- #386 of 620 in IL
Livability — Elgin
- Score
- 83/100
- State rank
- #47
- US rank
- #975
Category grades
Schools grade is shown separately in the Schools card above.
Census & demographics
- Census place
- Elgin, IL
- County
- Kane County · 361,735 people
- City population
- 124,091
- Metro
- Chicago-Naperville-Elgin, IL-IN-WI
- Population (ZIP)
- 48,379
- Household income
- $87,693
- Rent vs Own
- Severe rent burden
- 1119.0
Population outlook (Kane County) Hauer SSP2
- Today (2025)
- 559,449 people
- By 2030
- 568,757 · +1.7%
- By 2040
- 575,969 · +3.0%
- By 2050
- 563,477 · +0.7%
- By 2075
- 492,321 · -12.0%
- By 2100
- 380,943 · -31.9%
Race, ethnicity, and origin ACS 2023
- Neighborhood character
- Diverse neighborhood (Simpson 0.63)
- Race & ethnicity
- Hispanic / Latino 47% White 38% Two or more races 17% Black 6% Asian 5% Native American 1%
- Hispanic origin (detail)
- Mexican 38% Puerto Rican 4%
- Common ancestry
- Romanian 5% Italian 2% Slovak 1%
- Foreign-born
- 23% · Canada, Jamaica
- Languages at home
- 57% English-only · Spanish 38% Other Asian/Pacific 1% Other Indo-European 1%
Political lean MEDSL · Kane
- 2024 margin
- Lean D (+9.4) · D 54.0% · R 44.6% · Other 1.4%
- 2008→2024 swing
- -2.4pp toward R · 2008: 11.8pp · 2024: 9.4pp
- All cycles
- 2024: D+9.4 2020: D+14.4 2016: D+8.9 2012: D+0.9 2008: D+11.8
Not yet ingested
- Civics
- —
Market trends
- HPI YoY
- ▼ -140.80%
- Current HPI
- 226.0713
- Rent YoY
- ▲ 3.69%
- Metro
- Chicago-Naperville-Elgin, IL-IN-WI
- State GDP YoY
- ▲ 1.59%
- F500 in state
- 60
Industry mix (Fortune 500 HQ in IL)
| Industry | F500 HQs | Revenue |
|---|---|---|
| Insurance | 4 | $201B |
|
||
| Consumer Goods | 4 | $87B |
|
||
| Industrial Machinery | 3 | $64B |
|
||
| Healthcare | 2 | $55B |
|
||
| Retail / Pharmacy | 1 | $148B |
|
||
| Agriculture / Food | 1 | $86B |
|
||
Price history
1 event — show timeline
- 2026-05-28 Listed $500,000 MRED as Distributed by MLS Grid
Cash-flow waterfall
monthlySold comps — $/sqft
last 12 mo · ≤1 miLoading sold comps…