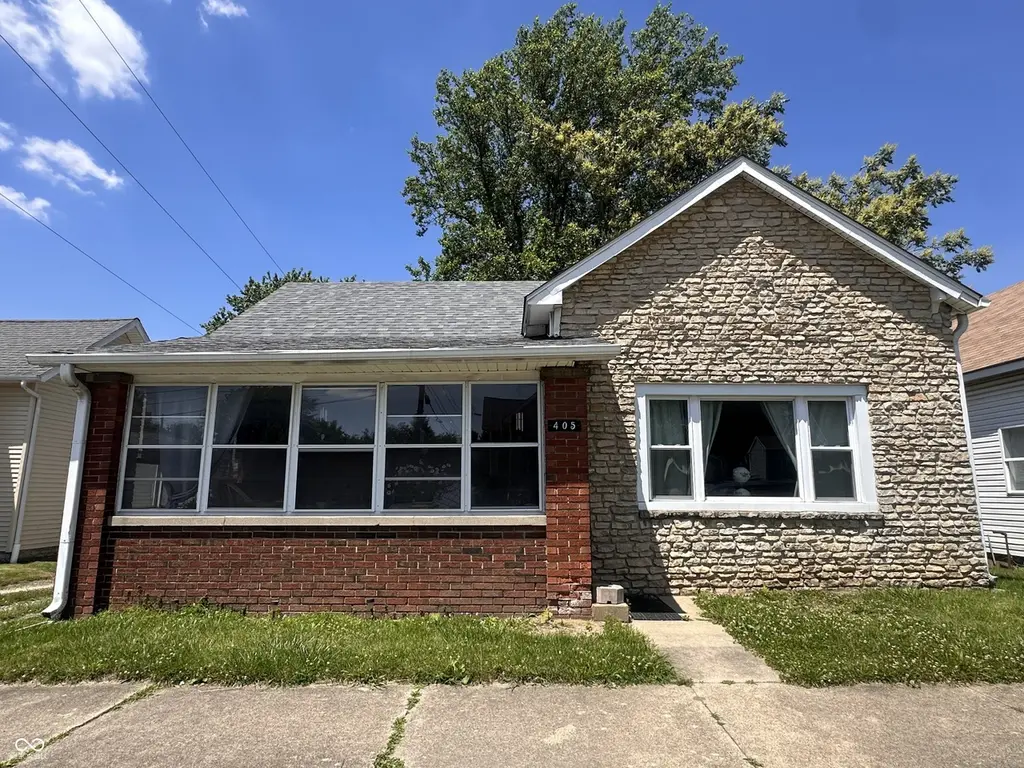
405 N Ireland St · Greensburg, IN
Flood risk 1/10 · Minimal
- FEMA flood zone
- X (unshaded)
- Chance of flooding over 30 yrs
- 0.0%
- Est. flood insurance / yr
- $507 – $1,088
Fire risk 1/10 · Minimal
- Est. fire insurance / yr
- $717 – $1,331
Heat risk 4/10 · Minor
- Hot days now (above 102°F)
- 7 days/yr
- Hot days in 30 yrs
- 19 days/yr
Wind risk 2/10 · Minimal
- Chance of severe wind over 30 yrs
- 1.0%
Air-quality risk 2/10 · Minimal
- Unhealthy air days now
- 1 days/yr
- Unhealthy air days in 30 yrs
- 2 days/yr
Risk factors via First Street. Map © Google.
Why this score? — see what drove the B+ grade
The composite is a weighted blend of 9 inputs, each scored 0–100. Each bar is that input's sub-score; the figure is the points it added to the 100-point composite (weight × sub-score).
- Cash flow +30.0/30.0
- ARV discount +13.4/15.0
- 1% rule +10.0/10.0
- DSCR +10.0/10.0
- Schools +3.8/10.0
- Livability +3.5/5.0
- Rent growth +2.5/5.0
- Condition / age +2.5/5.0
- Appreciation +0.0/10.0
$199,000
🖨 Deal sheet 📄 Offer letter ✓ Due diligence
Listing remarks
Original charm, prime location, unlimited potential! Located on Ireland Street in the heart of Greensburg, this 1,700 sf+ home is packed with character and is waiting for someone with a vision. From vintage details to spacious living areas, this property offers the chance to create something truly special while enjoying a location that puts all of Greensburg within easy reach. Bring your ideas and see the possibilities within this 3 bed, 1 bath home!
Key facts
- Vintage details
- Prime location
- 6,400 sq ft lot
Tags
Property features AI
Exterior
- Parking: On-street parking
- Utilities: Public water; Municipal sewer connected; Solid waste service available
- Home design: Single-family residence; One story
- Construction: Vinyl with brick and stone exterior; Cellar, crawl space, and rock foundation
- Exterior features: Deck; Glass-enclosed porch; Full chain-link fence; Less than 1/4 acre lot
Interior
- Kitchen: Electric oven; Range hood; Dishwasher; Refrigerator
- Bedrooms: Three bedrooms on the main level
- Bathrooms: One full bathroom (main level)
- Heating & cooling: Forced air heating; Natural gas heating; Wall furnace; Central air; Window air unit(s)
- Interior features: Accessible full bathroom; Range hood; Water heater
- Laundry & utility: Washer; Dryer
Neighborhood map
What this means for you Summary
Snapshot
- This is a 3-bed/1.0-bath single-family listed at $199k.
Deal economics
- At list price, monthly cash flow is $1k ($16k/yr) — positive.
- The deal already cash-flows at list — no discount required.
- Meets the 1% rule at list price ($3k rent vs $199k).
- Cap rate 14.3% vs local median 5.9% in Greensburg — top-decile yield for the area; either an underpriced asset or a hidden risk that comps aren't pricing in. Stress-test before assuming the spread holds.
Location & tenants
- Location reads 69/100 on livability (#200 in IN) — a middle-class / working-renter tenant base. Strengths: cost of living A+, housing A+, crime B+; Watch: employment C-, schools D+, amenities F.
- Greensburg Community Schools (town): math 38% / reading 51% proficiency, ranked #102 of 301 in IN (top 34%) — families likely to look elsewhere, expect single-tenant / working-renter base with shorter leases.
- Market conditions: 155 active listings in the ZIP; 3 comparable units currently listed for rent nearby; rentals at typical pace (median 24d on market — plan ~3-4 weeks tenant-placement turnaround); 66 units permitted in Decatur County in 2024 (0 in 5+ unit buildings).
Forward outlook
- Local home prices are declining (-3.0%/yr); year-one equity from $1k of loan paydown is wiped out by about $6k of value loss. Plan a longer hold.
- Decatur County population projected at +6% by 2050 — modest demand growth; plan on rents tracking national, not racing it.
- At projected returns (-3.0% appreciation + 3.0% rent growth), your $56k cash investment doubles in ~5 years — after that, you're playing with house money.
Negotiation context
- Only 13 days on market — expect competitive offers; lowballing is unlikely to land.
Risks & watch-outs
- Watch-outs: built in 1900 — expect roof / HVAC / electrical / plumbing capex.
Questions for the listing agent
- Built in 1900 — when were the roof, HVAC, electrical panel, plumbing, and water heater last replaced?
- Is there a deadline driving the sale (1031 exchange, divorce, estate, relocation)? That informs how much negotiation room exists.
- Schools are D-rated, which usually means shorter tenancies and higher turnover. Who's the typical renter profile here, and what's been the actual vacancy rate?
- What's the average days-on-market for RENTAL listings here right now (not sales)? A rising rental-DOM trend means longer vacancies and softer asking-rent achievability than the comps imply.
- What's the recent tenant-quality profile in this submarket — average credit score on applications, eviction rate, late-payment / NSF rate, and stable-employment percentage? A property-management company in the area should have these aggregated.
- How much new for-sale + rental construction is in the pipeline within 1–3 miles? Heavy new supply typically softens prices + rents 12–24 months out; constrained supply supports both.
Investment metrics
- 1% rule
- 1.60% ✓
- Cap rate
- 14.29%
- Cash-on-cash
- 28.56%
- DSCR
- 2.27
- GRM
- 5.2
CMA / ARV
- ARV (on-the-fly)
- $229,152
- Comps found
- 12
Show comp detail 12 sales within ~0.75 mi
| Address | Dist | Beds/Ba | Sqft | Sold | Price | $/sf | Match |
|---|---|---|---|---|---|---|---|
| 315 W Walnut St | 0.17mi | 3/2.0 | 1,659 (-4%) | 10mo | $145,000 | $87 | 72 |
| 621 W Washington St | 0.26mi | 4/2.0 (+1) | 1,764 (+2%) | 9mo | $284,900 | $162 | 69 |
| 311 E Central Ave | 0.44mi | 3/2.0 | 1,808 (+4%) | 1mo | $185,000 | $102 | 68 |
| 628 W Walnut St | 0.24mi | 3/2.5 | 1,790 (+3%) | 12mo | $285,000 | $159 | 67 |
| 513 W North St | 0.14mi | 3/2.0 | 1,500 (-14%) | 7mo | $230,000 | $153 | 61 |
| 327 W Bryant St | 0.67mi | 3/1.0 | 1,709 (-2%) | 7mo | $200,000 | $117 | 60 |
| 304 W Shortridge Dr | 0.09mi | 3/1.0 | 1,475 (-15%) | 13mo | $195,000 | $132 | 60 |
| 401 W Walnut St | 0.16mi | 2/1.0 (-1) | 1,962 (+13%) | 12mo | $160,000 | $82 | 56 |
| 125 S Vine St | 0.74mi | 4/1.0 (+1) | 1,804 (+4%) | 3mo | $31,000 | $17 | 52 |
| 323 E Walnut St | 0.48mi | 2/1.0 (-1) | 1,991 (+15%) | 4mo | $185,000 | $93 | 45 |
| 420 N East St | 0.43mi | 3/2.0 | 1,477 (-15%) | 10mo | $212,000 | $144 | 43 |
| 210 W 5th St | 0.59mi | 4/2.0 (+1) | 1,492 (-14%) | 2mo | $228,000 | $153 | 38 |
Match score weights: distance 35% · size 25% · config 20% · recency 20%. Top-matched comps best support the ARV.
Projected returns pro-forma
-3.0% appreciation · 3.0% rent growth · sell at horizon
- IRR
- 22.8%
- Equity multiple
- 1.94×
- Total profit
- $52,156
- Equity at exit
- $29,672
- IRR
- 30.8%
- Equity multiple
- 3.76×
- Total profit
- $153,921
- Equity at exit
- $17,206
Cash invested: $55,720 (down + closing). Projections, not guarantees.
Landlord ↔ Tenant lean methodology
- Overall (STATE)
- 90 Strongly Landlord-Friendly
- State Indiana
- 90 Strongly Landlord-Friendly · R+11
- County
- — inherits STATE
- City
- — inherits STATE
ZIP-level market 47240
- Home prices YoY
- -25.0%
- Active inventory
- 155
- Price-to-rent
- 5.2×
Monthly cashflow live
- Estimated rent
- $3,189 medium interval (Pro) →
- Mortgage (P&I)
- −$1,044
- Tax from tax record
- −$67 /mo · $801/yr
- Insurance
- −$83
- HOA
- −$0
- Vacancy / Maint / Mgmt
- −$670
- Net cashflow
- $1,326
Break-even live
UW: 25.0% down · 7.5% · 30yr · 1.5% tax · 5.0% vac · 8.0% maint · 8.0% mgmt
Financing live
Cash to close
- Down payment
- $49,750
- Closing costs
- $5,970
- Reserves months
- —
- Total cash needed
- —
Loan-product check · same deal, 3 products live
Conventional
25% down · 7.5% · 30yr
- Down + closing
- —
- Monthly P&I
- —
- Monthly cashflow
- —
- DSCR
- —
- Eligible?
- —
Personal DTI + credit; lowest rate.
DSCR
20% down · 8.5% · 30yr
- Down + closing
- —
- Monthly P&I
- —
- Monthly cashflow
- —
- DSCR
- —
- Eligible?
- —
No personal income docs; deal must DSCR.
Hard money
10% down · 12.0% · 12mo
- Down + closing
- —
- Monthly P&I
- —
- Monthly cashflow
- —
- DSCR
- —
- Eligible?
- —
Short-term bridge; refi at stabilization.
Rent comps 3 comps
| Address | Beds | Baths | Sqft | Rent | $/sqft | DOM | Units | Dist |
|---|---|---|---|---|---|---|---|---|
| 1011 N Anderson St Greensburg, IN | 3.0 | 2.5 | 1620 | $3,995 | $2.47 | 12d | 1 | 0.45mi |
| 2303 N Broadway St Greensburg, IN | 2.0 | 2.0 | 1100 | $1,399 | $1.27 | 24d | 1 | 1.35mi |
| 1651 W Kole Dr Unit A Greensburg, IN | 3.0 | 2.0 | 1075 | $1,350 | $1.26 | 24d | 1 | 1.40mi |
Listing history 10 events
-
2026-06-18days on market $199,000 Active 13 DOM
-
2026-06-17days on market $199,000 Active 12 DOM
-
2026-06-16days on market $199,000 Active 11 DOM
-
2026-06-15days on market $199,000 Active 10 DOM
-
2026-06-13days on market $199,000 Active 8 DOM
-
2026-06-12days on market $199,000 Active 7 DOM
-
2026-06-09days on market $199,000 Active 4 DOM
-
2026-06-08days on market $199,000 Active 3 DOM
-
2026-06-07remarks 454-char remark
-
2026-06-07$199,000 Active 2 DOM
ⓘ Source: listings_history table (triggers on properties + properties_extension) + one-shot
backfill from property_details.listing_events for pre-trigger history.
Tax reassessment forecast IN · Partial reset (capped growth)
- Current annual tax
- $801 · $67/mo
- Projected year-2 tax
- $1,246 · $104/mo
- Expected delta
- +$445/yr (+$37/mo · 55.6%)
ⓘ Screening estimate from a state-policy table — verify with the county assessor before closing.
Climate risk First Street
- Flood 1/10 Low FEMA zone X (unshaded) · 0% chance over 30 yrs
- Wildfire 1/10 Low
- Heat 4/10 Moderate 7 d/yr ≥102°F today · 19 d/yr by 30 yrs out
- Wind 2/10 Low 100% chance of damaging wind over 30 yrs
- Air quality 2/10 Low 1 unhealthy d/yr today · 2 by 30 yrs out
Nearby sold comps map
Loading sold comps map…
Walkable amenities ~0.75 mi
Loading nearby amenities…
Taxation est. · year 1
- Rental income
- $38,269
- − Mortgage interest
- −$11,147
- − Property taxes
- −$801
- − Insurance
- −$995
- − Repairs & maintenance
- −$3,062
- − Management
- −$3,062
- − Depreciation
- −$5,789
- Taxable income
- $13,415
- Est. tax owed @ 24.0%
- −$3,220
- After-tax cash flow
- $12,695/yr
For passive investors: Depreciation is non-cash, so a rental often shows a tax loss while cash-flowing — sheltering income. Rental losses are passive: they offset passive income freely, and up to $25,000/yr can offset ordinary (W-2) income if you actively participate and your MAGI is under $100k (phasing out to $0 by $150k); unused losses carry forward. On sale, claimed depreciation is recaptured at up to 25%, and gains may owe capital-gains tax (a 1031 exchange can defer both). Figures are a year-1 estimate at your 24.0% rate — not tax advice; consult a CPA.
Schools (NCES district)
- District
- Greensburg Community Schools
- NCES district ID
- 1804080
- Math proficiency
- 38% ▼ -7.00%
- Reading proficiency
- 51% ▼ -2.00%
- Median HH income
- $47,723
- Composite
- 37.96/100
- National rank
- #4301
- State rank
- #102 of 301 in IN
Livability — Greensburg
- Score
- 69/100
- State rank
- #200
- US rank
- #8922
Category grades
Schools grade is shown separately in the Schools card above.
Census & demographics
- Census place
- Greensburg, IN
- Population (ZIP)
- 21,514
Population outlook (Decatur County) Hauer SSP2
- Today (2025)
- 27,709 people
- By 2030
- 28,278 · +2.1%
- By 2040
- 29,195 · +5.4%
- By 2050
- 29,512 · +6.5%
- By 2075
- 29,835 · +7.7%
- By 2100
- 27,192 · -1.9%
Race, ethnicity, and origin ACS 2023
- Neighborhood character
- Predominantly White (93%)
- Race & ethnicity
- White 93% Two or more races 5% Hispanic / Latino 3%
- Common ancestry
- Slovak 2% Serbian 1% Romanian 1%
- Foreign-born
- 1% · Canada
- Languages at home
- 98% English-only · Spanish 2%
Political lean MEDSL · Decatur
- 2024 margin
- Solid R (+58.5) · D 19.9% · R 78.4% · Other 1.8%
- 2008→2024 swing
- -34.1pp toward R · 2008: -24.4pp · 2024: -58.5pp
- All cycles
- 2024: R+58.5 2020: R+58.1 2016: R+57.4 2012: R+40.5 2008: R+24.4
Not yet ingested
- Civics
- —
Market trends
- HPI YoY
- ▼ -70.13%
- Current HPI
- 210.3591
- Rent YoY
- —
- Metro
- —
- State GDP YoY
- ▲ 2.90%
- F500 in state
- 18
Industry mix (Fortune 500 HQ in IN)
| Industry | F500 HQs | Revenue |
|---|---|---|
| Industrial Machinery | 2 | $37B |
|
||
| Healthcare | 1 | $177B |
|
||
| Pharmaceuticals | 1 | $45B |
|
||
| Metals / Steel | 1 | $18B |
|
||
| Agriculture | 1 | $17B |
|
||
| Packaging | 1 | $12B |
|
||
Price history
1 event — show timeline
- 2026-06-05 Listed $199,000 MIBOR as Distributed by MLS Grid
Property tax history
+13.4%/yrLatest (2023): $801 · +81.9% YoY. Source: county tax records.
Cash-flow waterfall
monthlySold comps — $/sqft
last 12 mo · ≤1 miLoading sold comps…