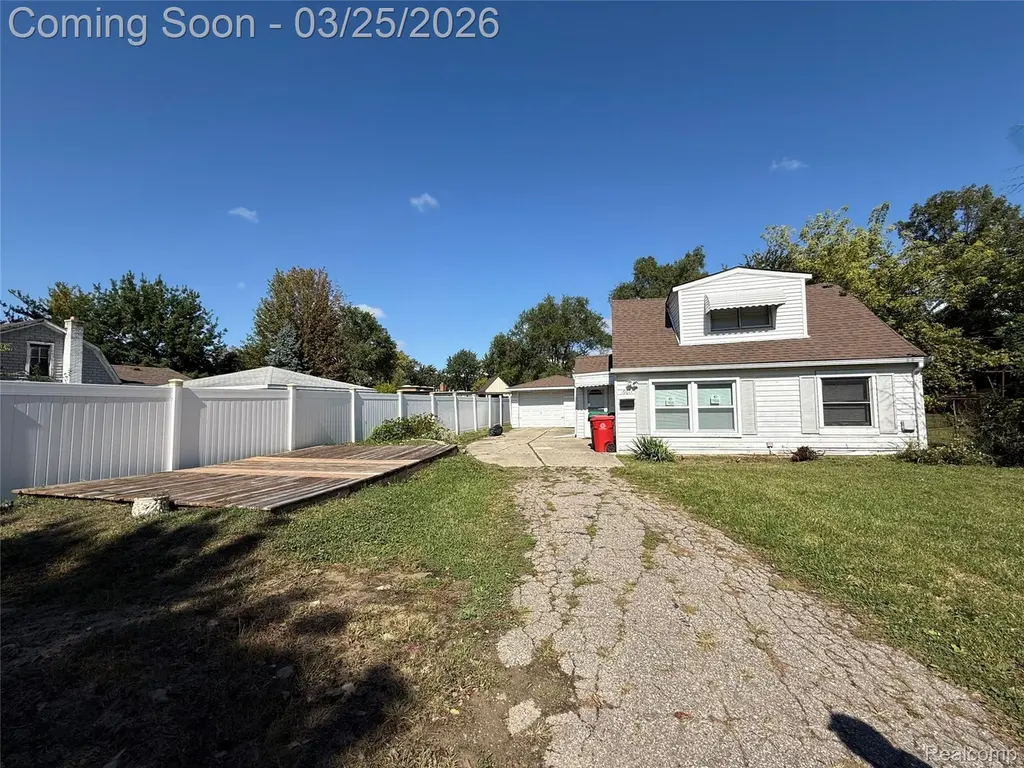
19071 Toepfer Dr · Eastpointe, MI
Flood risk 5/10 · Moderate
- FEMA flood zone
- X (unshaded)
- Chance of flooding over 30 yrs
- 0.51%
- Est. flood insurance / yr
- $473 – $860
Fire risk 1/10 · Minimal
- Est. fire insurance / yr
- $784 – $1,456
Heat risk 3/10 · Minor
- Hot days now (above 96°F)
- 7 days/yr
- Hot days in 30 yrs
- 15 days/yr
Wind risk 1/10 · Minimal
- Chance of severe wind over 30 yrs
- —
Air-quality risk 4/10 · Minor
- Unhealthy air days now
- 4 days/yr
- Unhealthy air days in 30 yrs
- 5 days/yr
Risk factors via First Street. Map © Google.
Why this score? — see what drove the C+ grade
The composite is a weighted blend of 9 inputs, each scored 0–100. Each bar is that input's sub-score; the figure is the points it added to the 100-point composite (weight × sub-score).
- Cash flow +26.1/30.0
- 1% rule +10.0/10.0
- DSCR +8.8/10.0
- ARV discount +7.5/15.0
- Livability +3.7/5.0
- Rent growth +3.4/5.0
- Condition / age +2.5/5.0
- Schools +1.7/10.0
- Appreciation +0.0/10.0
$99,900
🖨 Deal sheet (PDF) 📄 Offer letter ✓ Due diligence
Listing remarks MLS
2-bedroom, 1-bath home with an updated kitchen, modern bathroom, and convenient first-floor laundry. The kitchen has been updated with new stainless steel appliances. The main floor includes a flexible second bedroom, while the spacious primary suite upstairs offers multiple walk-in closets. Enjoy a huge backyard perfect for entertaining or relaxing. Detached garage and generously sized driveway and front yard with deck space. Great location near shopping, dining, and more! Motivated seller. Tenants currently occupying. Ledger available upon request. Buyer and/or Buyer's agent to verify all information.
Key facts
- 0.23 acre lot
- Garage
- Built 1937
Neighborhood map
What this means for you Summary
Snapshot
- This is a 2-bed/1.0-bath single-family listed at $100k.
Deal economics
- At list price, monthly cash flow is $251 ($3k/yr) — positive.
- The deal already cash-flows at list — no discount required.
- Meets the 1% rule at list price ($2k rent vs $100k).
- Recommended offer: $94k (6.0% below list) — sets the bar for market timing.
Location & tenants
- Location reads 73/100 on livability (#213 in MI) — a middle-class / working-renter tenant base. Strengths: commute A+, cost of living A+, housing A+; Watch: health & safety D+, amenities D, employment D.
- South Lake Schools (suburban): math 11% / reading 26% proficiency, ranked #470 of 540 in MI (top 87%) — low school quality limits family demand, transient renter base, plan for 1-2y turnover.
- Zoned schools: Avalon Elementary School (313 students, 62% FRL); South Lake Middle School (math 7% / reading 23%, grade F, #451 of 493 statewide, top 92%, 299 students, 66% FRL); South Lake High School (math 2% / reading 27%, grade F, #640 of 713 statewide, top 91%, 516 students, 61% FRL).
- Market conditions: Rents rising (+3.5%/yr); 9 active listings in the ZIP; 19 comparable units currently listed for rent nearby; rentals leasing fast (median 13d on market — plan ~1-2 weeks tenant-placement turnaround); 1,321 units permitted in Macomb County in 2024 (86 in 5+ unit buildings).
Forward outlook
- Local home prices are declining (-3.0%/yr); year-one equity from $691 of loan paydown is wiped out by about $3k of value loss. Plan a longer hold.
- Macomb County population projected at +9% by 2050 — modest demand growth; plan on rents tracking national, not racing it.
- At projected returns (-3.0% appreciation + 3.5% rent growth), your $28k cash investment doubles in ~10 years — after that, you're playing with house money.
Negotiation context
- It's been on market 69 days — a 6% lower offer ($94k) is reasonable based on typical stale-listing flexibility.
- 25 sale attempts since 21y ago with the ask held roughly flat each time — persistent listings suggest the price (not the market) is what's stuck; bring a comps-based counter.
Risks & watch-outs
- Watch-outs: property tax is 4.5% of price; built in 1937 — expect roof / HVAC / electrical / plumbing capex.
- Climate carrying-cost: moderate flood risk — expect insurance premiums to compound above CPI over the hold.
Questions for the listing agent
- It's been on market 69 days. Have you received any prior offers? Is the seller open to a 6% concession, seller financing, or rate buy-down credit?
- Built in 1937 — when were the roof, HVAC, electrical panel, plumbing, and water heater last replaced?
- Property tax is high relative to price — has the assessment been appealed recently, and will the sale trigger a re-assessment?
- Why hasn't it sold? Are there any deal-killer items the seller is aware of (foundation, flood, title, zoning, code violations)?
- Is there a deadline driving the sale (1031 exchange, divorce, estate, relocation)? That informs how much negotiation room exists.
- Schools are F-rated, which usually means shorter tenancies and higher turnover. Who's the typical renter profile here, and what's been the actual vacancy rate?
- Crime grade is F in this area — have there been break-ins, vandalism, or insurance claims at this property in the last 3 years? What carrier currently insures it and at what premium?
- What's the average days-on-market for RENTAL listings here right now (not sales)? A rising rental-DOM trend means longer vacancies and softer asking-rent achievability than the comps imply.
- What's the recent tenant-quality profile in this submarket — average credit score on applications, eviction rate, late-payment / NSF rate, and stable-employment percentage? A property-management company in the area should have these aggregated.
- How much new for-sale + rental construction is in the pipeline within 1–3 miles? Heavy new supply typically softens prices + rents 12–24 months out; constrained supply supports both.
Investment metrics
- 1% rule
- 1.51% ✓
- Cap rate
- 9.31%
- Cash-on-cash
- 10.76%
- DSCR
- 1.48
- GRM
- 5.5
CMA / ARV
- ARV (median comp)
- $201,554
- List price
- $99,900
- Delta
- -50.44%
- Verdict
- UNDERPRICED
- Comps
- 20 within 1.0 mi
Show comp detail 12 sales within ~0.75 mi
| Address | Dist | Beds/Ba | Sqft | Sold | Price | $/sf | Match |
|---|---|---|---|---|---|---|---|
| 19045 Morningside Ave | 0.28mi | 3/1.0 (+1) | 1,038 (-3%) | 12mo | $200,000 | $193 | 67 |
| 18570 Morningside Ave | 0.26mi | 3/1.0 (+1) | 1,102 (+3%) | 16mo | $175,000 | $159 | 65 |
| 19800 Edmunton St | 0.35mi | 2/2.0 | 1,127 (+5%) | 11mo | $218,500 | $194 | 62 |
| 19820 Avalon St | 0.49mi | 3/1.0 (+1) | 1,013 (-5%) | 2mo | $219,000 | $216 | 62 |
| 19921 Alger St | 0.63mi | 3/1.0 (+1) | 1,061 (-1%) | 3mo | $230,000 | $217 | 62 |
| 22400 Kelly Rd | 0.51mi | 3/2.0 (+1) | 1,100 (+3%) | 3mo | $228,000 | $207 | 60 |
| 18020 Juliana Ave | 0.45mi | 2/1.0 | 1,136 (+6%) | 14mo | $145,000 | $128 | 57 |
| 19841 Avalon St | 0.53mi | 3/1.5 (+1) | 1,061 (-1%) | 16mo | $215,000 | $203 | 54 |
| 20350 E 8 Mile Rd | 0.61mi | 3/1.0 (+1) | 1,038 (-3%) | 13mo | $105,000 | $101 | 51 |
| 22620 Raven Ave | 0.68mi | 3/1.0 (+1) | 962 (-10%) | 0mo | $190,000 | $198 | 46 |
| 20223 Avalon St | 0.68mi | 3/1.0 (+1) | 931 (-13%) | 7mo | $150,000 | $161 | 36 |
| 22389 Beaconsfield Ave | 0.65mi | 3/2.0 (+1) | 987 (-8%) | 15mo | $145,000 | $147 | 35 |
Match score weights: distance 35% · size 25% · config 20% · recency 20%. Top-matched comps best support the ARV.
Projected returns pro-forma
-3.0% appreciation · 3.47% rent growth · sell at horizon
- IRR
- 0.6%
- Equity multiple
- 1.02×
- Total profit
- $679
- Equity at exit
- $14,895
- IRR
- 11.0%
- Equity multiple
- 1.89×
- Total profit
- $24,855
- Equity at exit
- $8,638
Cash invested: $27,972 (down + closing). Projections, not guarantees.
Landlord ↔ Tenant lean methodology
- Overall (STATE)
- 62 Landlord-Friendly
- State Michigan
- 62 Landlord-Friendly · EVEN
- County
- — inherits STATE
- City
- — inherits STATE
ZIP-level market 48021
- Rents YoY
- 3.5%
- Active inventory
- 9
- Price-to-rent
- 5.5×
Monthly cashflow live
- Estimated rent
- $1,511 high interval (Pro) →
- Mortgage (P&I)
- −$524
- Tax from tax record
- −$378 /mo · $4,533/yr
- Insurance
- −$42
- HOA
- −$0
- Vacancy / Maint / Mgmt
- −$317
- Net cashflow
- $251
Break-even live
Sensitivity live
| Price | -10% $573 | -5% $279 | +0% $251 | +5% $222 | +10% $194 |
|---|---|---|---|---|---|
| Rent | -10% $131 | -5% $191 | +0% $251 | +5% $310 | +10% $370 |
| Rate | -1.0pp $301 | -0.5pp $276 | base $251 | +0.5pp $225 | +1.0pp $199 |
UW: 25.0% down · 7.5% · 30yr · 1.5% tax · 5.0% vac · 8.0% maint · 8.0% mgmt
Financing live
Cash to close
- Down payment
- $24,975
- Closing costs
- $2,997
- Reserves months
- —
- Total cash needed
- —
Loan-product check · same deal, 3 products live
Conventional
25% down · 7.5% · 30yr
- Down + closing
- —
- Monthly P&I
- —
- Monthly cashflow
- —
- DSCR
- —
- Eligible?
- —
Personal DTI + credit; lowest rate.
DSCR
20% down · 8.5% · 30yr
- Down + closing
- —
- Monthly P&I
- —
- Monthly cashflow
- —
- DSCR
- —
- Eligible?
- —
No personal income docs; deal must DSCR.
Hard money
10% down · 12.0% · 12mo
- Down + closing
- —
- Monthly P&I
- —
- Monthly cashflow
- —
- DSCR
- —
- Eligible?
- —
Short-term bridge; refi at stabilization.
Rent comps 19 comps
| Address | Beds | Baths | Sqft | Rent | $/sqft | DOM | Units | Dist |
|---|---|---|---|---|---|---|---|---|
| 20270 Hollywood St Harper Woods, MI | 3.0 | 1.0 | 1228 | $1,650 | $1.34 | 0d | 1 | 0.55mi |
| 20600 Balfour St Harper Woods, MI | 1.0–2.0 | 1.0–2.0 | 971 | $1,640 | $1.69 | 0d | 14 | 0.59mi |
| 23005 Kelly Rd Eastpointe, MI | 2.0 | 1.0 | 850 | $1,250 | $1.47 | 25d | 1 | 0.84mi |
| 22030 Cushing Ave Eastpointe, MI | 3.0 | 2.0 | 1300 | $1,650 | $1.27 | 6d | 1 | 0.94mi |
| 20015 Lochmoor St Harper Woods, MI | 3.0 | 1.0 | 1006 | $1,500 | $1.49 | 18d | 1 | 0.96mi |
| 20625 Elizabeth St Saint Clair Shores, MI | 3.0 | 2.0 | 1074 | $1,895 | $1.76 | 45d | 1 | 1.04mi |
| 22843 Grove St #47 Saint Clair Shores, MI | 1.0 | 1.0 | 700 | $1,100 | $1.57 | 21d | 1 | 1.06mi |
| 2175 Ridgemont Rd Grosse Pointe Woods, MI | 2.0 | 1.0 | 1100 | $1,300 | $1.18 | 45d | 1 | 1.07mi |
| 21727 California St Saint Clair Shores, MI | 3.0 | 2.0 | 1368 | $1,925 | $1.41 | 0d | 1 | 1.15mi |
| 1992 Hawthorne Rd Grosse Pointe Woods, MI | 3.0 | 2.0 | 1071 | $2,100 | $1.96 | 12d | 1 | 1.26mi |
| 2037 Vernier Rd Grosse Pointe Woods, MI | 2.0 | 1.0 | 850 | $1,350 | $1.59 | 45d | 1 | 1.27mi |
| 16410 Edmore Dr Detroit, MI | 3.0 | 1.0 | 850 | $1,250 | $1.47 | 16d | 1 | 1.27mi |
| 21633 Greater Mack Ave St Clair Shores, MI | 1.0 | 1.0 | 990 | $1,212 | $1.22 | 0d | 1 | 1.29mi |
| 22126 Alger St Saint Clair Shores, MI | 2.0 | 1.5 | 1060 | $1,750 | $1.65 | 12d | 1 | 1.31mi |
| 23124 Grove St Saint Clair Shores, MI | 3.0 | 1.0 | 1129 | $2,000 | $1.77 | 0d | 1 | 1.32mi |
| 16291 Eastburn St Detroit, MI | 3.0 | 1.0 | 1000 | $1,364 | $1.36 | 26d | 1 | 1.36mi |
| 16242 Bringard Dr Detroit, MI | 3.0 | 1.0 | 1350 | $1,300 | $0.96 | 6d | 1 | 1.38mi |
| 22307 Greater Mack Ave St Clair Shores, MI | 2.0 | 1.0 | 806 | $1,195 | $1.48 | 4d | 1 | 1.41mi |
| 16446 E State Fair St Detroit, MI | 2.0 | 1.0 | 1200 | $1,350 | $1.12 | 26d | 1 | 1.42mi |
Listing history 50 events
-
2026-06-01days on market $99,900 Active 69 DOM
-
2026-05-31days on market $99,900 Active 68 DOM
-
2026-03-25$99,900 Active 610-char remark
Show marketing remark (610 chars)
2-bedroom, 1-bath home with an updated kitchen, modern bathroom, and convenient first-floor laundry. The kitchen has been updated with new stainless steel appliances. The main floor includes a flexible second bedroom, while the spacious primary suite upstairs offers multiple walk-in closets. Enjoy a huge backyard perfect for entertaining or relaxing. Detached garage and generously sized driveway and front yard with deck space. Great location near shopping, dining, and more! Motivated seller. Tenants currently occupying. Ledger available upon request. Buyer and/or Buyer's agent to verify all information.
-
2026-03-23historical $99,900 610-char remark
Show marketing remark (610 chars)
2-bedroom, 1-bath home with an updated kitchen, modern bathroom, and convenient first-floor laundry. The kitchen has been updated with new stainless steel appliances. The main floor includes a flexible second bedroom, while the spacious primary suite upstairs offers multiple walk-in closets. Enjoy a huge backyard perfect for entertaining or relaxing. Detached garage and generously sized driveway and front yard with deck space. Great location near shopping, dining, and more! Motivated seller. Tenants currently occupying. Ledger available upon request. Buyer and/or Buyer's agent to verify all information.
-
2025-09-30historical
-
2025-09-11price $119,900
-
2025-09-11price $119,900
-
2025-09-04$125,000 Active
-
2025-09-04$125,000 Active
-
2025-09-01historical $1,300
-
2025-07-30$1,300
-
2025-07-30historical $1,300
-
2025-07-29$1,300
-
2023-09-26historical $1,500
-
2023-09-25historical Accepting Backup Offers
-
2023-09-25historical Accepting Backup Offers
-
2023-09-25historical
-
2023-09-25historical
-
2023-09-24$89,750 Active
-
2023-09-24$89,750 Active
-
2023-09-09historical
-
2023-09-09historical
-
2023-09-07$1,500
-
2023-09-02status Active
-
2023-09-02status Active
-
2023-08-12status Pending
-
2023-08-12status Pending
-
2023-08-09status Active
-
2023-08-09status Active
-
2023-08-04status Pending
-
2023-08-04status Pending
-
2023-07-24$94,750 Active
-
2023-07-24$94,750 Active
-
2022-09-20historical
-
2022-09-20historical
-
2022-09-07$109,750 Active
-
2022-09-07$109,750 Active
-
2022-08-01historical
-
2022-07-31historical
-
2022-06-18$99,750 Active
-
2022-06-18$99,750 Active
-
2022-06-01historical
-
2022-05-31historical
-
2022-05-12price $109,750
-
2022-05-12price $109,750
-
2022-05-07price $114,750
-
2022-05-06price $114,750
-
2022-04-28$119,750 Active
-
2022-04-28$119,750 Active
ⓘ Source: listings_history table (triggers on properties + properties_extension) + one-shot
backfill from property_details.listing_events for pre-trigger history.
Tax reassessment forecast MI · Partial reset (capped growth)
- Current annual tax
- $4,533 · $378/mo
- Projected year-2 tax
- $4,533 · $378/mo
- Expected delta
- $0/yr ($0/mo · 0.0%)
ⓘ Screening estimate from a state-policy table — verify with the county assessor before closing.
Climate risk First Street
- Flood 5/10 Major FEMA zone X (unshaded) · 51% chance over 30 yrs
- Wildfire 1/10 Low
- Heat 3/10 Moderate 7 d/yr ≥96°F today · 15 d/yr by 30 yrs out
- Wind 1/10 Low
- Air quality 4/10 Moderate 4 unhealthy d/yr today · 5 by 30 yrs out
Nearby sold comps map
Loading sold comps map…
Walkable amenities ~0.75 mi
Loading nearby amenities…
Taxation est. · year 1
- Rental income
- $18,138
- − Mortgage interest
- −$5,596
- − Property taxes
- −$4,533
- − Insurance
- −$500
- − Repairs & maintenance
- −$1,451
- − Management
- −$1,451
- − Depreciation
- −$2,906
- Taxable income
- $1,700
- Est. tax owed @ 24.0%
- −$408
- After-tax cash flow
- $2,601/yr
For passive investors: Depreciation is non-cash, so a rental often shows a tax loss while cash-flowing — sheltering income. Rental losses are passive: they offset passive income freely, and up to $25,000/yr can offset ordinary (W-2) income if you actively participate and your MAGI is under $100k (phasing out to $0 by $150k); unused losses carry forward. On sale, claimed depreciation is recaptured at up to 25%, and gains may owe capital-gains tax (a 1031 exchange can defer both). Figures are a year-1 estimate at your 24.0% rate — not tax advice; consult a CPA.
Schools (NCES district)
- District
- South Lake Schools
- NCES district ID
- 2632220
- Math proficiency
- 11% ▼ -10.00%
- Reading proficiency
- 26% ▼ -12.00%
- Median HH income
- $51,594
- Composite
- 16.76/100
- National rank
- #9159
- State rank
- #470 of 540 in MI
Livability — Eastpointe
- Score
- 73/100
- State rank
- #213
- US rank
- #5265
Category grades
Schools grade is shown separately in the Schools card above.
Census & demographics
- Census place
- Eastpointe, MI
- County
- Macomb County · 638,552 people
- City population
- 33,982
- Metro
- Detroit-Warren-Dearborn, MI
- Population (ZIP)
- 33,982
- Household income
- $62,325
- Rent vs Own
- Severe rent burden
- 1170.0
Population outlook (Macomb County) Hauer SSP2
- Today (2025)
- 925,296 people
- By 2030
- 948,226 · +2.5%
- By 2040
- 983,961 · +6.3%
- By 2050
- 1,010,200 · +9.2%
- By 2075
- 1,076,222 · +16.3%
- By 2100
- 1,077,065 · +16.4%
Race, ethnicity, and origin ACS 2023
- Neighborhood character
- Diverse neighborhood (Simpson 0.57)
- Race & ethnicity
- Black 53% White 39% Two or more races 7%
- Common ancestry
- Romanian 8% Lithuanian 2% Slovak 1%
- Foreign-born
- 3% · Canada
Political lean MEDSL · Macomb
- 2024 margin
- R (+13.7) · D 42.2% · R 55.9% · Other 1.9%
- 2008→2024 swing
- -22.3pp toward R · 2008: 8.6pp · 2024: -13.7pp
- All cycles
- 2024: R+13.7 2020: R+8.1 2016: R+11.6 2012: D+4.0 2008: D+8.6
Not yet ingested
- Civics
- —
Market trends
- HPI YoY
- ▼ -211.64%
- Current HPI
- 197.1905
- Rent YoY
- ▲ 3.47%
- Metro
- Detroit-Warren-Dearborn, MI
- State GDP YoY
- ▲ 1.37%
- F500 in state
- 28
Industry mix (Fortune 500 HQ in MI)
| Industry | F500 HQs | Revenue |
|---|---|---|
| Automotive Parts | 3 | $48B |
|
||
| Automotive | 2 | $372B |
|
||
| Chemicals | 1 | $45B |
|
||
| Automotive Retail | 1 | $29B |
|
||
| Healthcare / Medical Devices | 1 | $23B |
|
||
| Automotive Technology | 1 | $20B |
|
||
Price history
+212.2% since first listed62 events — show timeline
- 2026-03-25 Listed $99,900 MiRealSource-MiMLS
- 2026-03-25 Listed $99,900 REALCOMP
- 2026-03-23 Coming Soon $99,900 MiRealSource-MiMLS
- 2025-09-30 Listing Removed — MiRealSource-MiMLS
- 2025-09-11 Price Changed $119,900 MiRealSource-MiMLS
- 2025-09-11 Price Changed $119,900 REALCOMP
- 2025-09-04 Listed $125,000 REALCOMP
- 2025-09-04 Listed $125,000 MiRealSource-MiMLS
- 2025-09-01 Rental Removed $1,300 REALSOURCE
- 2025-07-30 Listed for Rent $1,300 REALSOURCE
- 2025-07-30 Rental Removed $1,300 REALCOMP
- 2025-07-29 Listed for Rent $1,300 REALCOMP
- 2023-09-26 Rental Removed $1,500 REALSOURCE
- 2023-09-25 Contingent — MiRealSource-MiMLS
- 2023-09-25 Contingent — REALCOMP
- 2023-09-25 Listing Removed — MiRealSource-MiMLS
- 2023-09-25 Listing Removed — REALCOMP
- 2023-09-24 Listed $89,750 MiRealSource-MiMLS
- 2023-09-24 Listed $89,750 REALCOMP
- 2023-09-09 Listing Removed — MiRealSource-MiMLS
- 2023-09-09 Listing Removed — REALCOMP
- 2023-09-07 Listed for Rent $1,500 REALSOURCE
- 2023-09-02 Relisted — MiRealSource-MiMLS
- 2023-09-02 Relisted — REALCOMP
- 2023-08-12 Pending — MiRealSource-MiMLS
- 2023-08-12 Pending — REALCOMP
- 2023-08-09 Relisted — MiRealSource-MiMLS
- 2023-08-09 Relisted — REALCOMP
- 2023-08-04 Pending — MiRealSource-MiMLS
- 2023-08-04 Pending — REALCOMP
- 2023-07-24 Listed $94,750 MiRealSource-MiMLS
- 2023-07-24 Listed $94,750 REALCOMP
- 2022-09-20 Listing Removed — REALCOMP
- 2022-09-20 Listing Removed — MiRealSource-MiMLS
- 2022-09-07 Listed $109,750 MiRealSource-MiMLS
- 2022-09-07 Listed $109,750 REALCOMP
- 2022-08-01 Listing Removed — REALCOMP
- 2022-07-31 Listing Removed — MiRealSource-MiMLS
- 2022-06-18 Listed $99,750 MiRealSource-MiMLS
- 2022-06-18 Listed $99,750 REALCOMP
- 2022-06-01 Listing Removed — REALCOMP
- 2022-05-31 Listing Removed — MiRealSource-MiMLS
- 2022-05-12 Price Changed $109,750 MiRealSource-MiMLS
- 2022-05-12 Price Changed $109,750 REALCOMP
- 2022-05-07 Price Changed $114,750 MiRealSource-MiMLS
- 2022-05-06 Price Changed $114,750 REALCOMP
- 2022-04-28 Listed $119,750 MiRealSource-MiMLS
- 2022-04-28 Listed $119,750 REALCOMP
- 2022-04-22 Coming Soon — MiRealSource-MiMLS
- 2022-04-22 Coming Soon — REALCOMP
- 2006-09-07 Listing Removed — MiRealSource-MiMLS
- 2006-09-06 Listing Removed — REALCOMP
- 2006-05-16 Listed $89,000 MiRealSource-MiMLS
- 2006-05-15 Listed $89,000 REALCOMP
- 2006-02-20 Listing Removed — MiRealSource-MiMLS
- 2006-02-10 Listing Removed — REALCOMP
- 2005-05-06 Listed $93,000 REALCOMP
- 2005-05-06 Listed $93,000 MiRealSource-MiMLS
- 2002-03-22 Sold (Public Records) $93,000 Public Records
- 1997-06-06 Sold (Public Records) $46,000 Public Records
- 1992-01-06 Sold (Public Records) $42,400 Public Records
- 1988-07-18 Sold (Public Records) $32,000 Public Records
Property tax history
+13.0%/yrLatest (2025): $4,533 · -9.8% YoY. Source: county tax records.
Cash-flow waterfall
monthlySold comps — $/sqft
last 12 mo · ≤1 miLoading sold comps…