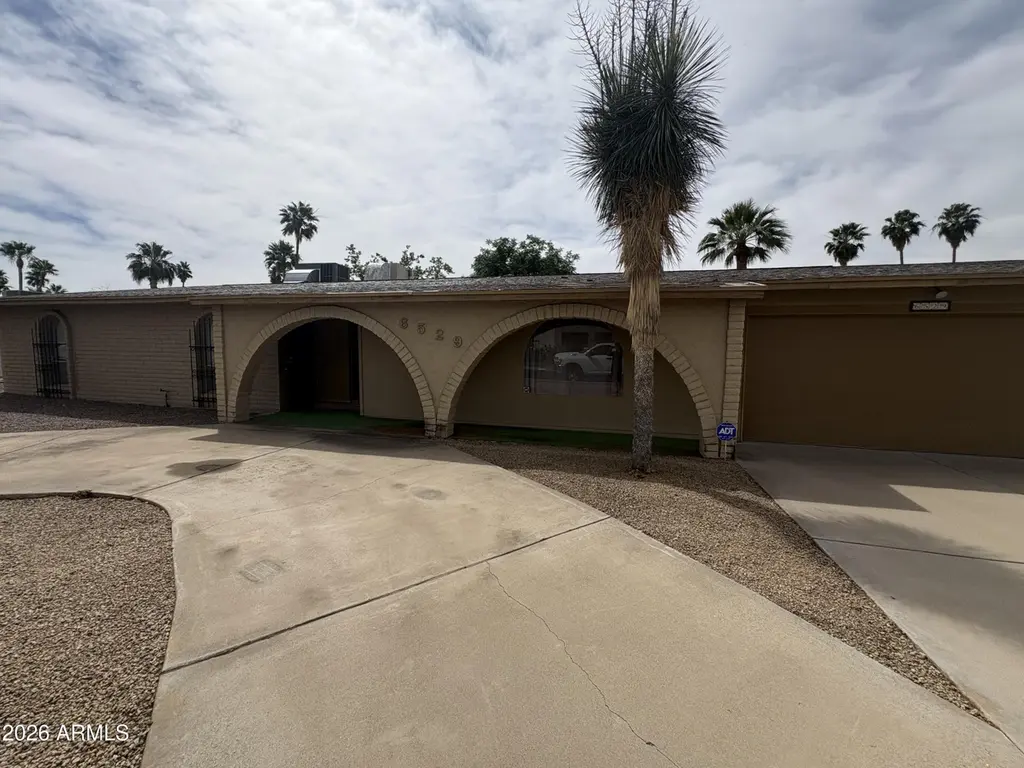
6529 E Camino Santo -- · Phoenix, AZ
Flood risk 1/10 · Minimal
- FEMA flood zone
- X (shaded)
- Chance of flooding over 30 yrs
- 0.0%
- Est. flood insurance / yr
- $507 – $1,088
Fire risk 1/10 · Minimal
- Est. fire insurance / yr
- $610 – $1,132
Heat risk 8/10 · Major
- Hot days now (above 111°F)
- 7 days/yr
- Hot days in 30 yrs
- 19 days/yr
Wind risk 1/10 · Minimal
- Chance of severe wind over 30 yrs
- —
Air-quality risk 3/10 · Minor
- Unhealthy air days now
- 3 days/yr
- Unhealthy air days in 30 yrs
- 4 days/yr
Risk factors via First Street. Map © Google.
Why this score? — see what drove the D+ grade
The composite is a weighted blend of 9 inputs, each scored 0–100. Each bar is that input's sub-score; the figure is the points it added to the 100-point composite (weight × sub-score).
- ARV discount +15.0/15.0
- Cash flow +14.0/30.0
- DSCR +4.2/10.0
- Schools +3.8/10.0
- Livability +3.8/5.0
- Rent growth +3.4/5.0
- 1% rule +2.7/10.0
- Condition / age +2.5/5.0
- Appreciation +0.0/10.0
$789,000
🖨 Deal sheet 📄 Offer letter ✓ Due diligence
Listing remarks
Value-add opportunity in Raskin Estates. This original-condition 2,398 sq ft home with a Pool sits on a 10,500+ lot in one of Scottsdale's most in-demand neighborhoods with No HOA. Located near Kierland, Scottsdale Quarter, top dining, golf, and freeway access. Ready for investor remodel or new construction. Cash or hard money only. Property to be sold AS-IS.
Key facts
- Near kierland
- 500+ lot
- Pool
Tags
Neighborhood map
What this means for you Summary
Snapshot
- This is a 4-bed/2.0-bath single-family listed at $789k.
Deal economics
- At list price, monthly cash flow is $95 ($1k/yr) — positive.
- The deal already cash-flows at list — no discount required.
- To meet the 1% rule (rent ≥ 1% of price), the offer needs to be $609k (22.8% below list).
- Recommended offer: $609k (22.8% below list) — sets the bar for 1% rule.
- Cap rate 6.4% vs local median 3.3% in Phoenix — top-decile yield for the area; either an underpriced asset or a hidden risk that comps aren't pricing in. Stress-test before assuming the spread holds.
Location & tenants
- Location reads 75/100 on livability (#16 in AZ, #3,924 nationally) — a middle-class / working-renter tenant base. Strengths: amenities A+, commute A+, housing A+; Watch: health & safety C-, crime F.
- Paradise Valley Unified District (4241) (urban): math 39% / reading 46% proficiency, ranked #56 of 249 in AZ (top 22%) — families likely to look elsewhere, expect single-tenant / working-renter base with shorter leases.
- Zoned schools: Desert Shadows Elementary School (math 60% / reading 61%, grade B-, #138 of 1,109 statewide, top 13%, 464 students, 15% FRL); Desert Shadows Middle School (math 45% / reading 52%, grade C-, #32 of 218 statewide, top 15%, 780 students, 7% FRL); Horizon High School (math 39% / reading 40%, grade F, #72 of 381 statewide, top 20%, 1,905 students, 7% FRL) — zoned schools average 10% FRL vs 29% district-wide (20 pts lower); this property's tenant base skews higher-income than the district average.
- Market conditions: Rents rising (+3.4%/yr); 392 active listings in the ZIP; 40 comparable units currently listed for rent nearby; rentals at typical pace (median 25d on market — plan ~3-4 weeks tenant-placement turnaround); 45% of comp listings sitting > 30 days — soft ceiling on asking rent; high-income renter base; 36,011 units permitted in Maricopa County in 2024 (12,801 in 5+ unit buildings).
- At $6,091/mo this rent would consume 59% of the median local household income ($123k/yr) (locally 1263% of renters already pay >50% of income on rent) — very limited rent-growth headroom before tenants either downsize or default.
Forward outlook
- Local home prices are declining (-3.0%/yr); year-one equity from $5k of loan paydown is wiped out by about $24k of value loss. Plan a longer hold.
- Maricopa County population projected at +38% by 2050 — long-run rental-demand tailwind backs the buy-and-hold thesis.
Negotiation context
- Only 12 days on market — expect competitive offers; lowballing is unlikely to land.
- Current owner paid $100k; list at $789k implies a 689% gain — meaningful room to come down on a strong offer.
Risks & watch-outs
- Climate carrying-cost: extreme-heat days projected 7→19/yr by 2055 (HVAC capex compounding) — expect insurance premiums to compound above CPI over the hold.
Questions for the listing agent
- Built in 1973 — when were the roof, HVAC, electrical panel, plumbing, and water heater last replaced?
- Is there a deadline driving the sale (1031 exchange, divorce, estate, relocation)? That informs how much negotiation room exists.
- Crime grade is F in this area — have there been break-ins, vandalism, or insurance claims at this property in the last 3 years? What carrier currently insures it and at what premium?
- The area grade is low — what's the realistic commute time and amenity access for the typical tenant pool here? Any planned neighborhood developments (good or bad) we should know about?
- What's the average days-on-market for RENTAL listings here right now (not sales)? A rising rental-DOM trend means longer vacancies and softer asking-rent achievability than the comps imply.
- What's the recent tenant-quality profile in this submarket — average credit score on applications, eviction rate, late-payment / NSF rate, and stable-employment percentage? A property-management company in the area should have these aggregated.
- How much new for-sale + rental construction is in the pipeline within 1–3 miles? Heavy new supply typically softens prices + rents 12–24 months out; constrained supply supports both.
Investment metrics
- 1% rule
- 0.77% ✗
- Cap rate
- 6.44%
- Cash-on-cash
- 0.52%
- DSCR
- 1.02
- GRM
- 10.8
CMA / ARV
- ARV (on-the-fly)
- $1,016,752
- Comps found
- 12
Show comp detail 12 sales within ~0.75 mi
| Address | Dist | Beds/Ba | Sqft | Sold | Price | $/sf | Match |
|---|---|---|---|---|---|---|---|
| 6529 E Camino Santo -- | 0.00mi | 4/2.0 | 2,398 (0%) | 1mo | $770,000 | $321 | 99 |
| 6440 E Jean Dr | 0.21mi | 4/2.0 | 2,277 (-5%) | 2mo | $995,000 | $437 | 80 |
| 6622 E Voltaire Ave | 0.25mi | 4/3.0 | 2,600 (+8%) | 0mo | $1,450,000 | $558 | 70 |
| 6639 E Voltaire Ave | 0.25mi | 4/2.0 | 2,123 (-12%) | 1mo | $775,000 | $365 | 68 |
| 13602 N 69th St | 0.46mi | 3/2.5 (-1) | 2,321 (-3%) | 1mo | $1,200,000 | $517 | 66 |
| 6729 E Dreyfus Ave | 0.29mi | 3/3.0 (-1) | 2,252 (-6%) | 2mo | $900,000 | $400 | 66 |
| 6912 E Thunderbird Rd | 0.57mi | 3/2.0 (-1) | 2,359 (-2%) | 1mo | $999,999 | $424 | 65 |
| 6411 E Camino Santo St | 0.16mi | 5/4.0 (+1) | 2,600 (+8%) | 0mo | $900,000 | $346 | 65 |
| 6502 E Sweetwater Ave | 0.18mi | 3/2.0 (-1) | 2,087 (-13%) | 2mo | $800,000 | $383 | 64 |
| 12435 N 61st Pl | 0.65mi | 4/2.0 | 2,276 (-5%) | 1mo | $1,175,000 | $516 | 61 |
| 7011 E Dreyfus Ave | 0.57mi | 3/2.0 (-1) | 2,143 (-11%) | 0mo | $1,200,000 | $560 | 50 |
| 6811 E Hearn Rd | 0.65mi | 4/3.0 | 2,624 (+9%) | 2mo | $1,020,000 | $389 | 49 |
Match score weights: distance 35% · size 25% · config 20% · recency 20%. Top-matched comps best support the ARV.
Projected returns pro-forma
-3.0% appreciation · 3.42% rent growth · sell at horizon
- IRR
- -15.1%
- Equity multiple
- 0.46×
- Total profit
- $-119,575
- Equity at exit
- $117,642
- IRR
- -6.0%
- Equity multiple
- 0.61×
- Total profit
- $-87,094
- Equity at exit
- $68,218
Cash invested: $220,920 (down + closing). Projections, not guarantees.
Landlord ↔ Tenant lean methodology
- Overall (STATE)
- 87 Strongly Landlord-Friendly
- State Arizona
- 87 Strongly Landlord-Friendly · R+3
- County
- — inherits STATE
- City
- — inherits STATE
ZIP-level market 85254
- Rents YoY
- 3.4%
- Active inventory
- 392
- Price-to-rent
- 10.8×
Monthly cashflow live
- Estimated rent
- $6,091 high interval (Pro) →
- Mortgage (P&I)
- −$4,138
- Tax from tax record
- −$251 /mo · $3,011/yr
- Insurance
- −$329
- HOA
- −$0
- Vacancy / Maint / Mgmt
- −$1,279
- Net cashflow
- $95
Break-even live
UW: 25.0% down · 7.5% · 30yr · 1.5% tax · 5.0% vac · 8.0% maint · 8.0% mgmt
Financing live
Cash to close
- Down payment
- $197,250
- Closing costs
- $23,670
- Reserves months
- —
- Total cash needed
- —
Loan-product check · same deal, 3 products live
Conventional
25% down · 7.5% · 30yr
- Down + closing
- —
- Monthly P&I
- —
- Monthly cashflow
- —
- DSCR
- —
- Eligible?
- —
Personal DTI + credit; lowest rate.
DSCR
20% down · 8.5% · 30yr
- Down + closing
- —
- Monthly P&I
- —
- Monthly cashflow
- —
- DSCR
- —
- Eligible?
- —
No personal income docs; deal must DSCR.
Hard money
10% down · 12.0% · 12mo
- Down + closing
- —
- Monthly P&I
- —
- Monthly cashflow
- —
- DSCR
- —
- Eligible?
- —
Short-term bridge; refi at stabilization.
Rent comps 40 comps
| Address | Beds | Baths | Sqft | Rent | $/sqft | DOM | Units | Dist |
|---|---|---|---|---|---|---|---|---|
| 6511 E Eugie Ter Scottsdale, AZ | 3.0 | 2.0 | 1842 | $7,000 | $3.80 | 44d | 1 | 0.07mi |
| 6612 E Presidio Rd Scottsdale, AZ | 3.0 | 2.0 | 2001 | $6,750 | $3.37 | 44d | 1 | 0.15mi |
| 6547 E Voltaire Ave Scottsdale, AZ | 3.0 | 3.0 | 2513 | $6,200 | $2.47 | 44d | 1 | 0.19mi |
| 6629 E Dreyfus Ave Scottsdale, AZ | 3.0 | 2.0 | 2048 | $6,000 | $2.93 | 44d | 1 | 0.22mi |
| 6712 E Pershing Ave Scottsdale, AZ | 5.0 | 3.5 | 2507 | $9,995 | $3.99 | 44d | 1 | 0.24mi |
| 6547 E Sharon Dr Unit 1558599P Scottsdale, AZ | 4.0 | 2.0 | 2389 | $6,860 | $2.87 | 8d | 1 | 0.24mi |
| 12636 N 68th St Scottsdale, AZ | 4.0 | 2.0 | 2002 | $5,500 | $2.75 | 18d | 1 | 0.46mi |
| 12228 N 64th St Scottsdale, AZ | 3.0 | 2.0 | 2495 | $3,695 | $1.48 | 44d | 1 | 0.65mi |
| 6935 E Hearn Rd Scottsdale, AZ | 4.0 | 2.0 | 2080 | $2,950 | $1.42 | 8d | 1 | 0.75mi |
| 14436 N 67th Pl Scottsdale, AZ | 4.0 | 2.0 | 2013 | $5,500 | $2.73 | 44d | 1 | 0.77mi |
| 6002 E Larkspur Dr Scottsdale, AZ | 4.0 | 3.0 | 2443 | $4,099 | $1.68 | 44d | 1 | 0.79mi |
| 5948 E Corrine Dr Scottsdale, AZ | 5.0 | 2.5 | 3028 | $15,000 | $4.95 | 24d | 1 | 0.81mi |
| 5921 E Thunderbird Rd Unit 1558638P Scottsdale, AZ | 4.0 | 3.0 | 2357 | $6,037 | $2.56 | 5d | 1 | 0.81mi |
| 6025 E Charter Oak Rd Scottsdale, AZ | 4.0 | 3.5 | 2767 | $20,000 | $7.23 | 24d | 1 | 0.82mi |
| 7220 E Sweetwater Ave Scottsdale, AZ | 3.0 | 2.0 | 2668 | $4,000 | $1.50 | 44d | 1 | 0.87mi |
| 12602 N Scottsdale Rd Scottsdale, AZ | 5.0 | 2.0 | 3000 | $4,495 | $1.50 | 18d | 1 | 0.88mi |
| 5902 E Corrine Dr Unit 1558626P Scottsdale, AZ | 4.0 | 2.5 | 2389 | $7,074 | $2.96 | 5d | 1 | 0.91mi |
| 13422 N 58th Pl Scottsdale, AZ | 5.0 | 3.5 | 2723 | $13,995 | $5.14 | 44d | 1 | 0.93mi |
| 6502 E Marilyn Rd Scottsdale, AZ | 3.0 | 2.0 | 1978 | $3,895 | $1.97 | 24d | 1 | 1.02mi |
| 12624 N 73rd Pl Scottsdale, AZ | 4.0 | 3.0 | 2774 | $5,300 | $1.91 | 44d | 1 | 1.04mi |
| 12202 N 58th Way Unit 1558603P Scottsdale, AZ | 5.0 | 3.0 | 2917 | $4,968 | $1.70 | 8d | 1 | 1.09mi |
| 11440 N 65th St Scottsdale, AZ | 4.0 | 3.0 | 2655 | $5,300 | $2.00 | 15d | 1 | 1.10mi |
| 12243 N 58th St Unit 1558608P Scottsdale, AZ | 4.0 | 2.0 | 2131 | $5,982 | $2.81 | 8d | 1 | 1.10mi |
| 11470 N 64th St Scottsdale, AZ | 3.0 | 3.5 | 2427 | $4,450 | $1.83 | 24d | 1 | 1.13mi |
| 14811 N Kierland Blvd Scottsdale, AZ | 3.0 | 1.0–2.0 | 1112 | $6,202 | $5.58 | 2d | 180 | 1.13mi |
| 5623 E Aster Dr Scottsdale, AZ | 4.0 | 2.5 | 2349 | $3,350 | $1.43 | 24d | 1 | 1.14mi |
| 13801 N 56th Pl Scottsdale, AZ | 3.0 | 2.0 | 1728 | $3,500 | $2.03 | 13d | 1 | 1.16mi |
| 14227 N 57th Way Scottsdale, AZ | 4.0 | 3.0 | 2736 | $4,995 | $1.83 | 44d | 1 | 1.17mi |
| 12242 N 74th St Scottsdale, AZ | 4.0 | 2.5 | 2378 | $5,200 | $2.19 | 24d | 1 | 1.18mi |
| 6245 E Janice Way Scottsdale, AZ | 3.0 | 2.0 | 1896 | $7,000 | $3.69 | 44d | 1 | 1.18mi |
| 12917 N 75th St Scottsdale, AZ | 4.0 | 2.5 | 3152 | $15,000 | $4.76 | 44d | 1 | 1.21mi |
| 12271 N 74th St Scottsdale, AZ | 4.0 | 2.0 | 2250 | $9,995 | $4.44 | 44d | 1 | 1.22mi |
| 15221 N Clubgate Dr Scottsdale, AZ | 2.0–3.0 | 2.0 | 1577 | $5,500 | $3.49 | 18d | 4 | 1.25mi |
| 15221 N Clubgate Dr Scottsdale, AZ | 2.0–3.0 | 2.0 | 1546 | $5,500 | $3.56 | 44d | 2 | 1.25mi |
| 5730 E Gelding Dr Scottsdale, AZ | 4.0 | 2.5 | 2372 | $3,895 | $1.64 | 3d | 1 | 1.25mi |
| 12402 N 74th Pl Unit 1558597P Scottsdale, AZ | 5.0 | 3.5 | 3336 | $5,600 | $1.68 | 5d | 1 | 1.28mi |
| 5709 E Gelding Dr Scottsdale, AZ | 4.0 | 2.5 | 2324 | $3,150 | $1.36 | 24d | 1 | 1.29mi |
| 5601 E Sylvia St Scottsdale, AZ | 5.0 | 2.5 | 2916 | $7,500 | $2.57 | 44d | 1 | 1.30mi |
| 15240 N Clubgate Dr #150 Scottsdale, AZ | 3.0 | 2.5 | 1985 | $7,500 | $3.78 | 44d | 1 | 1.32mi |
| 15218 N 61st St Scottsdale, AZ | 4.0 | 3.0 | 3130 | $11,995 | $3.83 | 24d | 1 | 1.34mi |
Listing history 4 events
-
2026-04-23status Pending
-
2026-04-17historical Under Contract Accepting Backups
-
2026-04-11$789,000 Active
-
1981-05-13soldstatus $100,000
ⓘ Source: listings_history table (triggers on properties + properties_extension) + one-shot
backfill from property_details.listing_events for pre-trigger history.
Tax reassessment forecast AZ · Resets to sale price
- Current annual tax
- $3,011 · $251/mo
- Projected year-2 tax
- $5,207 · $434/mo
- Expected delta
- +$2,197/yr (+$183/mo · 73.0%)
ⓘ Screening estimate from a state-policy table — verify with the county assessor before closing.
Climate risk First Street
- Flood 1/10 Low FEMA zone X (shaded) · 0% chance over 30 yrs
- Wildfire 1/10 Low
- Heat 8/10 Severe 7 d/yr ≥111°F today · 19 d/yr by 30 yrs out
- Wind 1/10 Low
- Air quality 3/10 Moderate 3 unhealthy d/yr today · 4 by 30 yrs out
Nearby sold comps map
Loading sold comps map…
Walkable amenities ~0.75 mi
Loading nearby amenities…
Taxation est. · year 1
- Rental income
- $73,098
- − Mortgage interest
- −$44,196
- − Property taxes
- −$3,011
- − Insurance
- −$3,945
- − Repairs & maintenance
- −$5,848
- − Management
- −$5,848
- − Depreciation
- −$22,953
- Taxable loss
- −$12,703
- Est. tax savings @ 24.0%
- +$3,049
- After-tax cash flow
- $4,189/yr
For passive investors: Depreciation is non-cash, so a rental often shows a tax loss while cash-flowing — sheltering income. Rental losses are passive: they offset passive income freely, and up to $25,000/yr can offset ordinary (W-2) income if you actively participate and your MAGI is under $100k (phasing out to $0 by $150k); unused losses carry forward. On sale, claimed depreciation is recaptured at up to 25%, and gains may owe capital-gains tax (a 1031 exchange can defer both). Figures are a year-1 estimate at your 24.0% rate — not tax advice; consult a CPA.
Schools (NCES district)
- District
- Paradise Valley Unified District (4241)
- NCES district ID
- 0405930
- Math proficiency
- 39% ▼ -11.00%
- Reading proficiency
- 46% ▼ -7.00%
- Median HH income
- $64,106
- Composite
- 37.89/100
- National rank
- #4316
- State rank
- #56 of 249 in AZ
Livability — Phoenix
- Score
- 75/100
- State rank
- #16
- US rank
- #3924
Category grades
Schools grade is shown separately in the Schools card above.
Census & demographics
- Census place
- Phoenix, AZ
- County
- Maricopa County · 4,537,380 people
- City population
- 1,500,198
- Metro
- Phoenix-Mesa-Chandler, AZ
- Population (ZIP)
- 45,558
- Household income
- $123,203
- Rent vs Own
- Severe rent burden
- 1263.0
Population outlook (Maricopa County) Hauer SSP2
- Today (2025)
- 4,979,203 people
- By 2030
- 5,378,229 · +8.0%
- By 2040
- 6,156,598 · +23.6%
- By 2050
- 6,872,376 · +38.0%
- By 2075
- 8,401,270 · +68.7%
- By 2100
- 9,247,439 · +85.7%
Race, ethnicity, and origin ACS 2023
- Neighborhood character
- Predominantly White (76%)
- Race & ethnicity
- White 76% Asian 9% Hispanic / Latino 9% Two or more races 8%
- Hispanic origin (detail)
- Mexican 5%
- Common ancestry
- Romanian 4% Italian 4% Slovak 3%
- Foreign-born
- 14% · Canada, Vietnam, China
- Languages at home
- 85% English-only · Other Indo-European 6% Spanish 3% Other Asian/Pacific 3%
Political lean MEDSL · Maricopa
- 2024 margin
- Toss-up / Even · D 47.7% · R 51.2% · Other 1.1%
- 2008→2024 swing
- +7.1pp toward D · 2008: -10.6pp · 2024: -3.5pp
- All cycles
- 2024: R+3.5 2020: D+2.2 2016: R+3.5 2012: R+12.0 2008: R+10.6
Not yet ingested
- Civics
- —
Market trends
- HPI YoY
- ▼ -544.56%
- Current HPI
- 398.7261
- Rent YoY
- ▲ 3.42%
- Metro
- Phoenix-Mesa-Chandler, AZ
- State GDP YoY
- ▲ 4.54%
- F500 in state
- 20
Industry mix (Fortune 500 HQ in AZ)
| Industry | F500 HQs | Revenue |
|---|---|---|
| Technology | 2 | $13B |
|
||
| Mining / Metals | 1 | $23B |
|
||
| Environmental Services | 1 | $16B |
|
||
| Metals / Steel | 1 | $14B |
|
||
| Technology Distribution | 1 | $9B |
|
||
| Homebuilding | 1 | $8B |
|
||
Price history
+689.0% since first listed4 events — show timeline
- 2026-04-23 Pending — ARMLS
- 2026-04-17 Contingent — ARMLS
- 2026-04-11 Listed $789,000 ARMLS
- 1981-05-13 Sold (Public Records) $100,000 Public Records
Property tax history
+1.5%/yrLatest (2025): $3,011 · +2.6% YoY. Source: county tax records.
Cash-flow waterfall
monthlySold comps — $/sqft
last 12 mo · ≤1 miLoading sold comps…