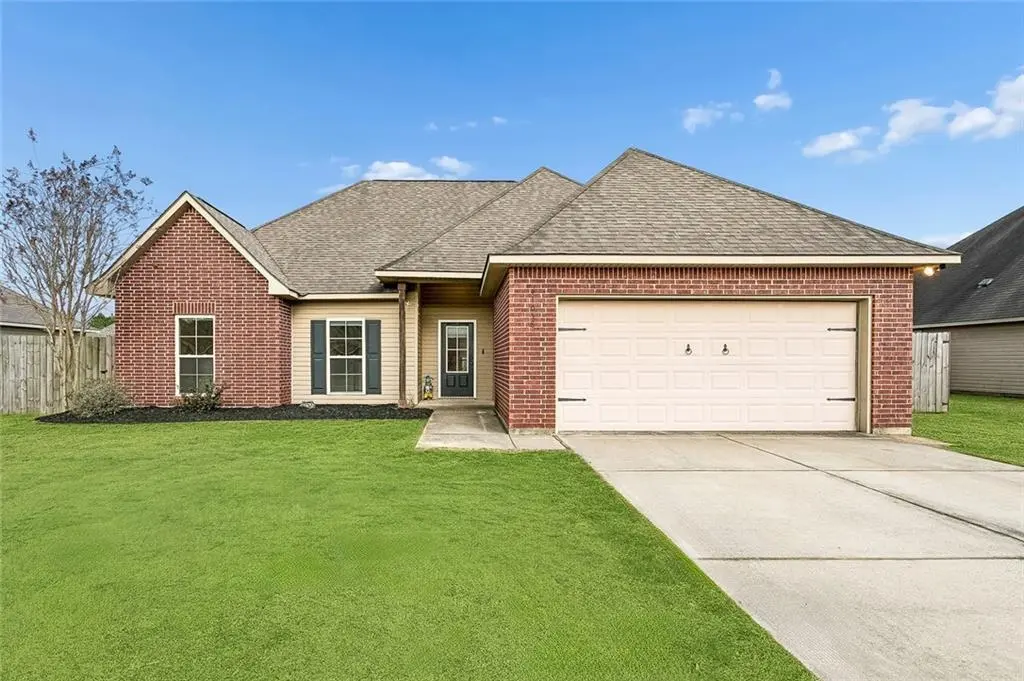
41058 Magenta Dr · Ponchatoula, LA
Flood risk 1/10 · Minimal
- FEMA flood zone
- X (unshaded)
- Chance of flooding over 30 yrs
- 0.0%
- Est. flood insurance / yr
- $507 – $1,088
Fire risk 4/10 · Minor
- Est. fire insurance / yr
- $1,269 – $2,357
Heat risk 10/10 · Severe
- Hot days now (above 109°F)
- 7 days/yr
- Hot days in 30 yrs
- 23 days/yr
Wind risk 9/10 · Severe
- Chance of severe wind over 30 yrs
- 99.0%
Air-quality risk 2/10 · Minimal
- Unhealthy air days now
- 0 days/yr
- Unhealthy air days in 30 yrs
- 1 days/yr
Risk factors via First Street. Map © Google.
Why this score? — see what drove the D grade
The composite is a weighted blend of 9 inputs, each scored 0–100. Each bar is that input's sub-score; the figure is the points it added to the 100-point composite (weight × sub-score).
- Cash flow +15.0/30.0
- ARV discount +7.2/15.0
- DSCR +4.6/10.0
- 1% rule +3.6/10.0
- Livability +3.4/5.0
- Rent growth +2.7/5.0
- Condition / age +2.5/5.0
- Schools +2.0/10.0
- Appreciation +0.0/10.0
$244,900
🖨 Deal sheet (PDF) 📄 Offer letter ✓ Due diligence
Listing remarks MLS
Welcome to 41058 Magenta Dr in Bedico Meadows. This inviting property features offers a comfortable, functional layout with nearly 1700 sf living area in an established subdivision with community pool and playground access. Open concept living/dining/ kitchen designed for everyday living as well as entertaining. Kitchen has upgraded granite counters and new backsplash, all appliances included. The windows all along the back wall allow for ample natural light and views of the covered patio and spacious yard. Huge walk in pantry and dedicated laundry room are wonderful for storage. Primary bath has double sinks, lots of cabinets, and separate shower/tub, as well as a generous closet. Two additional bedrooms share a cute hall bath, also with granite counters. The double garage with separate air conditioning. Fenced backyard with large side gate access is ready for spring and summer. Conveniently located on the Ponchatoula/Madisonville line, location offers easy access to Ponchatoula, Madisonville, Mandeville, Convington, and and Hammond Call today to schedule a showing.
Key facts
- Spacious yard
- Ample natural light
- Huge walk in pantry
Tags
Property features AI
Finance
- HOA & community: Homeowners association with annual fee of $260; Community clubhouse; Community pool
Exterior
- Parking: Garage; Off-street parking
- Security: Smoke detectors
- Utilities: Public water; Public sewer
- Home design: Single-story home
- Construction: Brick and vinyl siding exterior; Shingle roof; Slab foundation; Built in excellent condition
- Exterior features: Concrete covered patio/porch; City lot, rectangular
Interior
- Kitchen: Cooktop; Dishwasher; Disposal; Microwave; Oven; Refrigerator
- Bedrooms: Total of 5 rooms (includes bedrooms and living spaces)
- Bathrooms: 2 full bathrooms
- Heating & cooling: Central heating; Central air conditioning
- Interior features: Attic with pull-down attic stairs; Stone countertops
Neighborhood map
What this means for you Summary
Snapshot
- This is a 3-bed/2.0-bath single-family listed at $245k.
Deal economics
- At list price, monthly cash flow is $75 ($905/yr) — positive.
- The deal already cash-flows at list — no discount required.
- To meet the 1% rule (rent ≥ 1% of price), the offer needs to be $212k (13.6% below list).
- Recommended offer: $212k (13.6% below list) — sets the bar for 1% rule.
- Cap rate 6.7% vs local median 5.2% in Ponchatoula — meaningfully above typical; check what's discounted (condition, days-on-market, listing class) to confirm the premium yield is real.
Location & tenants
- Location reads 68/100 on livability (#91 in LA) — a middle-class / working-renter tenant base. Strengths: cost of living A+, health & safety A+, housing A-; Watch: employment D, crime D-, amenities F.
- Tangipahoa Parish (rural): math 18% / reading 29% proficiency, ranked #63 of 98 in LA (top 64%) — low school quality limits family demand, transient renter base, plan for 1-2y turnover; 73% free/reduced lunch — lower-income household profile, screen leases tightly.
- Zoned schools: Champ Cooper Elementary School (math 18% / reading 41%, grade F, #333 of 646 statewide, top 54%, 1,126 students, 57% FRL); Ponchatoula High School (math 29% / reading 40%, grade F, #106 of 265 statewide, top 43%, 2,262 students, 51% FRL) — zoned schools average 54% FRL vs 73% district-wide (19 pts lower); this property's tenant base skews higher-income than the district average.
- Market conditions: Rents flat; 527 active listings in the ZIP; 2 comparable units currently listed for rent nearby; 1,085 units permitted in Tangipahoa Parish in 2024 (378 in 5+ unit buildings).
- This rent runs 35% of the median local income ($72k/yr) — at the standard rent-burdened threshold; future hikes will face affordability resistance.
Forward outlook
- Local home prices are declining (-3.0%/yr); year-one equity from $2k of loan paydown is wiped out by about $7k of value loss. Plan a longer hold.
- Tangipahoa County population projected at +22% by 2050 — long-run rental-demand tailwind backs the buy-and-hold thesis.
Negotiation context
- Only 5 days on market — expect competitive offers; lowballing is unlikely to land.
- 9 sale attempts since 16y ago with the ask held roughly flat each time — persistent listings suggest the price (not the market) is what's stuck; bring a comps-based counter.
Risks & watch-outs
- Climate carrying-cost: severe wind risk, 99% chance of damaging wind over 30y; extreme-heat days projected 7→23/yr by 2055 (HVAC capex compounding) — expect insurance premiums to compound above CPI over the hold.
Questions for the listing agent
- What does the HOA fee cover, when was the last increase, and are there any pending special assessments or reserve-fund shortfalls?
- Is there a deadline driving the sale (1031 exchange, divorce, estate, relocation)? That informs how much negotiation room exists.
- Schools are B-rated — typically a magnet for longer-tenancy family renters. What's the average tenant stay here, and is there a school-zone premium baked into asking?
- Crime grade is D in this area — have there been break-ins, vandalism, or insurance claims at this property in the last 3 years? What carrier currently insures it and at what premium?
- The area grade is low — what's the realistic commute time and amenity access for the typical tenant pool here? Any planned neighborhood developments (good or bad) we should know about?
- What's the average days-on-market for RENTAL listings here right now (not sales)? A rising rental-DOM trend means longer vacancies and softer asking-rent achievability than the comps imply.
- What's the recent tenant-quality profile in this submarket — average credit score on applications, eviction rate, late-payment / NSF rate, and stable-employment percentage? A property-management company in the area should have these aggregated.
- How much new for-sale + rental construction is in the pipeline within 1–3 miles? Heavy new supply typically softens prices + rents 12–24 months out; constrained supply supports both.
Investment metrics
- 1% rule
- 0.86% ✗
- Cap rate
- 6.66%
- Cash-on-cash
- 1.32%
- DSCR
- 1.06
- GRM
- 9.6
CMA / ARV
- ARV (median comp)
- $243,101
- List price
- $244,900
- Delta
- 0.78%
- Verdict
- FAIR
- Comps
- 20 within 1.0 mi
Show comp detail 12 sales within ~0.75 mi
| Address | Dist | Beds/Ba | Sqft | Sold | Price | $/sf | Match |
|---|---|---|---|---|---|---|---|
| 28507 Rosedust Ln | 0.18mi | 3/2.0 | 1,683 (-0%) | 2mo | $238,000 | $141 | 90 |
| 41958 Snowball Cir | 0.11mi | 3/2.0 | 1,617 (-4%) | 3mo | $229,000 | $142 | 85 |
| 70048 Hirson Ct | 0.34mi | 3/2.0 | 1,689 (-0%) | 0mo | $267,000 | $158 | 84 |
| 69261 Taverny Ct | 0.26mi | 3/2.0 | 1,732 (+2%) | 1mo | $286,000 | $165 | 83 |
| 41911 Snowball Cir | 0.12mi | 3/2.0 | 1,617 (-4%) | 4mo | $230,000 | $142 | 83 |
| 69484 Taverny Ct | 0.26mi | 3/2.0 | 1,747 (+3%) | 4mo | $280,000 | $160 | 79 |
| 69628 Taverny Ct | 0.46mi | 3/2.0 | 1,715 (+1%) | 4mo | $272,000 | $159 | 73 |
| 10136 Cesson Ct | 0.43mi | 3/2.0 | 1,615 (-5%) | 3mo | $271,000 | $168 | 70 |
| 41173 Snowball Cir | 0.43mi | 3/2.0 | 1,585 (-6%) | 0mo | $215,000 | $136 | 69 |
| 28621 Venette Ct | 0.36mi | 4/2.0 (+1) | 1,939 (+15%) | 3mo | $310,000 | $160 | 52 |
| 28515 Vintage Ln | 0.56mi | 3/2.0 | 1,476 (-13%) | 4mo | $224,000 | $152 | 50 |
| 28465 Plum St | 0.66mi | 3/2.0 | 1,438 (-15%) | 3mo | $203,680 | $142 | 42 |
Match score weights: distance 35% · size 25% · config 20% · recency 20%. Top-matched comps best support the ARV.
Projected returns pro-forma
-3.0% appreciation · 0.66% rent growth · sell at horizon
- IRR
- -16.7%
- Equity multiple
- 0.42×
- Total profit
- $-39,777
- Equity at exit
- $36,515
- IRR
- -13.2%
- Equity multiple
- 0.31×
- Total profit
- $-47,627
- Equity at exit
- $21,174
Cash invested: $68,572 (down + closing). Projections, not guarantees.
Landlord ↔ Tenant lean methodology
- Overall (STATE)
- 90 Strongly Landlord-Friendly
- State Louisiana
- 90 Strongly Landlord-Friendly · R+12
- County
- — inherits STATE
- City
- — inherits STATE
ZIP-level market 70454
- Rents YoY
- 0.7%
- Active inventory
- 527
- Price-to-rent
- 9.6×
Monthly cashflow live
- Estimated rent
- $2,117 medium interval (Pro) →
- Mortgage (P&I)
- −$1,284
- Tax from tax record
- −$188 /mo · $2,260/yr
- Insurance
- −$102
- HOA
- −$22
- Vacancy / Maint / Mgmt
- −$444
- Net cashflow
- $75
Break-even live
Sensitivity live
| Price | -10% $214 | -5% $145 | +0% $75 | +5% $6 | +10% $-63 |
|---|---|---|---|---|---|
| Rent | -10% $-92 | -5% $-8 | +0% $75 | +5% $159 | +10% $243 |
| Rate | -1.0pp $199 | -0.5pp $138 | base $75 | +0.5pp $12 | +1.0pp $-53 |
UW: 25.0% down · 7.5% · 30yr · 1.5% tax · 5.0% vac · 8.0% maint · 8.0% mgmt
Financing live
Cash to close
- Down payment
- $61,225
- Closing costs
- $7,347
- Reserves months
- —
- Total cash needed
- —
Loan-product check · same deal, 3 products live
Conventional
25% down · 7.5% · 30yr
- Down + closing
- —
- Monthly P&I
- —
- Monthly cashflow
- —
- DSCR
- —
- Eligible?
- —
Personal DTI + credit; lowest rate.
DSCR
20% down · 8.5% · 30yr
- Down + closing
- —
- Monthly P&I
- —
- Monthly cashflow
- —
- DSCR
- —
- Eligible?
- —
No personal income docs; deal must DSCR.
Hard money
10% down · 12.0% · 12mo
- Down + closing
- —
- Monthly P&I
- —
- Monthly cashflow
- —
- DSCR
- —
- Eligible?
- —
Short-term bridge; refi at stabilization.
Rent comps 2 comps
| Address | Beds | Baths | Sqft | Rent | $/sqft | DOM | Units | Dist |
|---|---|---|---|---|---|---|---|---|
| 69332 Taverny Ct Madisonville, LA | 3.0 | 2.0 | 2000 | $2,250 | $1.12 | 45d | 1 | 0.16mi |
| 400 Walter Ln Madisonville, LA | 3.0 | 2.5 | 2217 | $2,400 | $1.08 | 25d | 1 | 1.34mi |
HOA detail
- Monthly dues
- $22 · $264/yr
- Likely covers
- pool
Listing history 23 events
-
2026-06-21days on market $244,900 Active 5 DOM
-
2026-06-19days on market $244,900 Active 3 DOM
-
2026-06-18days on market $244,900 Active 2 DOM
-
2026-06-17pricedays on market $244,900 Active 1 DOM
-
2026-05-30days on market $245,000 Active 92 DOM
-
2026-03-28price $245,000 820-char remark
-
2026-03-28price $245,000 820-char remark
-
2026-02-27price $249,000 820-char remark
-
2026-02-27$249,000 Active 820-char remark
-
2026-02-27$245,000 Active 820-char remark
-
2022-06-27soldstatus $259,000
-
2022-06-17soldstatus $259,000 Closed
-
2022-05-18status Pending
-
2022-05-12$260,000 Active
-
2022-05-12$260,000
-
2014-07-10soldstatus $164,900
-
2014-06-30soldstatus $164,900
-
2014-04-08$164,900
-
2014-04-08$164,900
-
2011-01-21soldstatus $156,200
-
2010-06-23$156,200
-
2010-06-23$156,200
-
2010-01-06soldstatus $800,000
ⓘ Source: listings_history table (triggers on properties + properties_extension) + one-shot
backfill from property_details.listing_events for pre-trigger history.
Tax reassessment forecast LA · Resets to sale price
- Current annual tax
- $2,260 · $188/mo
- Projected year-2 tax
- $2,260 · $188/mo
- Expected delta
- $0/yr ($0/mo · 0.0%)
ⓘ Screening estimate from a state-policy table — verify with the county assessor before closing.
Climate risk First Street
- Flood 1/10 Low FEMA zone X (unshaded) · 0% chance over 30 yrs
- Wildfire 4/10 Moderate
- Heat 10/10 Extreme 7 d/yr ≥109°F today · 23 d/yr by 30 yrs out
- Wind 9/10 Extreme 99% chance of damaging wind over 30 yrs
- Air quality 2/10 Low 0 unhealthy d/yr today · 1 by 30 yrs out
Nearby sold comps map
Loading sold comps map…
Walkable amenities ~0.75 mi
Loading nearby amenities…
Taxation est. · year 1
- Rental income
- $25,399
- − Mortgage interest
- −$13,718
- − Property taxes
- −$2,260
- − Insurance
- −$1,224
- − Repairs & maintenance
- −$2,032
- − Management
- −$2,032
- − HOA
- −$264
- − Depreciation
- −$7,124
- Taxable loss
- −$3,256
- Est. tax savings @ 24.0%
- +$781
- After-tax cash flow
- $1,687/yr
For passive investors: Depreciation is non-cash, so a rental often shows a tax loss while cash-flowing — sheltering income. Rental losses are passive: they offset passive income freely, and up to $25,000/yr can offset ordinary (W-2) income if you actively participate and your MAGI is under $100k (phasing out to $0 by $150k); unused losses carry forward. On sale, claimed depreciation is recaptured at up to 25%, and gains may owe capital-gains tax (a 1031 exchange can defer both). Figures are a year-1 estimate at your 24.0% rate — not tax advice; consult a CPA.
Schools (NCES district)
- District
- Tangipahoa Parish
- NCES district ID
- 2201680
- Math proficiency
- 18% ▼ -32.00%
- Reading proficiency
- 29% ▼ -31.00%
- Median HH income
- $41,283
- Composite
- 19.94/100
- National rank
- #8676
- State rank
- #63 of 98 in LA
Livability — Ponchatoula
- Score
- 68/100
- State rank
- #91
- US rank
- #9755
Category grades
Schools grade is shown separately in the Schools card above.
Census & demographics
- County
- Tangipahoa Parish · 85,958 people
- City population
- 34,564
- Metro
- Hammond, LA
- Population (ZIP)
- 34,564
- Household income
- $71,611
- Rent vs Own
- Severe rent burden
- 479.0
Population outlook (Tangipahoa County) Hauer SSP2
- Today (2025)
- 144,204 people
- By 2030
- 151,413 · +5.0%
- By 2040
- 164,374 · +14.0%
- By 2050
- 175,427 · +21.7%
- By 2075
- 195,165 · +35.3%
- By 2100
- 201,641 · +39.8%
Race, ethnicity, and origin ACS 2023
- Neighborhood character
- Predominantly White (73%)
- Race & ethnicity
- White 73% Black 16% Two or more races 8% Hispanic / Latino 8%
- Hispanic origin (detail)
- Mexican 2%
- Common ancestry
- Lithuanian 15% Slovak 1% Portuguese 1%
- Foreign-born
- 3% · Canada
- Languages at home
- 94% English-only · Spanish 5%
Political lean MEDSL · Tangipahoa
- 2024 margin
- Solid R (+37.4) · D 30.6% · R 68.0% · Other 1.3%
- 2008→2024 swing
- -6.5pp toward R · 2008: -30.9pp · 2024: -37.4pp
- All cycles
- 2024: R+37.4 2020: R+32.8 2016: R+32.6 2012: R+27.7 2008: R+30.9
Not yet ingested
- Civics
- —
Market trends
- HPI YoY
- ▼ -83.55%
- Current HPI
- 129.6069
- Rent YoY
- ▲ 0.66%
- Metro
- Hammond, LA
- State GDP YoY
- ▲ 3.29%
- F500 in state
- 10
Industry mix (Fortune 500 HQ in LA)
| Industry | F500 HQs | Revenue |
|---|---|---|
| Telecommunications | 2 | $23B |
|
||
| Utilities | 1 | $12B |
|
||
| Wholesale / Distribution | 1 | $5B |
|
||
| Advertising | 1 | $2B |
|
||
Price history
-69.4% since first listed19 events — show timeline
- 2026-06-16 Listed $244,900 GSREIN
- 2026-06-16 Listed $244,900 AcadianaMLS
- 2026-03-28 Price Changed $245,000 AcadianaMLS
- 2026-03-28 Price Changed $245,000 GSREIN
- 2026-02-27 Price Changed $249,000 GSREIN
- 2026-02-27 Listed $249,000 AcadianaMLS
- 2022-06-27 Sold (Public Records) $259,000 Public Records
- 2022-06-17 Sold (MLS) $259,000 GSREIN
- 2022-05-18 Pending — GSREIN
- 2022-05-12 Listed $260,000 GSREIN
- 2022-05-12 Listed $260,000 AcadianaMLS
- 2014-07-10 Sold (Public Records) $164,900 Public Records
- 2014-06-30 Sold (MLS) $164,900 GSREIN
- 2014-04-08 Listed $164,900 AcadianaMLS
- 2014-04-08 Listed $164,900 GSREIN
- 2011-01-21 Sold (MLS) $156,200 GSREIN
- 2010-06-23 Listed $156,200 GSREIN
- 2010-06-23 Listed $156,200 AcadianaMLS
- 2010-01-06 Sold (Public Records) $800,000 Public Records
Property tax history
+4.4%/yrLatest (2025): $2,260 · +1.0% YoY. Source: county tax records.
Cash-flow waterfall
monthlySold comps — $/sqft
last 12 mo · ≤1 miLoading sold comps…