1050 W Capitol Ave · West Sacramento, CA
Flood risk No data
- FEMA flood zone
- —
- Chance of flooding over 30 yrs
- %
- Est. flood insurance / yr
- —
Fire risk No data
- Est. fire insurance / yr
- —
Heat risk No data
- Hot days now (above °F)
- days/yr
- Hot days in 30 yrs
- days/yr
Wind risk No data
- Chance of severe wind over 30 yrs
- %
Air-quality risk No data
- Unhealthy air days now
- days/yr
- Unhealthy air days in 30 yrs
- days/yr
Risk factors via First Street. Map © Google.
Why this score? — see what drove the B grade
The composite is a weighted blend of 9 inputs, each scored 0–100. Each bar is that input's sub-score; the figure is the points it added to the 100-point composite (weight × sub-score).
- Cash flow +30.0/30.0
- DSCR +10.0/10.0
- 1% rule +9.6/10.0
- ARV discount +7.5/15.0
- Schools +3.8/10.0
- Livability +3.7/5.0
- Rent growth +3.0/5.0
- Condition / age +2.5/5.0
- Appreciation +0.0/10.0
$189,000
🖨 Deal sheet 📄 Offer letter ✓ Due diligence
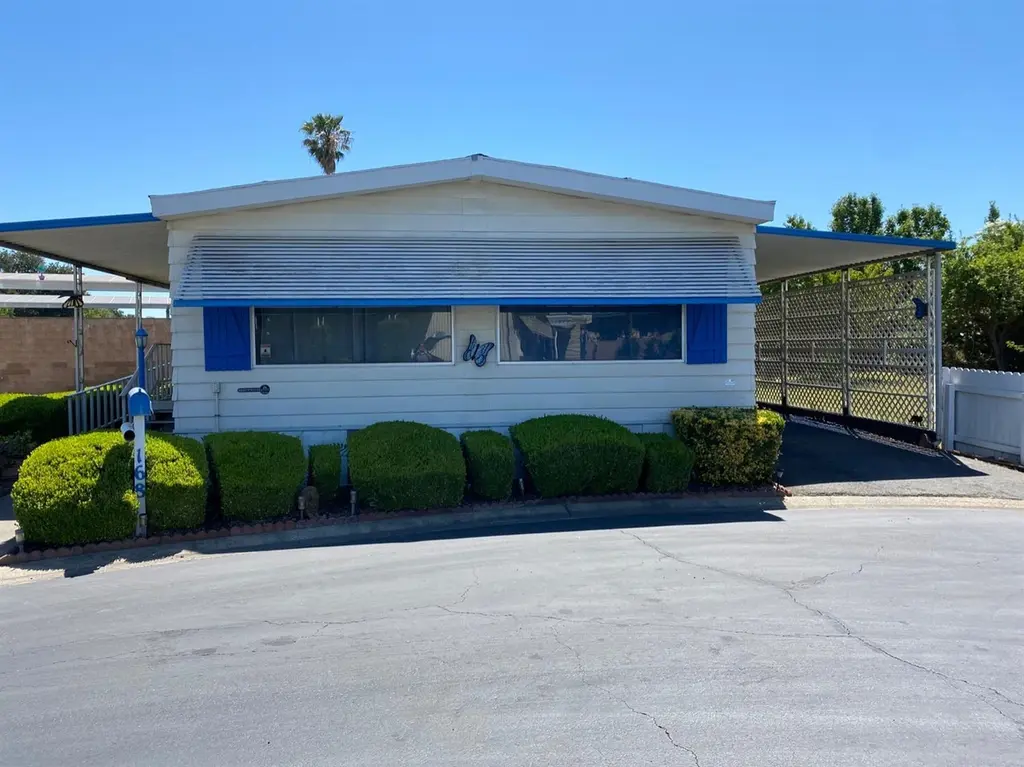
Listing remarks
We have a beautiful and brand new 3 bedroom home available now for sale! This home has an open layout concept in the living room and kitchen. The kitchen is fully equipped with new appliances, and a large kitchen island perfect for entertaining. There is a laundry area with washer and dryer hookups, two full bathrooms, additional closet space, and double pane windows. This 3 bedroom is located in the community Casa Mobile in West Sacramento, which offers it& apos; s residents a variety of amenities such as a pool, laundry facility, car wash area, a clubhouse and more! The home lot rent for this 3 bedroom is $825 per month. We are offering a Summer Move In Special of 3 months free lot re
Key facts
- Large kitchen island
- Clubhouse
- Laundry area
Tags
Neighborhood map
What this means for you Summary
Snapshot
- This is a 3-bed/2.0-bath other listed at $189k.
Deal economics
- At list price, monthly cash flow is $880 ($11k/yr) — positive.
- The deal already cash-flows at list — no discount required.
- Meets the 1% rule at list price ($3k rent vs $189k).
Location & tenants
- Location reads 73/100 on livability (#164 in CA) — a middle-class / working-renter tenant base. Strengths: housing A+, commute A, employment A-; Watch: cost of living F.
- Washington Unified (suburban): math 30% / reading 57% proficiency, ranked #197 of 517 in CA (top 38%) — families likely to look elsewhere, expect single-tenant / working-renter base with shorter leases.
- Market conditions: Rents rising (+1.9%/yr); 151 active listings in the ZIP; 22 comparable units currently listed for rent nearby; rentals leasing fast (median 8d on market — plan ~1-2 weeks tenant-placement turnaround); solid renter incomes; 721 units permitted in Yolo County in 2024 (260 in 5+ unit buildings).
- This rent runs 32% of the median local income ($105k/yr) — at the standard rent-burdened threshold; future hikes will face affordability resistance.
Forward outlook
- Local home prices are declining (-3.0%/yr); year-one equity from $1k of loan paydown is wiped out by about $6k of value loss. Plan a longer hold.
- Yolo County population projected at +31% by 2050 — long-run rental-demand tailwind backs the buy-and-hold thesis.
- At projected returns (-3.0% appreciation + 1.9% rent growth), your $53k cash investment doubles in ~7 years — after that, you're playing with house money.
Negotiation context
- Only 1 days on market — expect competitive offers; lowballing is unlikely to land.
Questions for the listing agent
- Is there a deadline driving the sale (1031 exchange, divorce, estate, relocation)? That informs how much negotiation room exists.
- What's the average days-on-market for RENTAL listings here right now (not sales)? A rising rental-DOM trend means longer vacancies and softer asking-rent achievability than the comps imply.
- What's the recent tenant-quality profile in this submarket — average credit score on applications, eviction rate, late-payment / NSF rate, and stable-employment percentage? A property-management company in the area should have these aggregated.
- How much new for-sale + rental construction is in the pipeline within 1–3 miles? Heavy new supply typically softens prices + rents 12–24 months out; constrained supply supports both.
Investment metrics
- 1% rule
- 1.46% ✓
- Cap rate
- 11.88%
- Cash-on-cash
- 19.95%
- DSCR
- 1.89
- GRM
- 5.7
CMA / ARV
No comps found within radius.
Projected returns pro-forma
-3.0% appreciation · 1.87% rent growth · sell at horizon
- IRR
- 10.8%
- Equity multiple
- 1.42×
- Total profit
- $22,351
- Equity at exit
- $28,181
- IRR
- 18.9%
- Equity multiple
- 2.50×
- Total profit
- $79,322
- Equity at exit
- $16,341
Cash invested: $52,920 (down + closing). Projections, not guarantees.
Landlord ↔ Tenant lean methodology
- Overall (STATE)
- 18 Strongly Tenant-Friendly
- State California
- 18 Strongly Tenant-Friendly · D+13
- County
- — inherits STATE
- City
- — inherits STATE
ZIP-level market 95691
- Home prices YoY
- -35.0%
- Rents YoY
- 1.9%
- Active inventory
- 151
- Price-to-rent
- 5.7×
Monthly cashflow live
- Estimated rent
- $2,767 high interval (Pro) →
- Mortgage (P&I)
- −$991
- Tax est. 1.5%
- −$236 /mo · $2,835/yr
- Insurance
- −$79
- HOA
- −$0
- Vacancy / Maint / Mgmt
- −$581
- Net cashflow
- $880
Break-even live
UW: 25.0% down · 7.5% · 30yr · 1.5% tax · 5.0% vac · 8.0% maint · 8.0% mgmt
Financing live
Cash to close
- Down payment
- $47,250
- Closing costs
- $5,670
- Reserves months
- —
- Total cash needed
- —
Loan-product check · same deal, 3 products live
Conventional
25% down · 7.5% · 30yr
- Down + closing
- —
- Monthly P&I
- —
- Monthly cashflow
- —
- DSCR
- —
- Eligible?
- —
Personal DTI + credit; lowest rate.
DSCR
20% down · 8.5% · 30yr
- Down + closing
- —
- Monthly P&I
- —
- Monthly cashflow
- —
- DSCR
- —
- Eligible?
- —
No personal income docs; deal must DSCR.
Hard money
10% down · 12.0% · 12mo
- Down + closing
- —
- Monthly P&I
- —
- Monthly cashflow
- —
- DSCR
- —
- Eligible?
- —
Short-term bridge; refi at stabilization.
Rent comps 22 comps
| Address | Beds | Baths | Sqft | Rent | $/sqft | DOM | Units | Dist |
|---|---|---|---|---|---|---|---|---|
| 777 5th St West Sacramento, CA | 2.0 | 1.0–2.0 | 878 | $10,000 | $11.38 | 2d | 15 | 0.62mi |
| 500 Douglas St West Sacramento, CA | 3.0 | 1.0–2.0 | 874 | $2,939 | $3.36 | 3d | 22 | 1.00mi |
| 1451 3rd St Sacramento, CA | 3.0 | 1.0–2.5 | 1044 | $3,300 | $3.16 | 4d | 1 | 1.13mi |
| 1900 3rd St Sacramento, CA | 2.0 | 1.0–2.0 | 687 | $2,999 | $4.36 | 44d | 1 | 1.15mi |
| 1900 3rd St Sacramento, CA | 2.0 | 2.0 | 921 | $3,779 | $4.10 | 2d | 1 | 1.15mi |
| 709 Solano St West Sacramento, CA | 4.0 | 3.0 | 1500 | $3,000 | $2.00 | 2d | 1 | 1.22mi |
| 321 T St Sacramento, CA | 2.0 | 1.0 | 800 | $1,800 | $2.25 | 7d | 3 | 1.22mi |
| 317 U St Unit 2 Sacramento, CA | 2.0 | 1.5 | 975 | $1,895 | $1.94 | 7d | 1 | 1.24mi |
| 313 W St Unit 313 Sacramento, CA | 3.0 | 2.0 | 1200 | $2,595 | $2.16 | 4d | 1 | 1.29mi |
| 1421 5th St Sacramento, CA | 2.0 | 1.0–2.0 | 1040 | $4,171 | $4.01 | 2d | 45 | 1.30mi |
| 500 N St Sacramento, CA | 2.0 | 2.0 | 1261 | $2,572 | $2.04 | 44d | 3 | 1.30mi |
| 500 N St Sacramento, CA | 2.0 | 2.0 | 1261 | $2,725 | $2.16 | 15d | 2 | 1.30mi |
| 500 N St Sacramento, CA | 2.0 | 2.0 | 1261 | $2,725 | $2.16 | 24d | 2 | 1.30mi |
| 508 S St Unit 200 Sacramento, CA | 2.0 | 2.0 | 1450 | $3,150 | $2.17 | 24d | 1 | 1.33mi |
| 1500 7th St Sacramento, CA | 2.0 | 1.0–2.0 | 833 | $3,038 | $3.64 | 3d | 29 | 1.35mi |
| 230 Broadway Sacramento, CA | 1.0–2.0 | 1.0–2.0 | 722 | $2,170 | $3.00 | 2d | 29 | 1.37mi |
| 182 Log Pond Ln Sacramento, CA | 2.0 | 2.5 | 1061 | $2,600 | $2.45 | 15d | 1 | 1.44mi |
| 196 Log Pond Ln Sacramento, CA | 2.0 | 2.0 | 1061 | $2,400 | $2.26 | 4d | 1 | 1.45mi |
| 333 Crate Ave Sacramento, CA | 2.0 | 2.5 | 1014 | $2,295 | $2.26 | 24d | 1 | 1.48mi |
| 242 Log Pond Ln Sacramento, CA | 2.0 | 2.5 | 1061 | $2,195 | $2.07 | 18d | 1 | 1.49mi |
| 345 Crate Ave Sacramento, CA | 2.0 | 3.0 | 1014 | $2,400 | $2.37 | 44d | 1 | 1.49mi |
| 357 Crate Ave Sacramento, CA | 2.0 | 2.5 | 1045 | $2,500 | $2.39 | 44d | 1 | 1.50mi |
Listing history 2 events
-
2026-06-19remarks 695-char remark
-
2026-06-19$189,000 Active 1 DOM
ⓘ Source: listings_history table (triggers on properties + properties_extension) + one-shot
backfill from property_details.listing_events for pre-trigger history.
Nearby sold comps map
Loading sold comps map…
Walkable amenities ~0.75 mi
Loading nearby amenities…
Taxation est. · year 1
- Rental income
- $33,207
- − Mortgage interest
- −$10,587
- − Property taxes
- −$2,835
- − Insurance
- −$945
- − Repairs & maintenance
- −$2,657
- − Management
- −$2,657
- − Depreciation
- −$5,498
- Taxable income
- $8,029
- Est. tax owed @ 24.0%
- −$1,927
- After-tax cash flow
- $8,633/yr
For passive investors: Depreciation is non-cash, so a rental often shows a tax loss while cash-flowing — sheltering income. Rental losses are passive: they offset passive income freely, and up to $25,000/yr can offset ordinary (W-2) income if you actively participate and your MAGI is under $100k (phasing out to $0 by $150k); unused losses carry forward. On sale, claimed depreciation is recaptured at up to 25%, and gains may owe capital-gains tax (a 1031 exchange can defer both). Figures are a year-1 estimate at your 24.0% rate — not tax advice; consult a CPA.
Schools (NCES district)
- District
- Washington Unified
- NCES district ID
- 0641580
- Math proficiency
- 30% ▼ -2.00%
- Reading proficiency
- 57% ▲ 12.00%
- Median HH income
- $55,207
- Composite
- 37.79/100
- National rank
- #4339
- State rank
- #197 of 517 in CA
Livability — West Sacramento
- Score
- 73/100
- State rank
- #164
- US rank
- #5389
Category grades
Schools grade is shown separately in the Schools card above.
Census & demographics
- Census place
- West Sacramento, CA
- County
- Yolo County · 212,115 people
- City population
- 55,039
- Metro
- Sacramento-Roseville-Folsom, CA
- Population (ZIP)
- 40,143
- Household income
- $104,750
- Rent vs Own
- Severe rent burden
- 1109.0
Population outlook (Yolo County) Hauer SSP2
- Today (2025)
- 242,183 people
- By 2030
- 257,662 · +6.4%
- By 2040
- 288,050 · +18.9%
- By 2050
- 318,202 · +31.4%
- By 2075
- 392,736 · +62.2%
- By 2100
- 438,150 · +80.9%
Race, ethnicity, and origin ACS 2023
- Neighborhood character
- Diverse neighborhood (Simpson 0.69)
- Race & ethnicity
- White 45% Hispanic / Latino 29% Two or more races 17% Asian 14% Black 3% Native American 1%
- Hispanic origin (detail)
- Mexican 24%
- Common ancestry
- Italian 4% Scotch-Irish 3% Lithuanian 2%
- Foreign-born
- 19% · Canada, China, Vietnam
- Languages at home
- 69% English-only · Spanish 15% Other Indo-European 6% Russian/Polish/Slavic 3%
Political lean MEDSL · Yolo
- 2024 margin
- Solid D (+36.2) · D 66.3% · R 30.1% · Other 3.6%
- 2008→2024 swing
- 0.0pp no change · 2008: 36.2pp · 2024: 36.2pp
- All cycles
- 2024: D+36.2 2020: D+41.4 2016: D+42.0 2012: D+33.2 2008: D+36.2
Not yet ingested
- Civics
- —
Market trends
- HPI YoY
- ▼ -170.47%
- Current HPI
- 316.9399
- Rent YoY
- ▲ 1.87%
- Metro
- Sacramento-Roseville-Folsom, CA
- State GDP YoY
- ▲ 3.21%
- F500 in state
- 116
Industry mix (Fortune 500 HQ in CA)
| Industry | F500 HQs | Revenue |
|---|---|---|
| Technology | 27 | $1,492B |
|
||
| Financial Services | 3 | $174B |
|
||
| Retail | 3 | $44B |
|
||
| Insurance | 3 | $26B |
|
||
| Media / Entertainment | 2 | $115B |
|
||
| Pharmaceuticals / Biotech | 2 | $62B |
|
||
Cash-flow waterfall
monthlySold comps — $/sqft
last 12 mo · ≤1 miLoading sold comps…